Oct 5, 2026 · 14 min read
ESG Strategy
In This Article
Format-specific ESG benchmarks for conferences, trade shows, festivals, and meetings—covering travel, waste, energy, and supplier reporting.
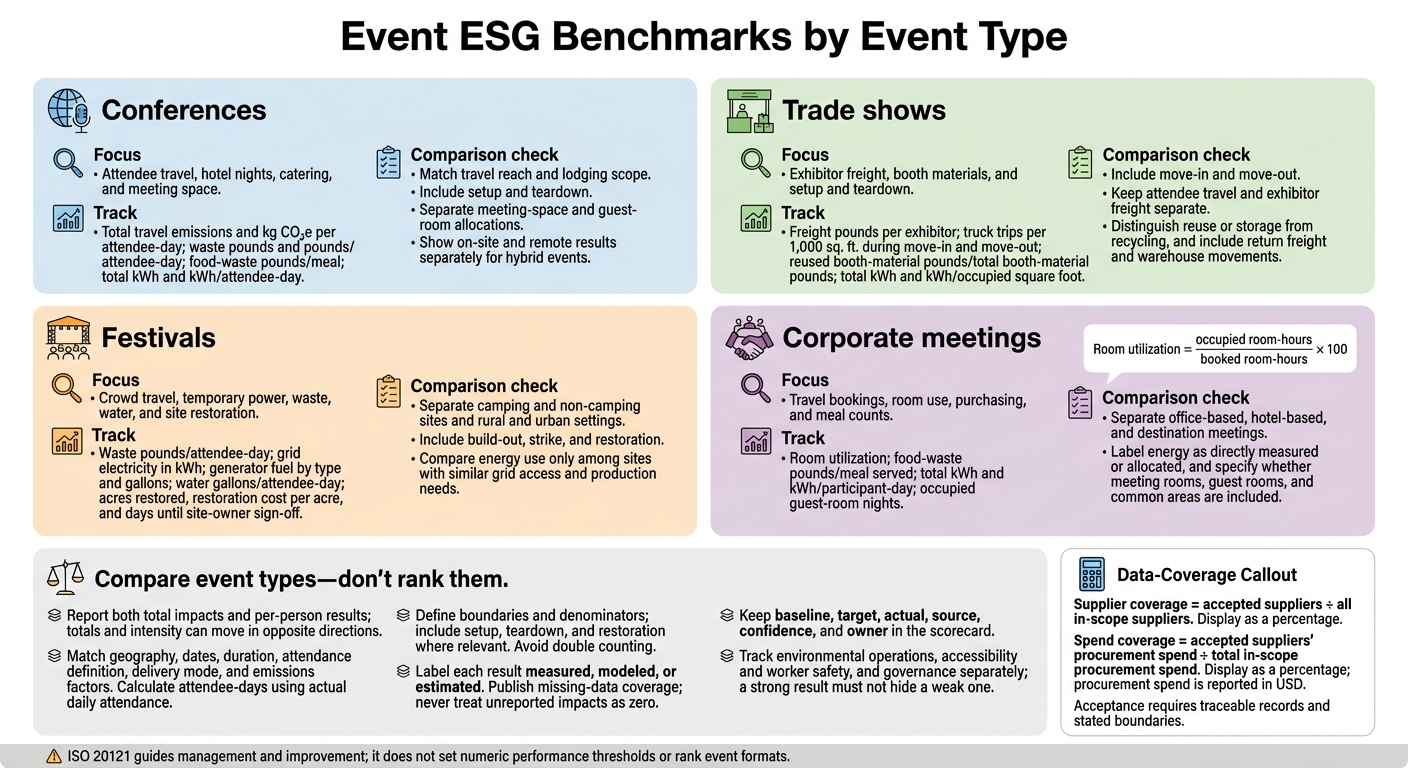
Event ESG Benchmarks by Event Type
I benchmark events by format - not by which type looks “greenest.” I start with total impacts and per-person results, then check reporting boundaries and missing data before comparing performance.
Each format needs a different focus:
Conferences: Attendee travel, hotel nights, catering, and meeting space.
Trade shows: Exhibitor freight, booth materials, and setup and teardown.
Festivals: Crowd travel, temporary power, waste, water, and site restoration.
Corporate meetings: Travel bookings, room use, purchasing, and meal counts.
Quick Comparison
| Event type | Main benchmark focus | Comparison check |
|---|---|---|
| Conferences | Travel emissions and waste per attendee-day | Match travel reach and lodging scope |
| Trade shows | Freight, booth reuse, and hall energy | Include move-in and move-out |
| Festivals | Waste and fuel per attendee-day | Separate camping and non-camping sites |
| Corporate meetings | Room use and food waste per meal | Separate office, hotel, and destination meetings |
For context, the article cites 2025 festival waste averages of 3.0 pounds per attendee-day for camping events versus 1.1 pounds for non-camping events - reference points, not targets.
I keep past results, targets, and outside benchmarks separate. My scorecard records each metric’s source, confidence, and owner, with supplier-data coverage shown as a percentage. I also track accessibility, worker safety, and governance separately: <u>one strong result should not hide another weak one</u>. ISO 20121 guides management and improvement; it does not set numeric performance thresholds.
Event ESG Benchmarks by Event Type
1. Conferences
Travel and Freight
Travel is usually the largest variable for conferences. Benchmarks should focus on travel, hotel nights, catering, and room use. Collect attendee and staff travel data, including origin, traveler count, mode, distance, flight class, ground transfers, and hotel room nights.
Report total travel emissions and kg CO₂e per attendee-day, with domestic and international participants shown separately. Include participant-hours and attendee-days, and define each denominator. State the survey response rate and assumptions used to fill data gaps.
Track freight weight, distance, and mode separately. For hybrid events, include equipment and crew travel for remote production. Travel tells only part of the story; waste and food data show how efficiently the event served attendees.
Waste and Food
Weigh landfill waste, recycling, organics, and food waste separately. Avoid counting food waste twice when it also appears in another waste stream.
Track pounds of food waste per attendee, meals served, the share of plant-forward meals, and surplus food donated. For hybrid conferences, separate on-site catering from remote meal kits, including their packaging and delivery impacts. Adjust catering orders using confirmed attendance.
Energy and Venue Use
Request electricity use in kWh, fuel use, occupied square footage, space-use hours, and setup and teardown periods. For hybrid conferences, report on-site and remote results separately before combining them.
If utility records cover a shared building, document how you allocate usage to the event. Track lodging room nights and hotel energy or emissions separately to prevent double counting.
For virtual conferences, measure streaming hours, platform and production energy, and participant-device use. Report avoided travel as a separate scenario estimate, not proof that digital delivery has no footprint. These figures depend on vendor records, so include supplier reporting requirements from the start.
Supplier Data and Accountability
Write reporting requirements into contracts with venues, hotels, caterers, audiovisual teams, and virtual-event providers. Specify units, methods, supporting evidence, and deadlines.
Request travel records, utility records, room-night reports, waste tickets, food purchase records, and AV production energy data. Label each result as measured, modeled, or estimated. Supplier certifications can support due diligence, but they cannot replace event-specific evidence.
sbb-itb-8baf5f1
ISO 20121 - Event Sustainability Management
2. Trade Shows
Trade shows add exhibitor freight, booth materials, and setup and teardown energy to the impacts seen at conferences. Benchmarks need to separate these sources from attendee travel.
Travel and Freight
Track exhibitor freight separately from attendee travel. Record shipment weight, origin and destination, transport mode, and drayage. Distinguish inbound, outbound, and storage-bound freight without counting any transport leg twice. Compare freight pounds per exhibitor and truck trips per 1,000 sq. ft. during move-in and move-out.[7]
Waste and Food
Track carpet, wood, graphics, packaging, and other booth materials by weight and destination. Reuse and diversion need separate accounting: storing materials for a future show is not recycling after teardown. Break out waste for move-in, show days, and move-out, then compare pounds per exhibitor and per attendee.
Report show-floor catering separately from exhibitor-lounge catering. Track food purchased, surplus donated, and scraps composted.[4]
Booth construction and removal also use energy outside show hours, so material tracking needs to connect with venue energy records.
Energy and Venue Use
Measure exhibit-hall electricity during move-in, show hours, and move-out - not just when the show is open. Report kWh per square foot, per exhibitor, and per open-show hour. Show setup and teardown consumption separately.
Where meters are available, track booth power, lighting, HVAC, and refrigeration. Shut off power on schedule, dim loading-area lighting, and use occupancy-based HVAC during setup and teardown.[5]
These loads span venues, contractors, and exhibitors, making complete data part of the benchmark.
Supplier Data and Accountability
Include material inventories, shipment records, take-back commitments, and reporting deadlines in exhibitor manuals and contractor scopes. Measure data-completeness rates and the share of booths dismantled for reuse or storage.
Incomplete exhibitor reporting makes comparisons between shows less reliable. Keep exhibitor and contractor totals separate to avoid counting materials twice. Publish missing-data coverage alongside results, and never treat unreported impacts as zero.[6][7]
3. Festivals
Festivals move the benchmark beyond indoor operations to crowd movement, temporary power, and site recovery.
Travel and Freight
Track attendee travel by origin, mode, and distance. Report total passenger miles, estimated transportation emissions in metric tons of CO₂e, emissions per attendee, and the share arriving by transit, rail, bike, or on foot. Normalize results by attendees per event day, and disclose emission factors, survey response rates, assumptions, and how you count carpools.[8][10]
Keep attendee travel separate from staff, artist, vendor, and freight travel. Compare urban festivals served by transit separately from rural camping festivals. Schedule shuttle departures around closing times, and measure actual ridership - not just whether shuttles are available.[9][11]
Waste and Food
Measure waste per attendee-day. A Greener Future’s 2025 dataset reported an average of 0.76 kilograms (about 1.7 pounds) per attendee-day. Camping festivals averaged 1.34 kilograms (about 3.0 pounds), while non-camping festivals averaged 0.51 kilograms (about 1.1 pounds) per attendee-day.[8] Treat these figures as reference points, not targets.
Track food vendors’ meal mix, including plant-based and meat-based shares, along with food waste, unsold-food donations, and disposable packaging. Require suppliers to submit standardized reports after the event.
Temporary power, water, and site restoration also shape festival performance.
Energy and Venue Use
Record grid electricity in kWh and generator fuel by type and gallons, including build-out and strike days. Require load and runtime logs to spot oversized generators. Compare electricity and fuel use per attendee-day only among sites with similar grid access, camping arrangements, and production needs.
Track water use per attendee-day, wastewater volume, restroom service frequency, handwashing stations, and sanitation incidents. Document site conditions before setup and after removal. Measure acres restored, restoration cost per acre, and days until site-owner sign-off. Keep site restoration within the reporting boundary.[8][11]
Supplier Data and Accountability
Assign reporting owners before contracting power, food, sanitation, and production suppliers. Require fuel receipts, waste-transfer records, spill reports, and equipment-removal confirmations.
Track the percentage of suppliers with sustainability clauses and the percentage submitting complete data. Label estimates and state their assumptions. Include labor, safety, and permit requirements so the benchmark covers full accountability.[12][15]
4. Corporate Meetings
Corporate meetings typically give organizers tighter control over travel, purchasing, and venue scope than larger public events, allowing for more precise benchmarks. Attendee lists, catering needs, and venue scope are also usually narrower than at conferences or trade shows.
Benchmark office-based, hotel-based, and destination meetings separately. Office-based meetings rely on existing workplace infrastructure. Hotel-based meetings add guest-room energy and water use, catering, and venue services. Destination meetings usually have the highest travel and lodging impacts.[16][17]
Travel and Freight
Use booking records and RSVPs to track attendee origins, travel modes, round-trip miles, traveler counts, nights stayed, and ground transportation. For destination meetings, report the travel-distance distribution by attendee segment. Keep attendee travel separate from supplier freight to show whether transportation, catering, or production logistics drive most emissions.[16][17][19]
With travel mapped, turn to room use.
Energy and Venue Use
Measure room utilization: occupied room-hours ÷ booked room-hours × 100. Track session attendance, square feet used per attendee, occupied guest-room nights, and room-night no-show and cancellation rates.
Report energy use in kilowatt-hours, labeling each figure as directly measured or allocated by area and time. Office meetings should report energy use above normal building operations. Hotel and destination meetings should specify whether the figures include meeting rooms, guest rooms, and common areas.[20]
Waste and Food
Match catering orders to confirmed attendance. Report meals ordered, meals served, and food waste per meal served. Show the shares of plant-based or vegetarian meals and meals served with reusable serviceware as percentages of meals served.
For office meetings, track coffee supplies, disposable foodware, and packaging. Hotel meetings should include banquet kitchen waste and the venue recycling rate. Destination meetings should also account for freight packaging, temporary installations, vendor materials, and equipment packaging.[18][19]
Supplier Data and Accountability
For equipment rentals, require item counts, rental duration, transport distance, power demand, packaging, and reuse or end-of-life details. Include deadlines, data fields, and evidence requirements in contracts and RFPs.[13] Measure the supplier-data completion rate and the percentage of contracted suppliers meeting sustainability requirements.[21]
Comparing Metrics Across Event Types
Compare event types - don’t rank them. Keep comparisons on equal terms: use the same geography, dates, duration, attendance definition, delivery mode, and emissions factors. Count each attendee once, and calculate attendee-days using actual daily attendance. Include setup, teardown, and restoration when they change the reporting boundary.[22][26] The tables below apply these checks to each event format.
Waste and Food
Report total waste, waste per attendee-day, total food waste, and food waste per meal served. Calculate diversion = verified diverted pounds ÷ total measured waste pounds. Report reuse, recycling, composting, anaerobic digestion, donation, landfill, and incineration separately.
State whether energy recovery counts toward diversion, avoid counting donations twice, and clearly define contamination, plant-forward share, and local sourcing. Diversion does not prove prevention, and local sourcing alone does not prove lower emissions.[23] Use the same boundaries when comparing the metrics below.
| Format | Totals and normalized results | Boundary and evidence | Reduction focus |
|---|---|---|---|
| Conferences | Waste pounds and pounds/attendee-day; meals ordered and served; pre- and post-consumer food-waste pounds and pounds/meal | Venue and allocated hotel operations, including setup/teardown; scale tickets and catering logs | Right-size catering; remove unnecessary printed materials; use reusable serviceware |
| Trade shows | Separate exhibitor, contractor, and visitor waste pounds; pounds/attendee-day; reused booth-material pounds/total booth-material pounds | Booth build, public areas, and dismantling; decorator inventories, hauler tickets, take-back receipts | Require modular booth systems, rental graphics, take-back programs, and packaging controls |
| Festivals | Vendor packaging, litter, and backstage waste pounds; pounds/attendee-day; donated food pounds | Public areas, vendors, camping where applicable, and restoration; zone audits, vendor records, donation receipts | Set packaging rules; provide clearly labeled collection stations; audit litter after close |
| Corporate meetings | Waste pounds and pounds/participant-day; food-waste pounds/meal; disposable-item counts | Meeting and catering boundary; purchase records, waste weights, recipient receipts | Use guaranteed-plus-buffer meal ordering, reusable name badges, and digital materials |
Energy and Venue Use
Report electricity in kWh, fuel and water in gallons, and space in square feet. Building allocations are modeled estimates, not direct event measurements. Report accessibility separately from energy metrics.[2]
| Format | Metrics | Boundary and data owner | Allocation limit |
|---|---|---|---|
| Conferences | Total kWh and kWh/attendee-day; water gallons and gallons/attendee-day | Venue and hotel: lighting, HVAC, audiovisual equipment, kitchens, setup/teardown | Separate meeting-space and guest-room allocations |
| Trade shows | Total kWh and kWh/occupied square foot; water gallons and gallons/attendee-day | Venue and exhibitors: hall systems, booth loads, move-in/move-out | Report operating hours; distinguish booth loads from shared systems |
| Festivals | Grid kWh, generator fuel gallons, water gallons; each per attendee-day | Producer and contractors: site zones, temporary structures, sanitation, restoration | Do not convert fuel use to electrical output; identify generation estimates |
| Corporate meetings | Total kWh and kWh/participant-day; room-hours and occupied square feet | Venue: meeting-room lighting, HVAC, and audiovisual loads | Whole-building estimates cannot be compared directly with room-meter readings |
Travel and Freight
Keep travel and lodging separate from on-site activity. Report emissions in metric tons of CO2e, both as totals and per attendee or attendee-day. Calculate mode share using only travelers whose modes are known, and report unknown modes separately.[24][25][27] Keep passenger travel, freight, and production logistics distinct so comparisons don’t blend different activities.
| Format | Priority totals and normalized results | Evidence | Comparison limit |
|---|---|---|---|
| Conferences | Attendee, employee, and speaker passenger-miles; room nights; total and per-attendee travel CO2e | Booking records, origin surveys, hotel records | Match geographic reach and lodging boundaries |
| Trade shows | Visitor/exhibitor passenger-miles; freight pounds and miles; total and per-attendee CO2e | Bills of lading, carrier data, exhibitor surveys | Include return freight and warehouse movements; keep freight separate |
| Festivals | Audience, artist, vendor, contractor, and crew travel; production freight; total and per-attendee-day CO2e | Production schedules, fuel logs, audience surveys | Separate rural/urban settings and camping arrangements |
| Corporate meetings | Employee journeys, local transportation, room nights; total and per-participant CO2e | Travel bookings, room blocks, shuttle records | Compare office, hotel, and destination meetings separately |
Supplier Data and Accountability
Calculate supplier coverage as accepted suppliers ÷ all in-scope suppliers. Calculate spend coverage as those accepted suppliers’ procurement spend ÷ total in-scope procurement spend, with spend reported in USD. Define acceptance using traceable records and stated boundaries. Signed declarations alone do not provide independent assurance.[3]
| Format | Coverage metric and owner | Preferred evidence | Fallback and confidence |
|---|---|---|---|
| Conferences | Count/spend coverage; organizer and venue | Utility records, catering logs, rental invoices | Documented questionnaires; medium confidence where allocations remain |
| Trade shows | Count/spend coverage, split organizer/exhibitor; organizer and contractor | Freight records, material inventories, take-back receipts | Sample-based estimates; report exhibitor confidence separately |
| Festivals | Count/spend coverage; producer and vendors | Fuel logs, packaging records, sanitation and restoration records | Zone audits and models; low confidence for unreported vendors |
| Corporate meetings | Count/spend coverage; meeting owner and purchasing team | Contracts, invoices, travel and venue records | Spend-based estimates; low confidence for resource quantities |
Benchmarking Strengths and Limits
Even with the right metrics, gaps in data coverage can skew comparisons between event formats. The easiest data to collect often misses the biggest impact. Registration records show attendance, not flights. Invoices show spending, not shared-office energy use. Treat coverage as a partial view - not proof that everything has been measured.
| Event type | What data captures | What data misses | How to close gaps |
|---|---|---|---|
| Conferences | Registration, check-ins, venue records, and room-block bookings establish attendance and venue use. | Independently booked travel, room nights outside the block, and side trips. | Collect origin ZIP codes and travel modes during registration or through follow-up surveys; request official room-block nights; report coverage and uncertainty. |
| Trade shows | Exhibitor counts, floor-area records, venue utilities, and service orders support space and material tracking. | Freight, booth construction, storage, disposal, and reuse records spread across suppliers and exhibitors. | Give each exhibitor a separate ID; require freight and material fields in service orders; assign responsibility for each shipment and reuse stream. |
| Festivals | Production schedules, fuel logs, equipment inventories, and hauler records track temporary power, equipment, and waste. | Daily attendance changes, walk-ins and unregistered visitors, satellite sites, and dispersed vendors. | Use ticket scans or validated daily counts; maintain a temporary-equipment register; require vendor templates; flag missing vendor and satellite-site records. |
| Corporate meetings | Centralized contracts, purchase orders, bookings, venue bills, and supplier lists improve consistency. | Property-level utilities, travel outside corporate systems, and untracked catering or purchases. | Reconcile booking and purchasing records; allocate shared-office energy using a documented method; label modeled data; avoid double counting with the company inventory. |
These checks reduce bias, but they don't make uneven datasets directly comparable.
Totals and intensity can move in opposite directions. Report both so readers can distinguish efficiency gains from absolute reductions.
When new data fills earlier gaps, reported impact may increase even if event activities haven't changed. Reset the baseline when methods change, and never treat partial and full coverage as equal.
ISO 20121 supports internal management and continual improvement; it does not rank event formats. Use consistent baselines and defined evaluation methods. Explain material differences in boundaries or evidence rather than declaring one format better than another.[12][28]
Conclusion: Match Benchmarks to Event Needs
Use the format-specific benchmarks above to assess each event on its own terms, rather than forcing all formats into one ranking.[1][29]
Bring those benchmarks into one scorecard with baseline, target, actual, source, confidence, and owner for every metric. Use standard units and retain the underlying records so others can reproduce each result.[30][32]
Track event operations separately from social indicators, such as accessibility and worker safety, and governance indicators, such as supplier requirements and corrective actions. A strong accessibility result should not hide high emissions within a combined score.[14][33]
After each event, review the results, assign actions and deadlines, and verify changes before updating targets. Let the scorecard guide the next procurement cycle. Carry unresolved data gaps into supplier contracts so the next event improves on the last.[1][31]
FAQs
How do I set realistic ESG targets for my event type?
Start by measuring your event’s footprint accurately, using metrics such as carbon per meeting-space hour or waste diversion rates. Then set SMART targets: Specific, Measurable, Attainable, Relevant, and Time-bound. Compare your results with industry peers to separate internal inefficiencies from outside factors, such as regional energy infrastructure.
Council Fire can use these findings to build tailored plans with clear actions that align with your mission and sustainability goals - and account for the limits of your day-to-day operations.
Which ESG metrics should I prioritize on a limited budget?
Focus on high-impact metrics you can measure and act on directly. Start with a materiality assessment to identify your organization’s greatest ESG risks and opportunities.
Track Scope 1 and 2 emissions and total energy consumption using utility bills and fuel receipts. For social and governance data, start with employee headcount, safety incident rates, and board composition. These core metrics provide a sound baseline for future reporting.
How can I benchmark events with incomplete supplier data?
Build your data approach in phases. Start with spend-based estimates for immaterial categories, move to activity-based calculations, and work toward primary supplier-specific data.
Document your methods and the assumptions you make when data is missing. Fill gaps with industry-standard databases or aggregated benchmarks, while prioritizing primary data whenever possible. Use standardized supplier request templates to keep measurement units consistent and make the data more reliable.



FAQ