In This Article
Forecast expected ESG results under stated assumptions and use scenario analysis to test resilience, triggers, and budgets.
On this page
ESG Forecasting vs. Scenario Analysis: Uses Compared
I use ESG forecasts to plan expected results - and scenario analysis to test whether that plan holds up when conditions change. Start with a forecast tied to approved spending, then test two or three different futures before making costly, hard-to-reverse decisions.
Here’s how I separate the work:
Forecasting: Estimate costs, resource needs, cash flow, and target progress using stated assumptions.
Scenario analysis: Test how policy shifts, energy prices, supply disruptions, and climate hazards could affect those results.
Using both: Support budgets, targets, investments, risk reviews, reporting, and day-to-day decisions.
Quick Comparison
| Comparison | ESG forecasting | Scenario analysis |
|---|---|---|
| Main question | What do we expect the funded plan to deliver? | How would the plan perform under different conditions? |
| Inputs | Baseline data, operating drivers, approved projects | External pathways, hazard data, changed assumptions |
| Time frame | Any period where assumptions remain sound | Often longer periods or major changes |
| Uncertainty | Central estimates, sometimes with ranges | Different futures, not necessarily ranked by likelihood |
| Financial use | Budget and cash-flow planning | Stress tests and funding triggers |
| Main limit | Assumptions may stop holding | Selected scenarios cannot cover every disruption |
My rule is simple: <u>keep expected results separate from hypothetical outcomes</u>. Neither method sets target ambition or guarantees delivery. I connect both to named owners, review dates, and action triggers - so the analysis guides decisions, not just reporting.
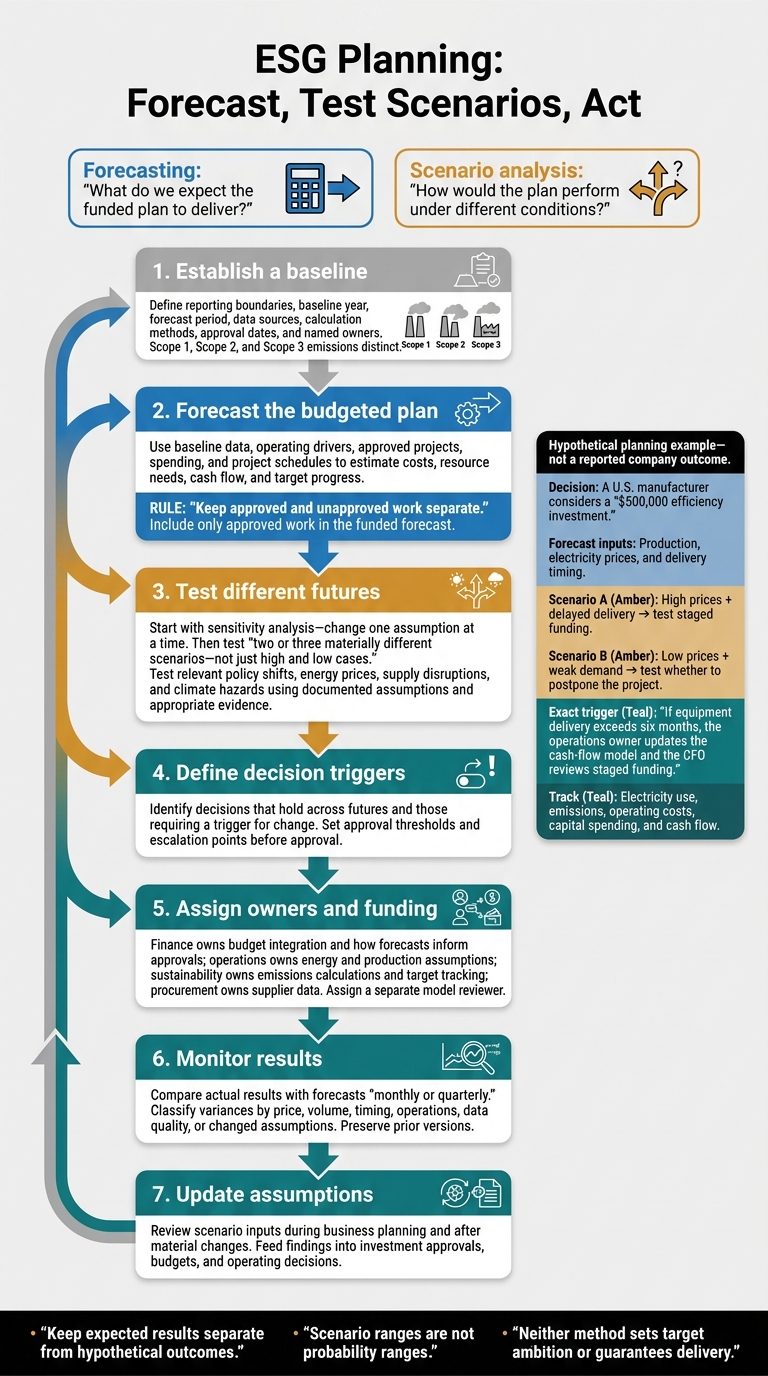
ESG Planning: Forecast, Test Scenarios, Act
What ESG Forecasting and Scenario Analysis Show
ESG Forecasting: Expected Results Under Stated Assumptions
An ESG forecast shows what a plan is likely to deliver under stated assumptions. It turns historical results, production volumes, headcount, utility prices, approved budgets, and project schedules into an expected performance path. Keep approved and unapproved work separate, and include only approved work in the forecast. Use it to plan budgets, staffing, and progress toward targets.
Forecast energy, water, waste, retention, safety, supplier screening, corrective-action closure, and compliance staffing needs. Pair performance metrics with expected target progress, resource needs, and financial effects. For governance, track control failures and investigation closure times - not just training completion.
A clear baseline matters more than precision. Document reporting boundaries, calculation methods, data owners, operating-volume assumptions, and implementation dates. Distinguish Scope 1, Scope 2, and Scope 3 emissions.[4] Keep organizational boundaries consistent. Use ranges when supplier data or project timing is uncertain, and update projections as actual results or conditions change.
With the expected path defined, scenario analysis tests where the plan could fall short.
Scenario Analysis: Results Across Possible Futures
Scenario analysis changes the conditions around a plan to test how it performs.
Relevant pathways may include business as usual, accelerated decarbonization, or severe physical hazards.
Test policy, carbon prices, technology, energy costs, hazard exposure, supply and demand, labor availability, and stakeholder pressure. Use well-supported external pathways and documented internal assumptions, backed by site-level hazard data. Global climate pathways alone cannot establish a site's flood or heat exposure.[6]
The goal is to identify vulnerabilities, opportunities, and decisions - not simply produce different numbers.
Link labor shortages to wage pressure, supplier disruption to delivery gaps, and regulatory change to compliance workload.
Show which decisions hold across possible futures and which need a trigger for change. When data is limited, use qualitative analysis and support its assumptions.[1] Scenario ranges are not probability ranges. Do not present a midpoint as the expected outcome unless probabilities are explicitly assigned.
sbb-itb-8baf5f1
Scenario Analysis for researchers and managers & top TEN tips for scenario analysis!
ESG Forecasting vs. Scenario Analysis: Uses and Limits
The choice starts with the decision. A forecast is a management case, not a probability-weighted prediction. Calling it “expected” does not mean other outcomes have been assigned probabilities.[7][8] The table below shows where each method fits.
Which Method Fits the Decision?
Choose based on uncertainty, time horizon, and how hard the decision would be to reverse - not organization size. Routine spending needs a workable planning estimate. A costly, hard-to-reverse commitment needs testing across different futures.
| Decision need | ESG forecasting | Scenario analysis | Best-fit approach | Key evidence | Main limitation |
|---|---|---|---|---|---|
| Budget planning | Estimate annual costs, savings, emissions, and operating needs | Test energy prices, carbon costs, regulation, and project delays | Forecast, then stress-test | Utility costs, contracts, project schedules, policy assumptions | A central budget can miss shocks |
| Target setting | Estimate whether initiatives will meet milestones | Test delivery under different external conditions | Both | Baseline, implementation plans, target-setting criteria, technology and policy pathways | Delivery depends on execution and external conditions |
| Capital allocation | Estimate returns, cash flow, costs, and ESG effects | Test assets across transition and physical-risk pathways | Both, especially for long-lived assets | Capital costs, asset lives, hazard and transition assumptions | Long-term returns depend on uncertain conditions |
| Risk management | Monitor expected exposure and deviations | Examine stress conditions, nonlinear impacts, and resilience | Forecasts for baseline; scenarios for stress | Exposure data, dependencies, stress assumptions | Neither method accounts for every disruption |
| Performance reporting | Project progress and explain variances | Support risk and resilience disclosures | Forecast progress; disclose resilience | Consistent metrics, actual results, documented assumptions | Expected and hypothetical outcomes must remain distinct |
| Operating decisions | Plan near-term staffing, energy, and materials | Test durable commitments under uncertain conditions | Forecasts for routine choices; both for durable commitments | Operating drivers, supplier data, asset constraints | Historical patterns may break down |
This distinction matters most when approval depends on both execution and ambition. Delivery confidence and target ambition are separate questions. A forecast shows whether funded work can reach a milestone; it does not prove that milestone is ambitious enough. For investment approval, assess expected cash flow alongside the conditions that would make returns unacceptable.
Strengths and Limits of Each Method
Forecasts can support more than short-term plans. They remain useful as long as their assumptions hold. Scenario analysis depends on evidence that stands up to scrutiny and on whether the selected futures test the decision’s key dependencies.[7][8]
| Factor | ESG forecasting | Scenario analysis |
|---|---|---|
| Data requirements | Often relies on historical data, consistent metrics, and operating plans | Can address structural change but still needs well-supported evidence and pathways |
| Time horizon | Useful wherever assumptions remain sound; often supports annual plans | Especially useful for long horizons and structural uncertainty |
| Treatment of uncertainty | Provides a central estimate, potentially with ranges or probability distributions | Examines materially different futures without necessarily ranking likelihood |
| Decision speed | Often faster once recurring data processes exist | Often requires more design and stakeholder input |
| Communication | Central estimates are accessible but can imply certainty | Makes uncertainty explicit but requires clear explanations of assumptions |
| Financial integration | Connects readily to budgets and expected cash flows | Tests financial exposure and contingent funding needs |
| Resilience testing | Limited when underlying assumptions remain unchallenged | Tests plans across disruptions; coverage depends on scenario design |
Match the depth of analysis to financial exposure. Use qualitative analysis when the evidence cannot support precise estimates. Add quantitative modeling for material exposures where the data supports it. For in-scope entities, IFRS S2 requires proportionate climate scenario analysis; it does not prescribe one model or one scenario.[2][9]
How to Use Forecasts and Scenarios in ESG Planning
Set a Baseline and Connect Forecasts to Budgets
Define the reporting boundary, baseline year, forecast period, data sources, calculation methods, approval dates, and named owners. Use version control, reconciliation checks, and an audit trail to keep the numbers traceable. Smaller organizations can begin with electricity, fuel, Scope 1 and Scope 2 emissions, headcount, workplace incidents, major suppliers, and approved capital projects.[5][3] This baseline gives scenario testing a clear reference point.
Link operating drivers directly to the budget. Production volume drives electricity demand; fleet miles drive fuel use; headcount drives workforce costs; and supplier spending drives procurement coverage. For each approved initiative, record spending, cash-flow timing, contribution to targets, and dependencies such as permits or equipment delivery. Keep unapproved initiatives outside the funded forecast so their potential gains don’t appear as committed progress.
Test Scenarios and Define Decision Triggers
Start with sensitivity analysis: change one assumption at a time to identify which drivers matter most. Then test two or three materially different scenarios - not just high and low cases. Include conditions outside recent historical experience, and document each scenario’s assumptions, time horizon, and affected operations.[5][2] Use the results to set approval thresholds and escalation points.
Hypothetical planning example - not a reported company outcome: A U.S. manufacturer considering a $500,000 efficiency investment would forecast production, electricity prices, and delivery timing. A high-price, delayed-delivery scenario would test staged funding; a low-price, weak-demand scenario would test whether to postpone the project. Track electricity use, emissions, operating costs, capital spending, and cash flow. Use only documented engineering estimates, utility data, production assumptions, and emissions factors. Set triggers before approval: if equipment delivery exceeds six months, the operations owner updates the cash-flow model and the CFO reviews staged funding. Record the monitoring frequency, data source, and decision authority.
Assign Owners and Review Assumptions
Clear ownership makes the model part of day-to-day management. For forecast updates and scenario reviews, finance should own budget integration and how forecasts inform approvals. Operations should own energy and production assumptions; sustainability should own emissions calculations and target tracking; procurement should own supplier data. Assign a separate model reviewer.
Compare actual results with forecasts monthly or quarterly. Classify variances by price, volume, timing, operations, data quality, or changed assumptions, and preserve prior versions. Review scenario inputs during business planning and after material changes.[5] Bring findings into investment approvals and stakeholder discussions, including open corrective actions and major-supplier review coverage, where relevant.
Conclusion: Forecast for Plans, Test for Resilience
Forecasts estimate likely performance under stated assumptions; scenarios test whether a strategy holds up across plausible futures. Neither sets ambition or guarantees results. Leaders set ambition based on science, regulation, stakeholder expectations, and capacity.
Use both in a repeatable cycle: establish a baseline, forecast the budgeted plan, test scenarios, define triggers, assign owners and funding, monitor results, and update assumptions regularly. This keeps budgets ready for action and targets grounded as conditions change.
FAQs
How do I budget when scenarios challenge my forecast?
Test financial resilience with scenario-based planning, not a single forecast. Build scenario assumptions into discounted cash flow models, project rankings, and capital investment reviews. Favor investments that hold up across several possible futures, and flag projects that work only under optimistic conditions.
Split spending into no-regrets actions to take now and flexible actions that keep your options open. Set specific monitoring triggers so you know when to adjust the budget.
What if my ESG forecast falls short of targets?
Treat the shortfall as a chance to improve, not a failure. Review performance data and stakeholder feedback to find the root causes. Use real-time monitoring to spot deviations and address them promptly.
Be open with stakeholders about the challenge to build trust. Update your action plans and adjust your strategy to get back on track, while keeping ESG efforts tied to core business operations.
How do I choose scenarios with limited data?
Start with qualitative scenarios - narratives and what-if stories centered on your most material risks. Draw on available internal data, including asset locations, supply chain dependencies, and workforce distributions. Where data is missing, use proxies. You don’t need perfect information to get started.
As your data improves, add quantitative modeling and a broader range of climate projections. Use established frameworks such as TCFD, SASB, or ISSB to guide and refine your analysis, rather than trying to model every variable at once.



FAQ