
Sep 8, 2026
ESG Data Management: Portfolio Guide
ESG Strategy
In This Article
Treat ESG data as a year-round portfolio system that powers decisions, not a year-end reporting chore.
ESG Data Management: Portfolio Guide
Bad ESG data slows portfolio decisions. If data is late, incomplete, or inconsistent, teams miss risk signals, struggle with LP reporting, and spend too much time fixing spreadsheets instead of using the numbers.
I’d sum up the article this way: treat ESG data as a year-round portfolio system, not a year-end report task. That means I need to set clear data intake rules, assign owners, apply validation checks, connect data to reporting and investment review, and use systems that fit the portfolio.
A few facts make the case clear:
71% of institutional investors say incomplete and inconsistent ESG data is a major barrier to ESG use.
88% of executives rank data quality among their top three ESG problems.
ESG ratings often disagree: one study found an average correlation of 0.61 across major providers.
If I want a process that works, I need to focus on five things:
Set one core metric set linked to sector risk, fund goals, and impact aims
Map each metric to a source, owner, and due date
Use validation rules and coverage thresholds before numbers reach reports
Link source data to disclosures, dashboards, and committee reviews
Build roles, workflows, and systems that can support growth across the portfolio
In short, the article is a blueprint for turning ESG data from a reporting burden into a decision tool. Collect, govern, test, use, improve.
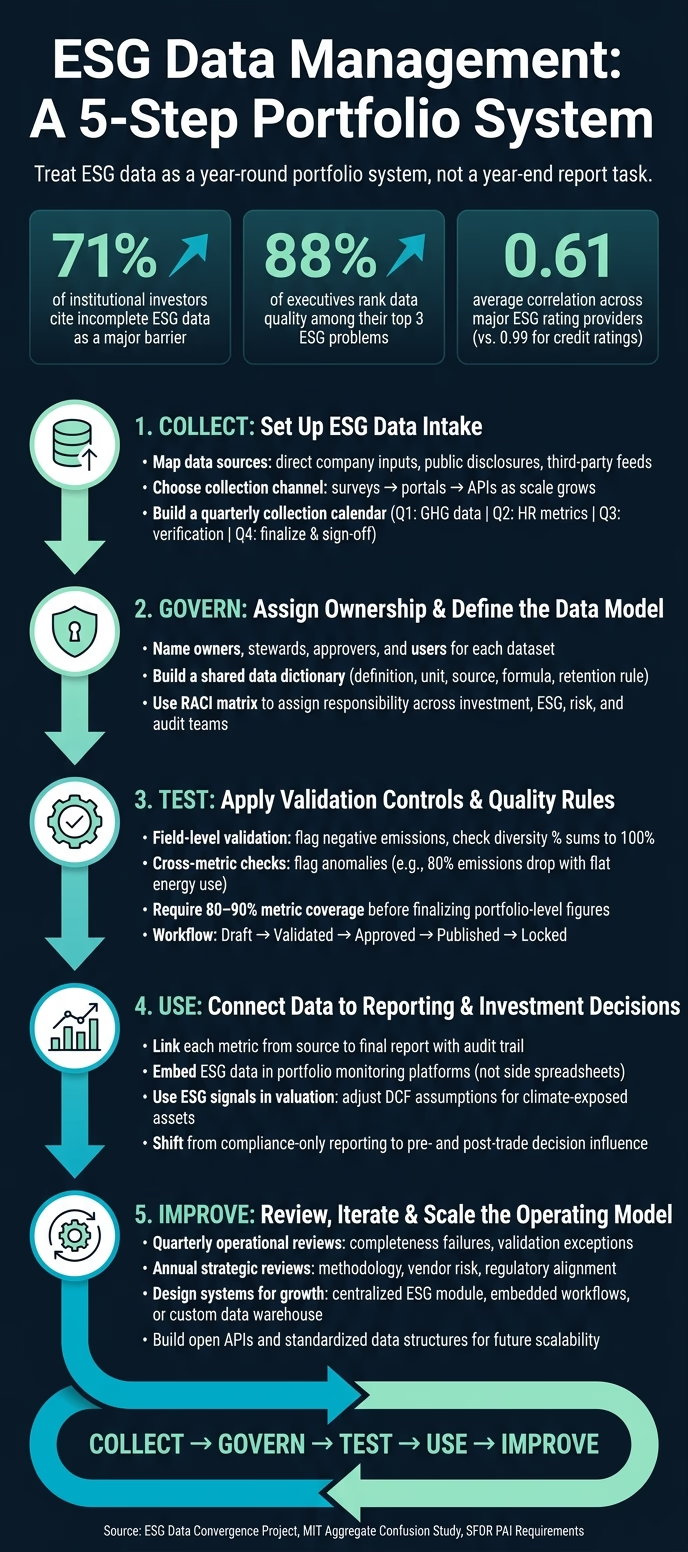
ESG Data Management: 5-Step Portfolio System
Collecting better ESG data - Challenges and best practices from the industry
1. Set Up ESG Data Intake Across the Portfolio
A solid intake process comes down to three calls: where the data comes from, what you’ll collect, and when it’s due. Skip that structure, and reporting season turns into a cleanup job full of mismatched numbers and version-control headaches. The best place to start is simple: map each source to a metric and an owner.
Map data sources and collection channels
Most portfolios work with four main ESG data source categories: direct company inputs, internal sources, public disclosures, and third-party data and analytics. Private portfolios lean more on company input and internal data. Public portfolios can rely more on filings, sustainability reports, and vendor feeds. In mixed portfolios, it helps to assign one primary source to each indicator.[4][6][1][5]
The collection channel matters just as much as the source. Surveys and standardized questionnaires are often the right fit for early-stage or smaller private companies that are reporting ESG data for the first time.[4] Once you’re dealing with dozens of holdings and repeat reporting cycles, secure web portals make more sense. They support role-based access, validation rules, and audit trails.[5][2] APIs and automated data feeds are a better match for public market portfolios and more advanced managers using integrated ESG data platforms. Pulling regulatory metrics such as Scope 1–3 emissions straight from a provider can cut a lot of manual work.[2][1]
A useful example comes from the ESG Data Convergence Project. GPs collect data annually through their existing systems and submit KPIs through a standard Excel template or a secure file-transfer channel, which gives LPs more comparable data across the portfolio.[9][10][11]
Choose metrics that fit the portfolio strategy
Define a core metric set based on sector materiality, fund goals, and reporting duties.
Start with financially material ESG issues by sector. For heavy industry, that may mean energy use and GHG intensity. For tech, data privacy may sit near the top. For services, labor practices often matter most. Then layer in any required reporting items. For managers subject to SFDR, that includes the 18 mandatory Principal Adverse Impact (PAI) indicators, including greenhouse-gas emissions, fossil fuel exposure, board diversity, and controversial weapons exposure.[7]
From there, add fund-specific impact metrics tied to the theory of change. A climate resilience fund might track avoided emissions and the share of revenue from climate adaptation solutions. A social outcomes fund might track affordable housing units created and jobs for target populations.
The aim is not to collect everything. It’s to build a core set that works across the portfolio, then add a small number of extra metrics by sector or impact theme when they support decisions or LP commitments.
That metric set should drive the collection calendar.
Build a practical collection calendar
Aligning ESG data collection with quarterly U.S. reporting cycles keeps the process easier to run. A common pattern looks like this:
Q1: confirm reporting boundaries and collect full-year energy and GHG data
Q2: collect headcount, gender balance, training hours, turnover, and health and safety incidents
Q3: run verification checks and review holdings for exposure to climate-intensive sectors or controversial activities
Q4: finalize annual metrics, complete PAI indicators at the portfolio level, and secure management sign-off before disclosures go out[5][7]
The table below shows why the intake channel you choose can shape the process long after the first reporting cycle:
Aspect | Manual intake (email + spreadsheets) | Platform-based intake (portal + APIs) |
|---|---|---|
Scalability | Limited; version control breaks down as holdings and metrics grow | High; centralized storage and automated aggregation handle large volumes |
Error risk | High; copy-paste errors, inconsistent templates, and formula mistakes are common | Lower; built-in validation rules and controlled data models reduce human error |
Auditability | Weak; tracking changes across multiple files and email threads is difficult | Strong; role-based access and change logs support regulatory and client assurance |
Staff time | High; teams spend significant time chasing responses and reconciling versions | Lower over time; automated reminders and imports free staff for analysis |
At scale, portal-based intake improves response rates, auditability, and carbon-data coverage.[8]
Once intake is defined, the next step is ownership, validation, and quality control.
2. Build Governance, Controls, and Data Quality Rules
Once intake is set up, governance is what makes ESG data traceable, comparable, and ready for sign-off.
A good intake process can still fall apart if no one owns the data after it comes in. When ownership is fuzzy, definitions drift, numbers stop matching, and the data becomes risky to use in reports or investment decisions.
Assign ownership and define the data model
Governance starts with people, not tools. Each dataset needs named owners, stewards, approvers, and users, with clear authority to ingest, validate, approve, and view data. Second-line risk and compliance teams should set standards and challenge methodologies, while internal audit tests the full data chain from source to output.
Use one shared model for entities, metrics, and time periods across companies, funds, assets, projects, and beneficiaries. That model should cover both financially material ESG data, such as carbon intensity, labor practices, and governance flags, and impact data, such as avoided emissions, affordable units created, and jobs for target populations. Both need the same level of rigor.
Formalize roles with charters, role descriptions, and workflow diagrams. Access should follow least-privilege rules and segregation of duties. In plain English: analysts should be able to view and analyze data, stewards should be able to edit and validate raw inputs, and approvers should be able to lock and publish final values.
Alongside roles, build a data dictionary before the first data call goes out. For each metric, document:
definition
unit
source
formula
retention rule
It also helps to document one sample metric in full so everyone can see what “complete” looks like.
Apply controls that reduce reporting and decision risk
Once ownership and definitions are set, controls keep the data clean through the reporting cycle. That matters because disclosure and investment decisions should rest on numbers that can be compared without guesswork.
Field-level validation rules catch obvious problems early. Negative emissions values can be flagged right away. Diversity percentages can be checked to make sure they sum to 100%. Dates can be tested to confirm they fall inside the reporting period. Cross-metric checks go one step further. If a company reports an 80% drop in emissions while energy use stays flat, the system should flag that record for steward review before it moves ahead.
Completeness thresholds matter too. A common standard is requiring at least 80% to 90% coverage of key ESG metrics across portfolio companies before finalizing portfolio-level figures [17][18]. Missing inputs should move into a remediation queue. A close-style workflow helps here: Draft → Validated → Approved → Published. After that, lock the reporting period.
If a material error shows up after the lock, such as a large asset left out of the emissions inventory, treat it as a documented restatement. Keep both the original value and the corrected value in the system. That kind of paper trail is boring until the day you need it.
Review ESG data risk on a regular basis
ESG data needs its own review rhythm. Quarterly operational reviews can catch completeness failures, validation exceptions, and alerts tied to stale data. Annual strategic reviews should look at methodology choices, vendor risk, and alignment with changing regulations and standards.
The MIT "Aggregate Confusion" study found that the average correlation between ESG ratings from major providers is 0.61, compared with 0.99 between Moody's and S&P credit ratings, and that measurement differences explain roughly 53% to 56% of total ESG rating divergence [15][14][16]. That is a noisy signal. It’s also a clear sign that internal governance and standardization are not optional.
The table below maps common ESG data risks to the controls and evidence used to address them:
ESG Data Risk | Control Techniques | Oversight Actions | Audit Evidence |
|---|---|---|---|
Missing or incomplete inputs | Required fields; completeness thresholds; fallback rules | Quarterly data quality reviews; escalation to data owner | Completeness reports; exception logs; remediation records |
Inconsistent methodologies | Standardized calculation rules; controls for methodology changes | Methodology approval by ESG/risk committees | Approved methodology documents; version histories |
Outdated figures | Scheduled data refresh; date-stamping; alerts for outdated data | Periodic aging analysis; review of longest-outstanding data | Aging reports; refresh logs; time-stamped data extracts |
Undocumented vendor assumptions | Vendor due diligence; documented source hierarchy | Annual vendor reviews; sample back-testing | Vendor evaluation files; methodological summaries |
Bias in impact measures | Diverse indicator sets; stakeholder input; sensitivity tests | Governance review of impact frameworks; challenge sessions | Impact framework documents; review minutes; scenario analyses |
The Dutch Authority for the Financial Markets (AFM) found that many asset managers rely on one or more third-party ESG data providers for most of their ESG needs and have started formalizing responsibilities, including data owner and data steward roles [12][13]. That lines up with what works in practice: pair role clarity with a risk register and regular reviews so problems are fixed before they spill into portfolio decisions or disclosures.
With these controls in place, the same data can support reporting, portfolio monitoring, and investment review.
3. Connect ESG Data to Reporting, Risk Review, and Investment Decisions
Once governance and controls are in place, the next move is simple: make sure ESG data is actually used. Not just stored, not just cleaned up for year-end reports, but built into the reports, risk reviews, and investment calls that shape the portfolio.
Link data to reporting and disclosure workflows
Each core ESG metric - portfolio emissions, diversity figures, engagement activity, impact outputs - needs a clear path from source to final report. That means documenting where the metric starts, who checked it, and which report it ends up in.
For investor-facing reporting, a standard quarterly ESG and impact pack should sit at the center of the process. Usually, that means a PDF plus a dashboard, both pulling from the centralized data platform through scheduled exports or APIs. Version control and audit trails should be built in, not added later as a patch. Board updates should stay focused on the numbers that matter most in oversight discussions: carbon intensity, climate-sensitive exposure, and progress against impact targets.
Foundation and grantor reporting is often a different beast. Many funders ask for custom metric sets tied to specific SDG mappings or program goals. The cleanest way to handle that is with templates that connect metrics to each grantor requirement and generate outputs automatically.
For U.S. and cross-border filings, it helps to avoid the usual scramble by mapping each jurisdiction back to the same underlying dataset. Keep a shared calendar, assign named owners, and maintain a dated change log so everyone can see what changed, when, and why.
Once that reporting path is nailed down, the same dataset should flow straight into portfolio monitoring and committee review.
Use ESG data in portfolio monitoring and risk review
ESG data should live inside the main portfolio monitoring platform, not in a side spreadsheet or a siloed tool that only a few people touch.
ESG integration means using material ESG factors in investment analysis and decisions, so the data has to show up where those decisions happen. Automated alerts can help here. Set triggers for controversy thresholds, score drops, or emissions below target, then route those items to watch lists and documented review.[19] Quarterly trend tracking in emissions intensity, safety, and diversity helps teams tell the difference between holdings that are improving and those moving in the wrong direction.
Exposure reviews should pair ESG metrics with financial data to calculate risk-weighted positions. For example, teams can measure how much of the portfolio sits in companies without credible transition plans, or how much value is tied up in sectors facing high physical climate risk. Those reviews should feed regular portfolio committee meetings, where underperforming assets are flagged for follow-up. That follow-up might mean engagement, position sizing changes, or escalation, and the outcome should be recorded in meeting minutes and task trackers.
ESG data can also shape valuation assumptions in a direct way. A company with major assets in flood-prone regions may call for higher expected capital expenditures for resilience and adjusted margin assumptions in discounted cash flow models. On the other hand, a renewable energy developer with strong community relations may support a lower risk premium.
Those signals matter only if they reach investment discussions early enough to affect position sizing, engagement, or exit decisions.
Move from compliance reporting to portfolio-level insight
Reporting ESG data is not the same as using it.
The real shift happens when ESG insight moves out of the back office and into investment committee discussion. You can see it when a worsening emissions trajectory changes a position size, when failed engagement leads to an exit review, or when strong impact performance supports adding to a position. That’s when the data starts doing real work.
Aspect | Compliance-Only Reporting | Full ESG Integration |
|---|---|---|
Data depth | Minimum required metrics; basic emissions totals; high-level policies | Granular, decision-ready data: intensity metrics, scenario outputs, asset-level risk indicators, detailed impact KPIs |
Decision influence | ESG data rarely changes investment theses; reports produced after decisions | ESG data used pre- and post-trade to adjust valuations, position sizes, engagement strategies, and capital allocation across sectors and themes |
Stakeholder insight | Static snapshots; aggregated and backward-looking | Dynamic, forward-looking analyses showing how ESG factors shape resilience, growth prospects, and progress toward impact goals |
Value creation | Focus on avoiding non-compliance and reputational risk | ESG insights inform decarbonization, inclusive growth, operational resilience, and regenerative outcomes tied to long-term financial and societal value |
The final step is assigning clear owners and embedding these workflows in the operating system.
4. Design the Operating Model, Team Roles, and Systems
Once controls are in place, the operating model decides whether ESG data stays usable across the portfolio. Data only holds up at scale when ownership, controls, and systems line up with how the portfolio actually runs.
Define roles across investment, ESG, risk, and audit teams
Start with decision ownership, not software.
A simple way to set ESG ownership is across three layers: strategy, operations, and assurance.
Investment teams own ESG integration in deal screening, valuation, and monitoring. ESG specialists build the framework, connect regulatory requirements to voluntary standards, and turn impact goals into a clear metric set. A data manager runs the central repository and oversees validation. Company-level data owners gather raw ESG data, handle first-line quality checks, and document sources before sending data upstream. Risk teams use ESG data in scenario analysis and set thresholds for deeper review. Internal audit tests the data process end to end and checks assurance readiness.
Use a RACI matrix to assign who defines, collects, reviews, and signs off on each metric.
Choose a system design that fits the portfolio
Once ownership is clear, the next step is architecture. The right setup depends on portfolio size, reporting volume, and how much the ESG process needs to connect with current investment systems.
No single architecture fits every portfolio.
System Design | Implementation Complexity | Data Control | Scalability | Integration Needs | Assurance Support |
|---|---|---|---|---|---|
Centralized ESG Module/Repository | Moderate; new software rollout required | High; single source of truth | High for ESG-specific metrics | High; needs connectors to all data sources | Strong; consistent audit trail in one place |
Embedded Workflows in Existing Portfolio/Risk Systems | High; modifies core investment workflows | Very high; financial-grade controls apply | Moderate; limited by existing system flexibility | Low; uses current data infrastructure | Strong; inherits existing financial controls |
Custom ESG Data Warehouse or Lakehouse | Very high; requires internal development | Maximum; fully tailored to portfolio needs | High; grows with the organization | Very high; custom API builds required | Variable; depends on how controls are designed |
Smaller portfolios with straightforward reporting duties often do well with a centralized ESG module. Larger institutions that weave ESG into credit and investment decision workflows often lean toward the embedded approach. Custom data warehouses or lakehouses fit portfolios spread across multiple asset classes, geographies, and data sources when no single tool handles the mix cleanly.
In any model, use open APIs and standardized data structures. That keeps the system easier to connect, govern, and review later.
When to bring in outside support
Outside support helps most when a portfolio is dealing with a major regulatory shift or moving from compliance-only reporting to a fully integrated data model. In those moments, an outside partner should map data flows, define the target architecture, and align reporting requirements.
Council Fire helps translate sustainability strategy into measurable action.
With the operating model set, the next move is to lock in the first actions that make it repeatable.
Conclusion: A Practical Blueprint for Better ESG Portfolio Data
Better ESG data management is not about collecting more. It’s about making the data you already have ready for decisions. The aim is straightforward: make ESG data reliable enough to guide capital allocation, risk review, and reporting. The case for fixing these gaps is strong. 71% of institutional investors say incomplete and inconsistent ESG data is the single biggest barrier to deeper ESG adoption.[3] Portfolios that close these gaps build trust with LPs and portfolio companies over time.
Once the operating model is set, the next step is making it repeatable. That’s where many teams either gain momentum or get stuck in manual work every reporting cycle.
Core actions to prioritize first
The next 6 to 12 months should center on a small set of nonnegotiable moves:
Standardize a core metric set tied to your impact thesis. Material metrics by asset class matter more than trying to cover every possible indicator.
Assign named owners for each metric set. Put responsibility in a RACI matrix so there’s no confusion when reporting deadlines hit.
Use baseline validation and audit trails before expanding the system. These controls catch the errors that chip away at trust without slowing reporting.
Link each disclosure to its source metrics and lock cut-off dates. Set data cut-off dates before each cycle to reduce the last-minute scramble that leads to mistakes.
Design for growth, even at small scale. Build a metric taxonomy that can handle new asset classes and themes without a full rebuild.
Taken together, these five actions create a repeatable ESG data process. That process supports scenario analysis, assurance, and integrated dashboards. The target is a closed loop: collect, govern, test, use, improve.
FAQs
How do I choose the right ESG metrics?
Start with a double materiality assessment to pinpoint the ESG issues that matter most to your sector and the people who have a stake in your business. From there, line up those findings with frameworks like GRI, ISSB, or CDP. That cuts down on duplicate work and makes reporting a lot less messy.
Focus on metrics that teams can actually use - and that can stand up to review. For each metric, spell out the data source, the calculation method, and the person who owns it. That kind of discipline keeps reporting steady and makes year-over-year comparisons far more reliable.
What data quality checks matter most?
The most important ESG data quality checks are the ones that stop bad values before they reach a report and make every number easy to trace back to its source.
That starts with automated validation for range limits, completeness, timeliness, and unit checks. It also means setting up year-over-year variance alerts so unusual shifts stand out right away, along with cross-metric consistency checks to catch figures that don’t line up across related KPIs.
For each material KPI, the process needs to be documented - not just the number itself, but where it came from and how it was collected. A tiered approval workflow helps add control before data moves into reporting. Regular reconciliation back to source systems keeps reported figures aligned with the records they came from. And if someone makes an adjustment, there should be a logged reason for that change, backed by a complete audit trail.
When should ESG data influence investment decisions?
ESG data should shape investment decisions across the entire investment lifecycle. In pre-investment due diligence, it helps flag environmental liabilities, weak governance, and social risks that can drag down deal value.
Once an investment is in the portfolio, regular ESG review gives teams a clearer read on where to adjust, where risk is building, and where performance can improve. It also supports financial resilience and keeps long-term impact goals in view during portfolio management and exit planning.
Related Blog Posts
Latest Articles
©2026

Narrative Change and Power Building: The Missing Half of Advocacy
Narrative change is the process of disrupting dominant narratives that normalize inequity and advancing new narratives from historically marginalized communities.

Funding Resilience Without Federal Grants
BRIC is unreliable and FEMA is shrinking. Here's how cities fund climate resilience with dedicated revenue, blended finance, and a coordinating authority.

The ESG Blind Spot: How AI Is Finding Risks in Companies Nobody Else Is Watching
Norway's sovereign wealth fund uses AI to screen 7,200 portfolio companies for forced labor and corruption within 24 hours. The real story is the emerging-market coverage gap that traditional ESG data vendors miss — and what it means for any company with a global supply chain.
Narrative Change and Power Building: The Missing Half of Advocacy
Narrative change is the process of disrupting dominant narratives that normalize inequity and advancing new narratives from historically marginalized communities.
Funding Resilience Without Federal Grants
BRIC is unreliable and FEMA is shrinking. Here's how cities fund climate resilience with dedicated revenue, blended finance, and a coordinating authority.
The ESG Blind Spot: How AI Is Finding Risks in Companies Nobody Else Is Watching
Norway's sovereign wealth fund uses AI to screen 7,200 portfolio companies for forced labor and corruption within 24 hours. The real story is the emerging-market coverage gap that traditional ESG data vendors miss — and what it means for any company with a global supply chain.
FAQ
01
What does it really mean to “redefine profit”?
02
What makes Council Fire different?
03
Who does Council Fire work with?
04
What does working with Council Fire actually look like?
05
How does Council Fire help organizations turn big goals into action?
06
How does Council Fire define and measure success?
07
How does technology fit into Council Fire’s work?
Sep 8, 2026
ESG Data Management: Portfolio Guide
ESG Strategy
In This Article
Treat ESG data as a year-round portfolio system that powers decisions, not a year-end reporting chore.
ESG Data Management: Portfolio Guide
Bad ESG data slows portfolio decisions. If data is late, incomplete, or inconsistent, teams miss risk signals, struggle with LP reporting, and spend too much time fixing spreadsheets instead of using the numbers.
I’d sum up the article this way: treat ESG data as a year-round portfolio system, not a year-end report task. That means I need to set clear data intake rules, assign owners, apply validation checks, connect data to reporting and investment review, and use systems that fit the portfolio.
A few facts make the case clear:
71% of institutional investors say incomplete and inconsistent ESG data is a major barrier to ESG use.
88% of executives rank data quality among their top three ESG problems.
ESG ratings often disagree: one study found an average correlation of 0.61 across major providers.
If I want a process that works, I need to focus on five things:
Set one core metric set linked to sector risk, fund goals, and impact aims
Map each metric to a source, owner, and due date
Use validation rules and coverage thresholds before numbers reach reports
Link source data to disclosures, dashboards, and committee reviews
Build roles, workflows, and systems that can support growth across the portfolio
In short, the article is a blueprint for turning ESG data from a reporting burden into a decision tool. Collect, govern, test, use, improve.
ESG Data Management: 5-Step Portfolio System
Collecting better ESG data - Challenges and best practices from the industry
1. Set Up ESG Data Intake Across the Portfolio
A solid intake process comes down to three calls: where the data comes from, what you’ll collect, and when it’s due. Skip that structure, and reporting season turns into a cleanup job full of mismatched numbers and version-control headaches. The best place to start is simple: map each source to a metric and an owner.
Map data sources and collection channels
Most portfolios work with four main ESG data source categories: direct company inputs, internal sources, public disclosures, and third-party data and analytics. Private portfolios lean more on company input and internal data. Public portfolios can rely more on filings, sustainability reports, and vendor feeds. In mixed portfolios, it helps to assign one primary source to each indicator.[4][6][1][5]
The collection channel matters just as much as the source. Surveys and standardized questionnaires are often the right fit for early-stage or smaller private companies that are reporting ESG data for the first time.[4] Once you’re dealing with dozens of holdings and repeat reporting cycles, secure web portals make more sense. They support role-based access, validation rules, and audit trails.[5][2] APIs and automated data feeds are a better match for public market portfolios and more advanced managers using integrated ESG data platforms. Pulling regulatory metrics such as Scope 1–3 emissions straight from a provider can cut a lot of manual work.[2][1]
A useful example comes from the ESG Data Convergence Project. GPs collect data annually through their existing systems and submit KPIs through a standard Excel template or a secure file-transfer channel, which gives LPs more comparable data across the portfolio.[9][10][11]
Choose metrics that fit the portfolio strategy
Define a core metric set based on sector materiality, fund goals, and reporting duties.
Start with financially material ESG issues by sector. For heavy industry, that may mean energy use and GHG intensity. For tech, data privacy may sit near the top. For services, labor practices often matter most. Then layer in any required reporting items. For managers subject to SFDR, that includes the 18 mandatory Principal Adverse Impact (PAI) indicators, including greenhouse-gas emissions, fossil fuel exposure, board diversity, and controversial weapons exposure.[7]
From there, add fund-specific impact metrics tied to the theory of change. A climate resilience fund might track avoided emissions and the share of revenue from climate adaptation solutions. A social outcomes fund might track affordable housing units created and jobs for target populations.
The aim is not to collect everything. It’s to build a core set that works across the portfolio, then add a small number of extra metrics by sector or impact theme when they support decisions or LP commitments.
That metric set should drive the collection calendar.
Build a practical collection calendar
Aligning ESG data collection with quarterly U.S. reporting cycles keeps the process easier to run. A common pattern looks like this:
Q1: confirm reporting boundaries and collect full-year energy and GHG data
Q2: collect headcount, gender balance, training hours, turnover, and health and safety incidents
Q3: run verification checks and review holdings for exposure to climate-intensive sectors or controversial activities
Q4: finalize annual metrics, complete PAI indicators at the portfolio level, and secure management sign-off before disclosures go out[5][7]
The table below shows why the intake channel you choose can shape the process long after the first reporting cycle:
Aspect | Manual intake (email + spreadsheets) | Platform-based intake (portal + APIs) |
|---|---|---|
Scalability | Limited; version control breaks down as holdings and metrics grow | High; centralized storage and automated aggregation handle large volumes |
Error risk | High; copy-paste errors, inconsistent templates, and formula mistakes are common | Lower; built-in validation rules and controlled data models reduce human error |
Auditability | Weak; tracking changes across multiple files and email threads is difficult | Strong; role-based access and change logs support regulatory and client assurance |
Staff time | High; teams spend significant time chasing responses and reconciling versions | Lower over time; automated reminders and imports free staff for analysis |
At scale, portal-based intake improves response rates, auditability, and carbon-data coverage.[8]
Once intake is defined, the next step is ownership, validation, and quality control.
2. Build Governance, Controls, and Data Quality Rules
Once intake is set up, governance is what makes ESG data traceable, comparable, and ready for sign-off.
A good intake process can still fall apart if no one owns the data after it comes in. When ownership is fuzzy, definitions drift, numbers stop matching, and the data becomes risky to use in reports or investment decisions.
Assign ownership and define the data model
Governance starts with people, not tools. Each dataset needs named owners, stewards, approvers, and users, with clear authority to ingest, validate, approve, and view data. Second-line risk and compliance teams should set standards and challenge methodologies, while internal audit tests the full data chain from source to output.
Use one shared model for entities, metrics, and time periods across companies, funds, assets, projects, and beneficiaries. That model should cover both financially material ESG data, such as carbon intensity, labor practices, and governance flags, and impact data, such as avoided emissions, affordable units created, and jobs for target populations. Both need the same level of rigor.
Formalize roles with charters, role descriptions, and workflow diagrams. Access should follow least-privilege rules and segregation of duties. In plain English: analysts should be able to view and analyze data, stewards should be able to edit and validate raw inputs, and approvers should be able to lock and publish final values.
Alongside roles, build a data dictionary before the first data call goes out. For each metric, document:
definition
unit
source
formula
retention rule
It also helps to document one sample metric in full so everyone can see what “complete” looks like.
Apply controls that reduce reporting and decision risk
Once ownership and definitions are set, controls keep the data clean through the reporting cycle. That matters because disclosure and investment decisions should rest on numbers that can be compared without guesswork.
Field-level validation rules catch obvious problems early. Negative emissions values can be flagged right away. Diversity percentages can be checked to make sure they sum to 100%. Dates can be tested to confirm they fall inside the reporting period. Cross-metric checks go one step further. If a company reports an 80% drop in emissions while energy use stays flat, the system should flag that record for steward review before it moves ahead.
Completeness thresholds matter too. A common standard is requiring at least 80% to 90% coverage of key ESG metrics across portfolio companies before finalizing portfolio-level figures [17][18]. Missing inputs should move into a remediation queue. A close-style workflow helps here: Draft → Validated → Approved → Published. After that, lock the reporting period.
If a material error shows up after the lock, such as a large asset left out of the emissions inventory, treat it as a documented restatement. Keep both the original value and the corrected value in the system. That kind of paper trail is boring until the day you need it.
Review ESG data risk on a regular basis
ESG data needs its own review rhythm. Quarterly operational reviews can catch completeness failures, validation exceptions, and alerts tied to stale data. Annual strategic reviews should look at methodology choices, vendor risk, and alignment with changing regulations and standards.
The MIT "Aggregate Confusion" study found that the average correlation between ESG ratings from major providers is 0.61, compared with 0.99 between Moody's and S&P credit ratings, and that measurement differences explain roughly 53% to 56% of total ESG rating divergence [15][14][16]. That is a noisy signal. It’s also a clear sign that internal governance and standardization are not optional.
The table below maps common ESG data risks to the controls and evidence used to address them:
ESG Data Risk | Control Techniques | Oversight Actions | Audit Evidence |
|---|---|---|---|
Missing or incomplete inputs | Required fields; completeness thresholds; fallback rules | Quarterly data quality reviews; escalation to data owner | Completeness reports; exception logs; remediation records |
Inconsistent methodologies | Standardized calculation rules; controls for methodology changes | Methodology approval by ESG/risk committees | Approved methodology documents; version histories |
Outdated figures | Scheduled data refresh; date-stamping; alerts for outdated data | Periodic aging analysis; review of longest-outstanding data | Aging reports; refresh logs; time-stamped data extracts |
Undocumented vendor assumptions | Vendor due diligence; documented source hierarchy | Annual vendor reviews; sample back-testing | Vendor evaluation files; methodological summaries |
Bias in impact measures | Diverse indicator sets; stakeholder input; sensitivity tests | Governance review of impact frameworks; challenge sessions | Impact framework documents; review minutes; scenario analyses |
The Dutch Authority for the Financial Markets (AFM) found that many asset managers rely on one or more third-party ESG data providers for most of their ESG needs and have started formalizing responsibilities, including data owner and data steward roles [12][13]. That lines up with what works in practice: pair role clarity with a risk register and regular reviews so problems are fixed before they spill into portfolio decisions or disclosures.
With these controls in place, the same data can support reporting, portfolio monitoring, and investment review.
3. Connect ESG Data to Reporting, Risk Review, and Investment Decisions
Once governance and controls are in place, the next move is simple: make sure ESG data is actually used. Not just stored, not just cleaned up for year-end reports, but built into the reports, risk reviews, and investment calls that shape the portfolio.
Link data to reporting and disclosure workflows
Each core ESG metric - portfolio emissions, diversity figures, engagement activity, impact outputs - needs a clear path from source to final report. That means documenting where the metric starts, who checked it, and which report it ends up in.
For investor-facing reporting, a standard quarterly ESG and impact pack should sit at the center of the process. Usually, that means a PDF plus a dashboard, both pulling from the centralized data platform through scheduled exports or APIs. Version control and audit trails should be built in, not added later as a patch. Board updates should stay focused on the numbers that matter most in oversight discussions: carbon intensity, climate-sensitive exposure, and progress against impact targets.
Foundation and grantor reporting is often a different beast. Many funders ask for custom metric sets tied to specific SDG mappings or program goals. The cleanest way to handle that is with templates that connect metrics to each grantor requirement and generate outputs automatically.
For U.S. and cross-border filings, it helps to avoid the usual scramble by mapping each jurisdiction back to the same underlying dataset. Keep a shared calendar, assign named owners, and maintain a dated change log so everyone can see what changed, when, and why.
Once that reporting path is nailed down, the same dataset should flow straight into portfolio monitoring and committee review.
Use ESG data in portfolio monitoring and risk review
ESG data should live inside the main portfolio monitoring platform, not in a side spreadsheet or a siloed tool that only a few people touch.
ESG integration means using material ESG factors in investment analysis and decisions, so the data has to show up where those decisions happen. Automated alerts can help here. Set triggers for controversy thresholds, score drops, or emissions below target, then route those items to watch lists and documented review.[19] Quarterly trend tracking in emissions intensity, safety, and diversity helps teams tell the difference between holdings that are improving and those moving in the wrong direction.
Exposure reviews should pair ESG metrics with financial data to calculate risk-weighted positions. For example, teams can measure how much of the portfolio sits in companies without credible transition plans, or how much value is tied up in sectors facing high physical climate risk. Those reviews should feed regular portfolio committee meetings, where underperforming assets are flagged for follow-up. That follow-up might mean engagement, position sizing changes, or escalation, and the outcome should be recorded in meeting minutes and task trackers.
ESG data can also shape valuation assumptions in a direct way. A company with major assets in flood-prone regions may call for higher expected capital expenditures for resilience and adjusted margin assumptions in discounted cash flow models. On the other hand, a renewable energy developer with strong community relations may support a lower risk premium.
Those signals matter only if they reach investment discussions early enough to affect position sizing, engagement, or exit decisions.
Move from compliance reporting to portfolio-level insight
Reporting ESG data is not the same as using it.
The real shift happens when ESG insight moves out of the back office and into investment committee discussion. You can see it when a worsening emissions trajectory changes a position size, when failed engagement leads to an exit review, or when strong impact performance supports adding to a position. That’s when the data starts doing real work.
Aspect | Compliance-Only Reporting | Full ESG Integration |
|---|---|---|
Data depth | Minimum required metrics; basic emissions totals; high-level policies | Granular, decision-ready data: intensity metrics, scenario outputs, asset-level risk indicators, detailed impact KPIs |
Decision influence | ESG data rarely changes investment theses; reports produced after decisions | ESG data used pre- and post-trade to adjust valuations, position sizes, engagement strategies, and capital allocation across sectors and themes |
Stakeholder insight | Static snapshots; aggregated and backward-looking | Dynamic, forward-looking analyses showing how ESG factors shape resilience, growth prospects, and progress toward impact goals |
Value creation | Focus on avoiding non-compliance and reputational risk | ESG insights inform decarbonization, inclusive growth, operational resilience, and regenerative outcomes tied to long-term financial and societal value |
The final step is assigning clear owners and embedding these workflows in the operating system.
4. Design the Operating Model, Team Roles, and Systems
Once controls are in place, the operating model decides whether ESG data stays usable across the portfolio. Data only holds up at scale when ownership, controls, and systems line up with how the portfolio actually runs.
Define roles across investment, ESG, risk, and audit teams
Start with decision ownership, not software.
A simple way to set ESG ownership is across three layers: strategy, operations, and assurance.
Investment teams own ESG integration in deal screening, valuation, and monitoring. ESG specialists build the framework, connect regulatory requirements to voluntary standards, and turn impact goals into a clear metric set. A data manager runs the central repository and oversees validation. Company-level data owners gather raw ESG data, handle first-line quality checks, and document sources before sending data upstream. Risk teams use ESG data in scenario analysis and set thresholds for deeper review. Internal audit tests the data process end to end and checks assurance readiness.
Use a RACI matrix to assign who defines, collects, reviews, and signs off on each metric.
Choose a system design that fits the portfolio
Once ownership is clear, the next step is architecture. The right setup depends on portfolio size, reporting volume, and how much the ESG process needs to connect with current investment systems.
No single architecture fits every portfolio.
System Design | Implementation Complexity | Data Control | Scalability | Integration Needs | Assurance Support |
|---|---|---|---|---|---|
Centralized ESG Module/Repository | Moderate; new software rollout required | High; single source of truth | High for ESG-specific metrics | High; needs connectors to all data sources | Strong; consistent audit trail in one place |
Embedded Workflows in Existing Portfolio/Risk Systems | High; modifies core investment workflows | Very high; financial-grade controls apply | Moderate; limited by existing system flexibility | Low; uses current data infrastructure | Strong; inherits existing financial controls |
Custom ESG Data Warehouse or Lakehouse | Very high; requires internal development | Maximum; fully tailored to portfolio needs | High; grows with the organization | Very high; custom API builds required | Variable; depends on how controls are designed |
Smaller portfolios with straightforward reporting duties often do well with a centralized ESG module. Larger institutions that weave ESG into credit and investment decision workflows often lean toward the embedded approach. Custom data warehouses or lakehouses fit portfolios spread across multiple asset classes, geographies, and data sources when no single tool handles the mix cleanly.
In any model, use open APIs and standardized data structures. That keeps the system easier to connect, govern, and review later.
When to bring in outside support
Outside support helps most when a portfolio is dealing with a major regulatory shift or moving from compliance-only reporting to a fully integrated data model. In those moments, an outside partner should map data flows, define the target architecture, and align reporting requirements.
Council Fire helps translate sustainability strategy into measurable action.
With the operating model set, the next move is to lock in the first actions that make it repeatable.
Conclusion: A Practical Blueprint for Better ESG Portfolio Data
Better ESG data management is not about collecting more. It’s about making the data you already have ready for decisions. The aim is straightforward: make ESG data reliable enough to guide capital allocation, risk review, and reporting. The case for fixing these gaps is strong. 71% of institutional investors say incomplete and inconsistent ESG data is the single biggest barrier to deeper ESG adoption.[3] Portfolios that close these gaps build trust with LPs and portfolio companies over time.
Once the operating model is set, the next step is making it repeatable. That’s where many teams either gain momentum or get stuck in manual work every reporting cycle.
Core actions to prioritize first
The next 6 to 12 months should center on a small set of nonnegotiable moves:
Standardize a core metric set tied to your impact thesis. Material metrics by asset class matter more than trying to cover every possible indicator.
Assign named owners for each metric set. Put responsibility in a RACI matrix so there’s no confusion when reporting deadlines hit.
Use baseline validation and audit trails before expanding the system. These controls catch the errors that chip away at trust without slowing reporting.
Link each disclosure to its source metrics and lock cut-off dates. Set data cut-off dates before each cycle to reduce the last-minute scramble that leads to mistakes.
Design for growth, even at small scale. Build a metric taxonomy that can handle new asset classes and themes without a full rebuild.
Taken together, these five actions create a repeatable ESG data process. That process supports scenario analysis, assurance, and integrated dashboards. The target is a closed loop: collect, govern, test, use, improve.
FAQs
How do I choose the right ESG metrics?
Start with a double materiality assessment to pinpoint the ESG issues that matter most to your sector and the people who have a stake in your business. From there, line up those findings with frameworks like GRI, ISSB, or CDP. That cuts down on duplicate work and makes reporting a lot less messy.
Focus on metrics that teams can actually use - and that can stand up to review. For each metric, spell out the data source, the calculation method, and the person who owns it. That kind of discipline keeps reporting steady and makes year-over-year comparisons far more reliable.
What data quality checks matter most?
The most important ESG data quality checks are the ones that stop bad values before they reach a report and make every number easy to trace back to its source.
That starts with automated validation for range limits, completeness, timeliness, and unit checks. It also means setting up year-over-year variance alerts so unusual shifts stand out right away, along with cross-metric consistency checks to catch figures that don’t line up across related KPIs.
For each material KPI, the process needs to be documented - not just the number itself, but where it came from and how it was collected. A tiered approval workflow helps add control before data moves into reporting. Regular reconciliation back to source systems keeps reported figures aligned with the records they came from. And if someone makes an adjustment, there should be a logged reason for that change, backed by a complete audit trail.
When should ESG data influence investment decisions?
ESG data should shape investment decisions across the entire investment lifecycle. In pre-investment due diligence, it helps flag environmental liabilities, weak governance, and social risks that can drag down deal value.
Once an investment is in the portfolio, regular ESG review gives teams a clearer read on where to adjust, where risk is building, and where performance can improve. It also supports financial resilience and keeps long-term impact goals in view during portfolio management and exit planning.
Related Blog Posts
Latest Articles
©2026
Narrative Change and Power Building: The Missing Half of Advocacy
Narrative change is the process of disrupting dominant narratives that normalize inequity and advancing new narratives from historically marginalized communities.
Funding Resilience Without Federal Grants
BRIC is unreliable and FEMA is shrinking. Here's how cities fund climate resilience with dedicated revenue, blended finance, and a coordinating authority.
The ESG Blind Spot: How AI Is Finding Risks in Companies Nobody Else Is Watching
Norway's sovereign wealth fund uses AI to screen 7,200 portfolio companies for forced labor and corruption within 24 hours. The real story is the emerging-market coverage gap that traditional ESG data vendors miss — and what it means for any company with a global supply chain.
FAQ
What does it really mean to “redefine profit”?
What makes Council Fire different?
Who does Council Fire work with?
What does working with Council Fire actually look like?
How does Council Fire help organizations turn big goals into action?
How does Council Fire define and measure success?
How does technology fit into Council Fire’s work?