In This Article
Map flood, heat, and water-filtration services, compare equal-capacity zoning options, and turn results into enforceable standards.
Ecosystem Service Values Inform Zoning Decisions
We can make better zoning decisions by measuring how land protects people from flooding, heat, and water pollution - before changing what can be built. We start by mapping those services, comparing options at equal housing or job capacity, and estimating costs without counting the same savings twice.
We use three steps to turn those findings into zoning rules:
Map: Locate wetlands, trees, and soils, check their condition, and identify who depends on them.
Compare: Measure service changes first, then weigh dollar estimates, housing needs, infrastructure costs, and who gains or loses.
Act: Set density, setbacks, open-space links, and site standards; assign maintenance duties; and review results every three to five years.
Our goal is <u>clear tradeoffs, not a dollar-only verdict</u>. We use these findings to support - not replace - engineering, legal, property-rights, and community review.
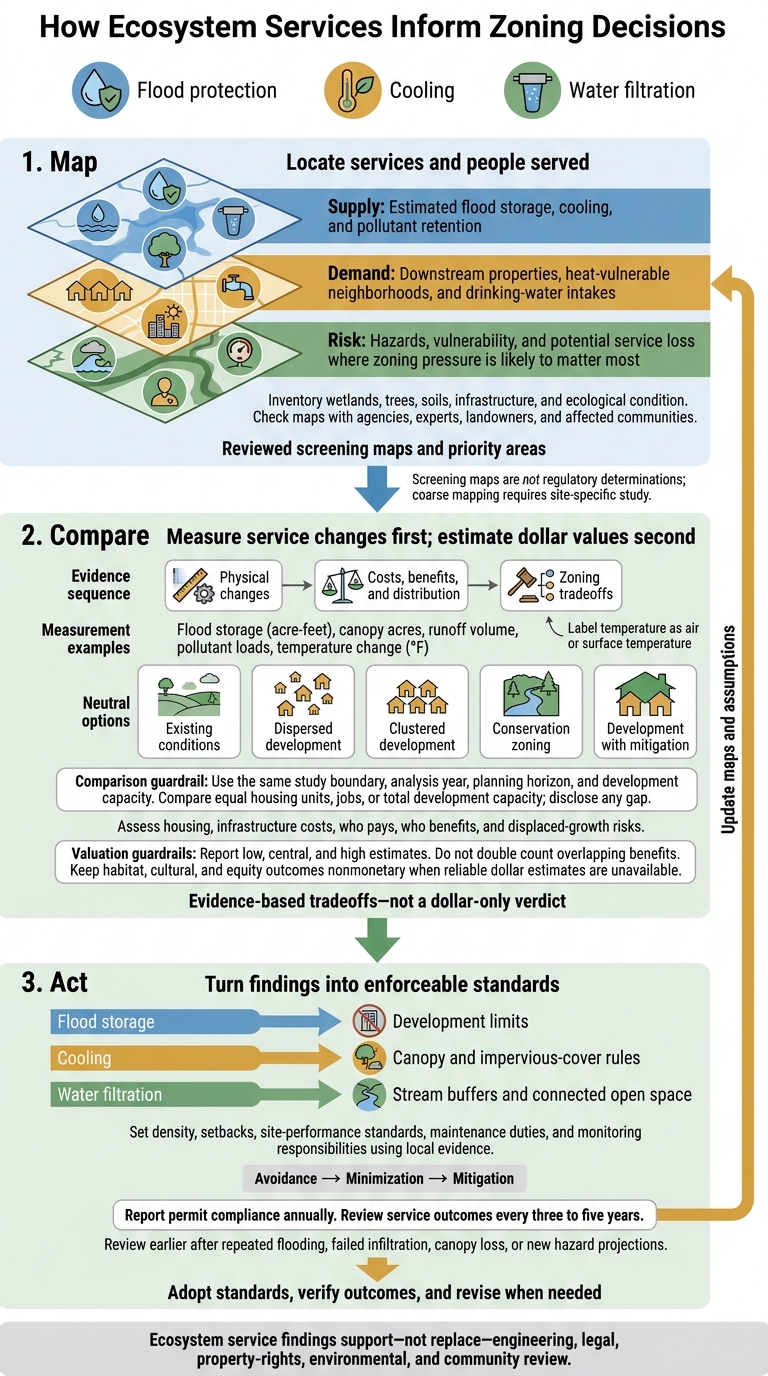
How Ecosystem Services Inform Zoning Decisions
Valuation of Ecosystem Services in response to Land Use/Land Cover Changes
sbb-itb-8baf5f1
Step 1: Map Current Services and Priority Areas
Write a brief mapping protocol before collecting data to support climate resilience. It should explain how the maps will guide density, setbacks, and open-space connections. Draw boundaries around watersheds, drainage basins, or heat islands - not just the rezoning site. Set a baseline year, seasonal conditions, and planning horizons such as 2035 and 2050.
Compare existing zoning, proposed rezoning, conservation design, and a no-action scenario. Give planning staff responsibility for coordination and GIS staff responsibility for maintaining layers. Ask relevant agencies, including applicable tribal or state agencies, to review the areas within their remit.
Inventory Land Features and People Served
Inventory wetlands, floodplains, streams, soils, slopes, canopy, habitat, impervious surfaces, culverts, roads, utilities, public facilities, and drinking-water infrastructure. For each layer, record its source, date, scale, resolution, accuracy, and gaps.
Include ecological conditions, such as compacted soils or blocked drainage. Identify affected residents, landowners, businesses, schools, hospitals, and water-system users. Later zoning tests should account for both ecological function and who faces losses.
Document seasonal changes, cumulative development, planned infrastructure, and assumptions about future rainfall or heat.
Map Service Supply, Demand, and Risk
Maintain three linked layers:
Supply: Estimated flood storage, cooling, and pollutant retention.
Demand: Downstream properties, heat-vulnerable neighborhoods, and drinking-water intakes.
Risk: Hazards, vulnerability, and potential service loss where zoning pressure is likely to matter most.
Overlay parcels, proposed zoning, infrastructure capacity, and demographic indicators.
EPA’s EnviroAtlas links environmental, demographic, health, and equity layers.[2]
Use these layers to sort parcels into standard review, detailed review, or conservation priority areas.
Check Maps Before Using Them
Ask agencies, technical experts, landowners, and affected communities to review draft maps. Use field visits, utility records, and flood reports to check resolution, missing streams, recent construction, ecological condition, and upstream-downstream connections. Publish corrections and a change log before using the maps to set development limits.
Screening maps are not regulatory determinations. USGS cautions that its preliminary 2-year active-floodplain layer should not be used alone to define flood risk or hazard areas.[1]
Before advancing a conservation priority or development limit, test where displaced growth could go. Would another wetland, floodplain, groundwater-recharge area, or already burdened neighborhood face added pressure? Record uncertainty and require site-specific studies wherever mapping is too coarse. A mapped boundary should trigger site-specific study, not an automatic prohibition.
Use the reviewed maps as the screening base for Step 2, where you measure and value zoning options.
Step 2: Measure and Value Zoning Options
Use the reviewed maps to compare existing conditions with zoning alternatives and mitigation options. Measure changes in flood protection, cooling, and water filtration, connect them to land-use changes, and estimate the costs or benefits.
Keep the comparison consistent: use the same study boundary, analysis year, planning horizon, and development capacity. Compare equal housing units, jobs, or total development capacity. If those totals differ, state the gap. Alongside ecosystem services, record housing units, developed acres, impervious surface, infrastructure length, land acquisition needs, and infrastructure costs.
This turns map-based screening into measurable tradeoffs.
Measure Service Changes Before Estimating Dollar Values
Measure wetland acres, flood storage (acre-feet), runoff volume, peak discharge, canopy acres, pollutant loads, habitat connections, and temperature change (°F). Label temperature changes as air temperature or surface temperature, and separate observations from modeled estimates.
Document model versions, resolution, calibration, storm assumptions, and uncertainty. State whether results describe annual averages or a specific storm. Identify who gains or loses flood protection, cooling, or cleaner water - not just where land cover changes.[3]
Estimate Benefits and State Uncertainty
Estimate avoided flood damage, water-treatment costs, cooling-energy costs, and stormwater costs only when the measured service change clearly produces those savings.
Replacement cost is not ecosystem value by default. The substitute must match the service’s quantity, reliability, timing, location, and risk reduction. Its cost must include land, construction, operation, and maintenance.[4] Adjust benefit-transfer estimates for local ecosystems, populations, and the valuation year.[6] Keep habitat, cultural, and equity outcomes nonmonetary when reliable dollar estimates are unavailable.
Do not add overlapping benefits, such as flood-damage savings and replacement infrastructure that serves the same purpose. Report low, central, and high estimates, along with assumptions and discount rates.[5] Identify who pays and who benefits. Separate annual benefits from discounted present values, and label the analysis period and dollar year.
Compare Zoning Options in a Table
The options below are comparison categories, not predicted outcomes. Before ranking them, enter local quantities and costs, and disclose differences in housing, land acquisition, infrastructure, and mitigation. Clustering or lower intensity should rank higher only when evidence shows greater net public value - not because either design is presumed better.
Use the same baseline assumptions for every option so readers can assess each on the same terms.
| Zoning option | Affected ecosystem services | Biophysical change | Net economic effect | Beneficiaries | Key risks | Decision implication |
|---|---|---|---|---|---|---|
| Existing conditions | Flood storage, cooling, filtration, habitat | Baseline wetland acreage, storage, canopy, runoff, pollutant loads, and connectivity | Reference case; no incremental benefit or cost | Current residents, ecosystems, utilities | Data gaps; changing climate | Use as the common benchmark |
| Dispersed development | Flood storage, cooling, filtration, habitat | More impervious area; less storage and canopy; fragmented habitat | Higher stormwater, flood, and infrastructure costs; estimate locally | Landowners and new occupants; costs may shift to taxpayers and downstream residents | Flood exposure; infrastructure expansion; service loss; inequitable impacts | Limit or redesign where public costs exceed private gains |
| Clustered development | Flood storage, cooling, filtration, habitat | Development on lower-risk land; more contiguous open space | Test road and utility savings and retained service value against land and infrastructure costs | Residents, developers, utilities, downstream communities | Localized heat; congestion; housing-price effects; limited open-space access | Consider at equal development capacity without shifting harms |
| Conservation zoning | Flood storage, cooling, filtration, habitat | Maximum retention and connectivity; little new impervious surface | Avoided damages and infrastructure costs; nonmarket benefits; foregone development revenue or land value | Public, downstream residents, wildlife, future residents | Housing-supply effects; landowner impacts; maintenance needs | Apply where high-risk or high-service areas provide unusually high public value |
| Development with mitigation | Flood storage, cooling, filtration, habitat | Partial service retention through setbacks, green infrastructure, canopy, or restoration | Compliance and maintenance costs; reduced but remaining damages | Developers, residents, utilities, downstream users | Failure; maintenance; poor siting; double counting | Set measurable standards, monitoring, maintenance, and enforcement requirements |
Use the strongest option to set zoning standards in Step 3.
Step 3: Turn Findings Into Zoning Standards
Turn measured gains and losses in flood protection, cooling, and water filtration into enforceable zoning rules. Before adoption, send the draft through planning, engineering, legal, and community review. Check state zoning authority, consistency with the comprehensive plan, notice-and-hearing rules, applicable federal and state environmental requirements, and property-rights protections. Counsel should verify nexus and proportionality - a fee option does not bypass those limits.[10][13]
Set Development Limits and Connect Open Space
Draw district boundaries using mapped flood-protection, cooling, and filtration areas. Use locally supported conservation or overlay districts to protect wetlands, floodplains, recharge areas, stream corridors, and steep slopes. Base boundaries, allowed uses, development limits, and buffer widths on local hydrology, soils, slopes, and risk, rather than a universal setback.
Direct density toward lower-risk areas already served by infrastructure. Allow clustering only where it preserves open space and infrastructure can support it. Protect connected open space with recorded easements or deed restrictions that identify the owner, funding, and maintenance duties.[7][8][9]
Define Site Performance and Mitigation Rules
Tie setbacks, impervious-cover limits, tree-retention rules, and stormwater controls to measurable outcomes: retained flood storage, canopy, runoff, or pollutant loads. Spell out the baseline, calculation method, inspection milestones, and documentation of built conditions.
Require avoidance, then minimization, before mitigation. Do not treat mature-tree cooling or some wetland functions as fully replaceable. Name the party responsible for maintenance, record continuing obligations, and set correction deadlines. Establish financial guarantees or penalties where legally authorized.[11][12][14][15]
Track Results and Update Standards
After adoption, assign departments and funding for baseline monitoring before permitting begins. Report permit compliance annually and review service outcomes every three to five years. Measure storage retained, canopy survival, runoff, and pollutant loads to verify that zoning protects the identified services - not just that plans received approval.
Trigger an earlier review after repeated flooding, failed infiltration, canopy loss, or new hazard projections. Before revising standards, determine whether failures stem from design, maintenance, enforcement, or changed conditions. Put proposed revisions through technical, legal, and public review.
Help residents, landowners, and small businesses comply with plain-language maps, parcel-level examples, office hours, design templates, and clear appeal procedures. Explain maintenance costs and available assistance before adoption.
Conclusion: Use Ecosystem Service Findings to Guide Zoning
Make flood protection, cooling, and water filtration part of zoning decisions. Start with a baseline of land cover, flood exposure, heat, water quality, and who benefits. Then map service supply, demand, and vulnerability. Compare zoning options by physical changes first and dollar values second. Adopt standards and track results against the baseline to see which services zoning protects or degrades.
Flood-storage findings can support development limits. Heat findings can guide canopy and impervious-cover rules, while filtration findings can inform stream buffers and open-space connections. Each points to functions that zoning can preserve, weaken, or reconnect.
These service changes make the tradeoffs clear: what does each option preserve, and what does it degrade? This assessment informs - but does not replace - engineering, legal, property-rights, environmental, and community review.
For an upcoming rezoning, bring planning, engineering, legal, environmental, public-health, and community representatives together before comparing alternatives and drafting the rezoning package. Use the tradeoffs to focus their review. Finish with a written scope that defines the assessment boundary, baseline data, priority populations, scenarios, and decision criteria. Assign responsibilities, name a monitoring lead, and set a public review schedule.
FAQs
How can small towns assess ecosystem services on a limited budget?
Small towns can assess ecosystem services without a large budget by using existing data and benefit transfer - applying findings from similar places. ESVD and USGS mapping resources can help map these services, while participatory mapping and focus groups bring local knowledge into the assessment.
Put those findings to work in hazard mitigation plans or capital improvement budgets. Measures such as water absorption rates and forest cover can guide zoning decisions without putting a dollar value on each service.
How can zoning protect natural areas without worsening housing shortages?
Zoning can steer development toward safer, higher-density areas. Flood, heat, and habitat maps help municipalities protect high-risk floodplains and key ecological corridors. Applying the No Adverse Impact principle helps ensure new projects don’t increase regional flood risks.
Involving residents in mapping helps identify ecosystem services communities depend on, so development limits reflect data rather than arbitrary restrictions.
What if ecosystem service maps misrepresent my property?
Ecosystem service maps inform land-use decisions - they don’t dictate them or guarantee protection. Data gaps and assumptions may miss what sets your property apart.
Take part in the planning process to check the findings. Review draft interpretations, flag errors, and share firsthand knowledge of your land so it appears in the final planning documents. Practitioners record corrections in decision logs.


FAQ