Sep 27, 2026 · 20 min read
Sustainability Strategy
In This Article
Counting park acreage isn't enough — cities must set targets, map connectivity, and measure outcomes to fix flooding, heat, habitat, and access.
On this page
- Building resilient cities by restoring connectivity in urban ecosystems | Andrew Gonzalez
- Stage 1: Define Connectivity Goals and Benefit Targets
- Stage 2: Build the Citywide Connectivity Baseline
- Stage 3: Evaluate Connectivity Performance by Benefit Type
- Stage 4: Prioritize Projects and Test Scenarios
- Stage 5: Set Monitoring Rules and Long-Term Governance
- FAQs
Connectivity Benefits Framework for Cities
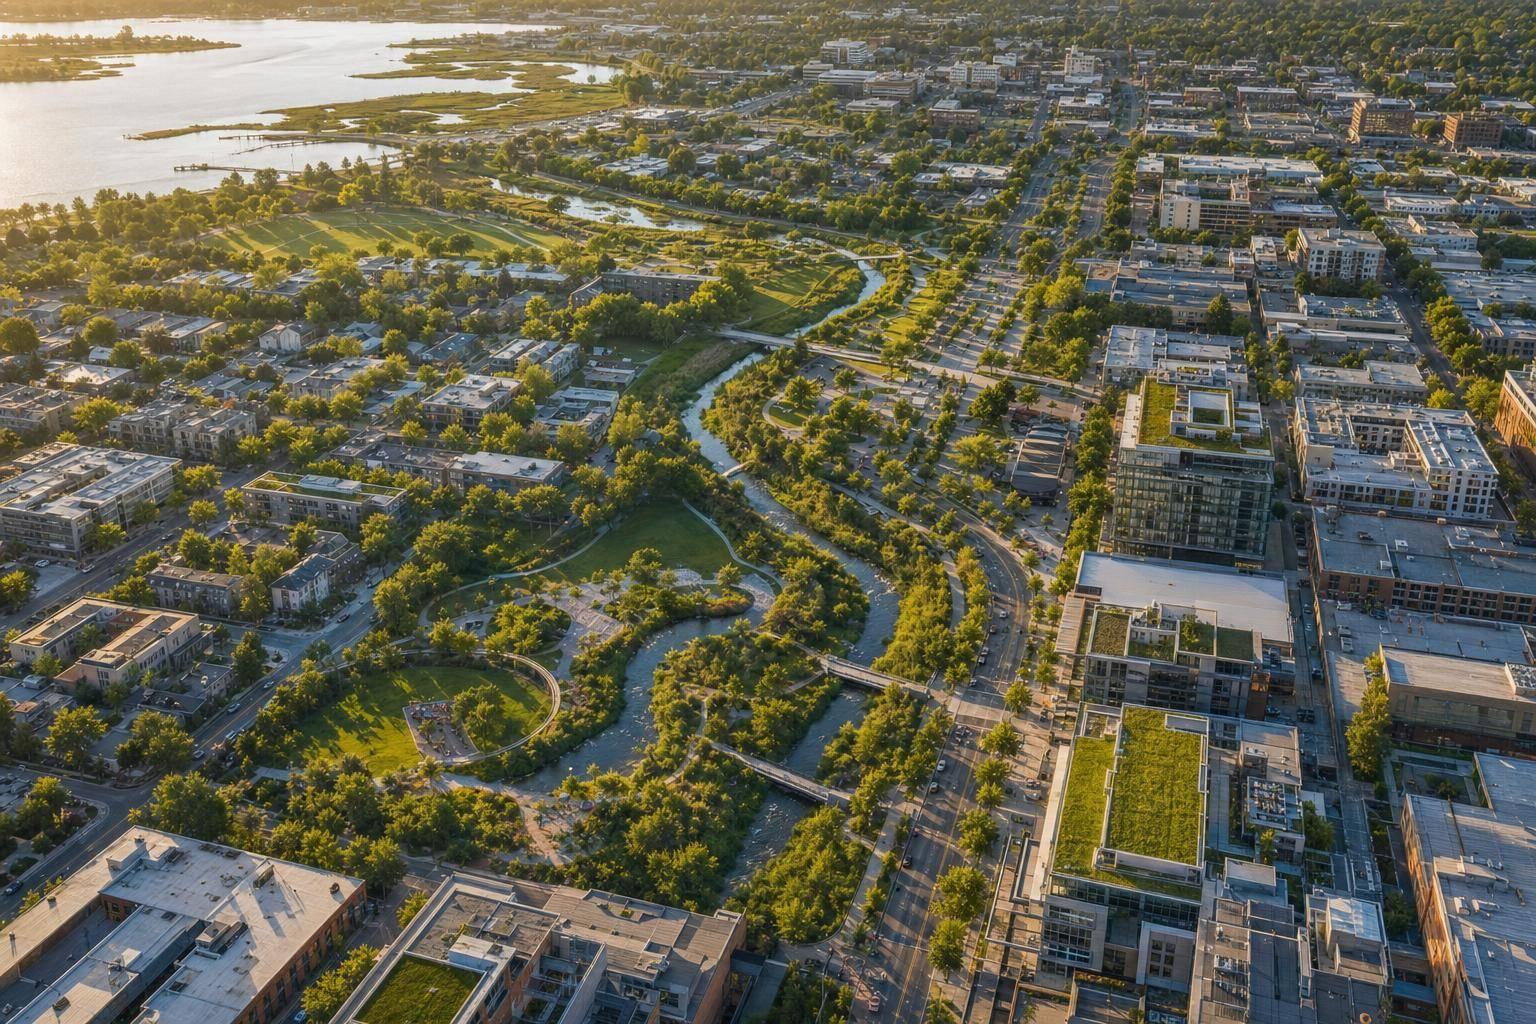
A city can have lots of open space and still fail on flooding, heat, habitat, and access. I see the article’s main point as simple: counting acres is not enough. A city needs to test whether parks, wetlands, trees, waterways, and greenways work together as one network - and whether that network produces clear results people can track.
Here’s the short version:
I would set clear targets first, not vague goals like “add more green space.”
I would build one citywide baseline for habitat, flood risk, heat, access, and equity.
I would track four kinds of connectivity: physical layout, actual movement, results delivered, and agency coordination.
I would measure outcomes, not just construction totals. Planting 10,000 trees is not the same as lowering heat on school routes.
I would rank projects by what they fix in the network, then test what happens if a key project is delayed or removed.
I would assign one owner per metric, with update schedules and response rules when results fall short.
A few facts from the article make the case fast: neighborhoods with mostly people of color have 44% less park acreage than mostly White neighborhoods on average, places within a 10-minute walk of a park can be up to 6°F cooler, and one cited model found 30% canopy cut annual runoff by 17% under stated assumptions.
If I were using this framework, I’d treat it as a five-step management system: set targets, map current conditions, test performance, rank investments, and monitor results over time. That shift turns open space from a static map into something a city can track, fund, and fix.
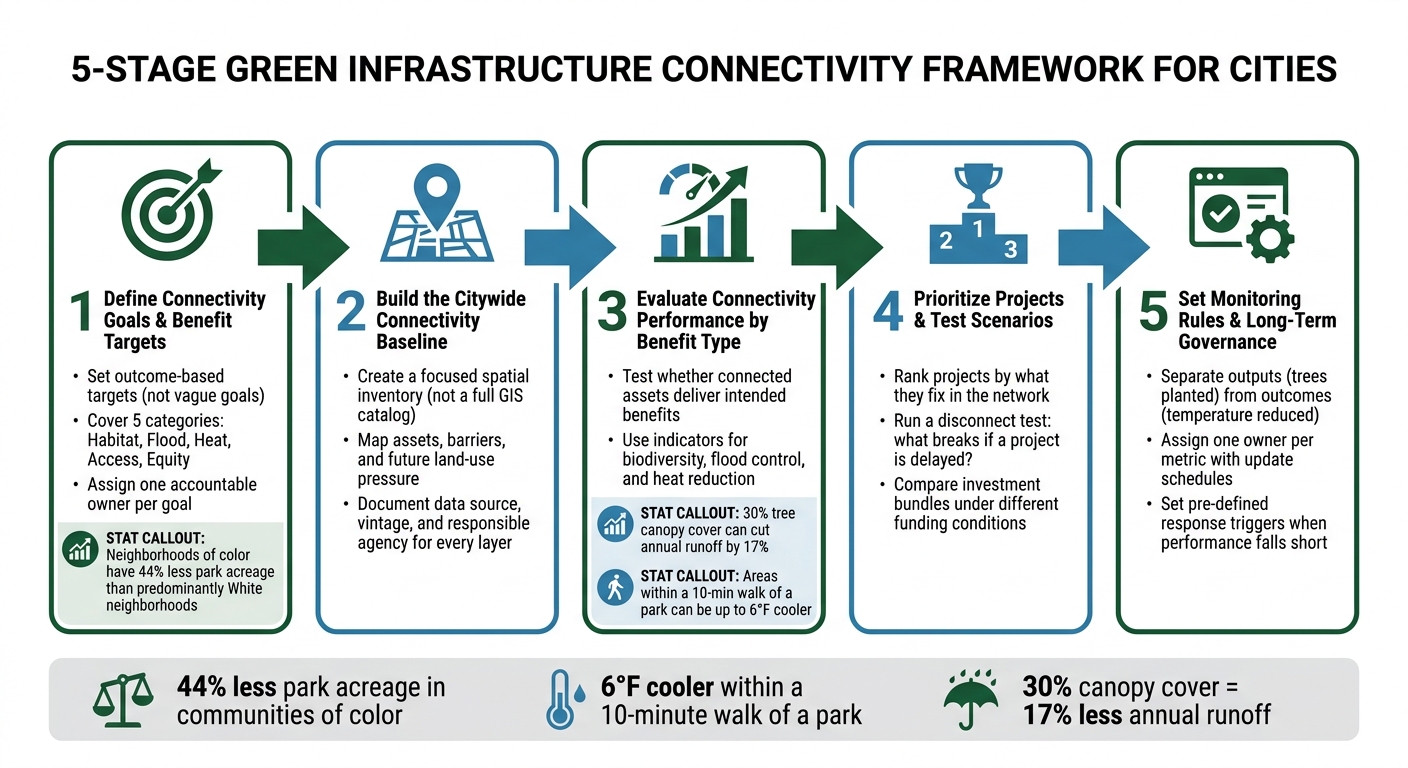
5-Stage Green Infrastructure Connectivity Framework for Cities
Building resilient cities by restoring connectivity in urban ecosystems | Andrew Gonzalez
sbb-itb-8baf5f1
Stage 1: Define Connectivity Goals and Benefit Targets
Before a city picks projects or tracks metrics, it needs to be clear about the result it wants. The goal has to describe an outcome, not just an action. So instead of saying “add more green space,” a city should say something like: “By 2035, connect priority riparian habitat, preserve flood storage in the 100-year floodplain, expand shade on school routes, and increase access to usable open space in the highest-heat census tracts.” That level of detail makes the goal testable. It also makes it much easier to hold agencies accountable. Once the goals are clear, the city can set a baseline and measure where things stand today.
Set outcome categories for habitat, flooding, heat, access, and equity
Each goal should fit within one of five outcome categories.
Habitat goals focus on whether animals and ecological processes can move between patches, including corridors, riparian buffers, wetlands, and stepping stones.
Flood management goals define how much connected storage, infiltration, or conveyance capacity the network needs, especially upstream of neighborhoods that flood again and again.
Heat reduction goals focus on connected tree canopy, parks, and shaded routes in places with high heat exposure. Areas within a 10-minute walk of a park can be up to 6°F cooler than areas outside that range.[2][3]
Access goals treat parks, schoolyards, utility easements, rights-of-way, and vacant lots as one working system and spell out who can reach that system safely and comfortably.
Equity goals focus on how these benefits are shared across communities.
Equity needs extra care here. Nationally, neighborhoods where residents predominantly identify as people of color have access to an average of 44% less park acreage than predominantly White neighborhoods.[3] A city can’t fix that gap by pointing to a better citywide average. It has to set minimum protections for underserved areas, alongside citywide targets. Every target should also include safeguards against displacement, loss of access, and unfair maintenance burdens.
A simple way to write each goal is: “By [year], [place or population] will achieve [measurable benefit], measured by [indicator], while avoiding [tradeoff].” Each target should also name a minimum threshold and a priority geography.
Targets come first. Roles come next.
Assign governance roles across public and private actors
A connectivity network usually cuts across many jurisdictions and ownership types, so governance needs to be set before projects start, not after conflict shows up. Responsibilities should be assigned by decision, asset, and performance duty. That matters because each part of the network depends on who controls it: planning sets land-use protections, parks manages open space, transportation handles crossings and rights-of-way, public works manages culverts and sidewalks, stormwater utilities lead flood performance, and forestry or sustainability offices set canopy and cooling targets.
Private owners also extend the network through easements, habitat protection, stormwater maintenance, and access agreements that are documented in writing. Private land should count only when legal protection, access, and maintenance duties are clearly documented.
A short governance charter, approved before detailed mapping begins, should name the lead agency and supporting partners for each outcome category, set data-sharing rules, define how tradeoffs are resolved, and establish community-engagement requirements. Each goal needs one accountable owner, a funding source, a delivery timeline, and a clear escalation path when agency priorities clash. Council Fire can help cities turn a cross-sector sustainability strategy into measurable actions, coordinated governance, and delivery pathways.
With ownership and accountability in place, the next step is mapping assets, barriers, and pressure points across the city.
Stage 2: Build the Citywide Connectivity Baseline
Start with a clear picture of where connectivity works and where it breaks down. This baseline should be a focused spatial inventory of habitat, flood control, heat reduction, access, and equity. It is not a full GIS catalog. Keep it tight and organized around five groups: ecological assets, hydrologic function, barriers and pressures, exposure and equity, and delivery context.
Each layer should tie back to one of the five outcome categories set in Stage 1. Set a baseline date, then document the imagery year, data vintage, spatial resolution, and reference system for every layer. That may sound tedious, but it saves a lot of pain later when datasets change or someone needs to reproduce the work.
Map assets, barriers, and future land-use pressure
Map barriers by what they do, not only by what they are. For each barrier, build an inventory that records its location, type, width, ownership, maintenance responsibility, and effect on habitat movement, flood flow, cooling, or access.
One barrier can cause several problems at the same time. A multilane road, for example, may block wildlife movement, cut off pedestrian access, and restrict flood flow. A channelized waterway may move stormwater well while cutting riparian habitat apart on both banks. That’s why function matters more than a simple label.
Priority barriers should be checked against field visits, maintenance records, crash data, flood complaints, and community observations. On paper, a corridor may look open. On the ground, it may be a dead end.
For future pressure, include zoning designations, approved and pending developments, building permits, capital-improvement plans, transportation projects, and publicly owned surplus land. Give each pressure area a time horizon and expected change in impervious cover or canopy, along with its likely effect on habitat, drainage, heat, and public access.
This step helps flag parcels where near-term decisions could either close gaps or open corridors. Verify planned projects directly with the planning department. In practice, adopted plans, entitlement records, and construction schedules often drift apart more than teams expect.
Build a focused data inventory table
The table below includes only the datasets needed to establish baseline condition, function, feasibility, and equity - not every GIS layer. Each dataset should have a responsible agency and a set update schedule. A baseline only works when every layer has a clear owner and a refresh cycle.
| Objective | Dataset | Spatial Scale | Responsible Agency | Update Frequency | Limitation |
|---|---|---|---|---|---|
| Map habitat cores and land cover | Local land-cover map; NLCD land cover [7][8] | Citywide; 30-meter regional reference, higher-resolution local data where available | GIS or planning department; USGS for NLCD | Annual to multi-year | Classification may not reflect habitat quality |
| Measure tree connectivity and canopy | Tree-canopy inventory; EPA EnviroAtlas connectivity products [10] | Parcel, neighborhood, or community scale | Parks, urban forestry, or GIS department; EPA for EnviroAtlas | Annual to multi-year | Coverage, species, and maturity data may be incomplete |
| Identify wetlands and waterways | National Wetlands Inventory; local wetland delineations; NHDPlus High Resolution [9][11] | Watershed, parcel, and site scale | State environmental agency, local watershed authority, or planning department | Multi-year; update after delineation | National layers may be too coarse for permitting or design |
| Evaluate flood exposure | FEMA National Flood Hazard Layer; local flood studies; observed flood points [6] | Parcel, drainage basin, and community scale | FEMA, local floodplain administrator, public works | As studies and maps are revised | Effective maps may omit localized drainage or future conditions |
| Assess soils and infiltration | SSURGO soil data; local geotechnical or infiltration tests | Parcel and subcatchment scale | USDA NRCS; public works or project sponsors | Periodic; site-specific testing as needed | Soil maps are not substitutes for design-level testing |
| Map drainage function | Storm drains, culverts, outfalls, channels, detention, levees, and pump stations | Asset and drainage-basin scale | Public works, utilities, watershed authority | Quarterly to annual asset updates | Private and undocumented assets may be missing |
| Measure impervious cover and heat | NLCD imperviousness; local impervious-surface mapping; land-surface temperature [7][8] | 30-meter regional scale; finer local analysis | GIS, sustainability, or public-health department | Annual to multi-year; seasonal heat updates | Surface temperature is not the same as air temperature |
| Screen equity and vulnerability | Census/ACS indicators; CDC/ATSDR SVI; FEMA NRI social-vulnerability data [4][5] | Block group, tract, or county | Planning, public health, or emergency management | Annual or release-based | Aggregation can conceal household-level differences |
| Identify ownership and access constraints | Parcel ownership, easements, rights-of-way, conservation restrictions, public-access records | Parcel and asset scale | Assessor, planning, parks, utilities, and legal departments | Monthly to annual | Ownership and access records can be incomplete or outdated |
| Map future land-use pressure | Zoning, comprehensive-plan designations, permits, approved projects, capital plans | Parcel, corridor, and district scale | Planning, transportation, and development agencies | Monthly to annual | Plans and approvals do not guarantee construction |
Use NLCD for regional screening and multi-year change detection. Use 1-meter local data for narrow corridors, street trees, and small wetlands. Stage 3 builds on this baseline to test how connectivity performs in the field.
Stage 3: Evaluate Connectivity Performance by Benefit Type
With the Stage 2 baseline in place, Stage 3 asks a simple question: are connected assets delivering the benefits the city wanted in the first place? This is where Stage 1 targets become working indicators that test actual performance. Size alone doesn’t decide success. A smaller project that fixes a key break in the network can do more good than a bigger site that sits on its own.
Select biodiversity, flood, and heat indicators that reflect real function
For biodiversity, focus on habitat amount and how well that habitat works as a network. Patch area and condition matter, but so do corridor width, continuity, and how easy it is for species to move through barriers. Two useful metrics are effective mesh size, which estimates landscape fragmentation, and the probability that two locations stay connected instead of being split by barriers.[13] That distinction matters. A corridor can look whole on a map and still fail in practice because of one blocked culvert or a road crossing animals can’t safely use. That’s why structural measures should be checked against actual movement pathways.
For flood control, the key test is whether connected green infrastructure can store, slow, and soak in stormwater. Core measures include connected floodplain and wetland area, runoff volume, storage capacity, and infiltration rate. Report results against a defined design storm, such as a 1-inch or 2-inch event, and spell out the assumptions behind the numbers, including soil type, impervious cover, and maintenance condition. A 2025 model found that 30% canopy reduced annual runoff by 17% under its assumptions.[15] The phrase under its assumptions matters here. Numbers without context can mislead.
For heat, use both physical cooling measures and human-exposure data. Canopy continuity and shade coverage along sidewalks, transit routes, school routes, and other priority corridors are useful stand-ins for on-the-ground cooling. Land-surface temperature (LST) from satellite imagery helps compare areas across a city, but it tracks surface temperature, not the air temperature people feel.[12] Field sensors along main walking routes give stronger proof of day-to-day benefit. The International Finance Corporation reports that a 10% increase in tree-canopy cover can reduce maximum midday air temperature by roughly 1°C, or about 1.8°F.[14]
Heat data also needs to be broken out with care. Citywide averages can flatten the picture and hide the places carrying the highest burden. Report heat exposure by neighborhood, income, race and ethnicity, age, disability status, housing condition, and access to cooling resources. Then break those results out by neighborhood and demographic group so the hottest gaps don’t disappear inside a single city average.
Compare project types in a benefit-by-project table
Not all project types do the same job in a connected network. A green roof may do little for citywide habitat links but still help with local stormwater and heat. A restored waterway may deliver major connectivity gains, yet take years of permitting and steady upkeep. Looking at each project type on its own terms keeps those tradeoffs in view instead of hiding them inside one rolled-up score.
| Project Type | Connectivity Function | Biodiversity Contribution | Flood Function | Heat Benefit | Principal Constraints | Performance Measures |
|---|---|---|---|---|---|---|
| Parks | Large habitat nodes and stepping stones | Habitat area, native vegetation, patch quality | Storage, infiltration, floodplain protection | Canopy, shade, evaporative cooling | Competing uses, land cost, fragmentation; public access and maintenance obligations | Habitat acres, patch quality, storage volume, canopy cover, users served |
| Street trees | Linear canopy and movement links | Pollinator resources, bird movement, urban habitat | Rainfall interception, infiltration, reduced runoff | Sidewalk and transit-stop shade | Soil volume, tree mortality, utility conflicts; utility coordination required for public right-of-way | Canopy continuity, tree survival, shade percentage, runoff reduction |
| Greenways | Continuous habitat, walking, biking, and water links | Corridor continuity and species movement | Riparian storage, conveyance, infiltration | Continuous route shade | Land acquisition, road crossings, flood damage risk; cross-jurisdiction easement management | Corridor gaps closed, crossing permeability, users, flood storage |
| Wetlands | Habitat and hydrologic connectors | Wetland acreage, condition, species richness | Detention, filtration, flood attenuation | Cooling through vegetation and open water | Drainage alteration, invasive species, water quality; protection status may limit adjacent development | Connected wetland acres, storage volume, infiltration, water quality indicators |
| Restored waterways | Reconnected aquatic and riparian corridors | Fish passage, riparian habitat, channel complexity | Floodplain reconnection and flow attenuation | Riparian shade and cooler water temperatures | Contaminants, erosion, infrastructure conflicts; public access must be balanced with safety needs | Restored channel length, fish passage, flood-stage reduction, canopy |
| Green roofs | Distributed stepping stones | Native plant and pollinator resources | Stormwater retention and delayed release | Roof-temperature reduction and building cooling | Structural load limits, irrigation, maintenance costs; usually private or institutional land | Retention volume, plant survival, roof temperature, habitat use |
| Vacant lots | Small nodes that close local network gaps | Native planting and pollinator habitat | Infiltration and temporary storage | Local shade and surface cooling | Redevelopment pressure, soil contamination; ownership, interim use, and liability exposure | Gap closure, planted area, runoff reduction, LST change, land tenure |
| Schoolyards | Neighborhood nodes | Native gardens, trees, and educational habitat | Permeable surfaces and rain gardens | Student shade and cooling at arrival areas | Safety, scheduling, maintenance, competing recreation uses; public or institutional access and programming | Shade at arrival areas, canopy, infiltration, student access, biodiversity |
| Utility corridors | Long linear links across developed areas | Habitat continuity where compatible with operations | Limited infiltration or drainage improvements | Canopy or low vegetation cooling where safe | Vegetation-height limits, herbicide use, restricted access; easements and operator control over access | Corridor continuity, native cover, barrier crossings, runoff, maintenance compliance |
Stage 4 uses these indicators to rank projects and compare investment scenarios.
Stage 4: Prioritize Projects and Test Scenarios
With the Stage 3 indicators set, the next step is to rank projects, test project bundles, and decide what gets funded first.
Rank projects without hiding tradeoffs
Don’t flatten everything into one number. Show both views: each project’s indicator results and its weighted score. That way, decision-makers can see what they’re gaining, what they’re giving up, and where the hard calls sit.
Before any scoring starts, remove projects that don’t pass basic feasibility checks. If a project runs into ownership issues, permitting barriers, hydrology problems, or weak long-term maintenance prospects, it shouldn’t stay on the list. That simple filter keeps the ranking grounded in what can actually get built.
Then run a disconnect test. Ask a plain question: if this project is removed or delayed, what breaks? A delay that cuts off a habitat corridor, wipes out flood storage, or weakens nearby investments should trigger a flag even if the project doesn’t land near the top of the weighted ranking.
Weights matter, and they shouldn’t come from one department working alone. Set them through agency and community review. EPA points to flood mitigation, heat reduction, biodiversity, habitat restoration, and equitable outcomes as shared green-infrastructure goals.[1]
Those rankings then feed the scenario table below.
Use a scenario comparison table for investment decisions
Once single projects are ranked, test the strongest options as portfolios. A strong project on its own may look different when paired with other investments, budget limits, or land-use constraints. That’s why it helps to compare bundles under different funding and development conditions.
| Baseline Condition | Intervention | Connectivity Function | Biodiversity Outcome | Flood Outcome | Heat Outcome | Land-Use Implications | Key Dependencies | Uncertainty | Indicative Cost (USD) |
|---|---|---|---|---|---|---|---|---|---|
| Fragmented riparian corridor; high runoff | Floodplain reconnection and levee setback | Hydrologic and migratory connectivity | High: native fish passage and riparian bird habitat restored | High: natural peak-flow attenuation and floodplain storage | Low: localized riparian cooling | Restores historical floodway; limits adjacent development | Landowner easements; permitting | Medium: sediment dynamics and channel response | Planning estimate |
| Urban heat island; limited canopy in heat-vulnerable neighborhoods | Targeted street tree and bioswale program near heat-vulnerable facilities | Canopy and pollinator corridor | Medium: urban habitat and movement corridors | Low: modest infiltration improvement | High: local cooling from added shade and evapotranspiration | Increases pervious surface in right-of-way | Utility coordination; establishment maintenance | Low: well-established performance | Planning estimate |
| High impervious cover; frequent flash flooding | Rain gardens and permeable pavement in redevelopment zones | Stormwater infiltration connectivity | Low: localized habitat patches | High: runoff reduction | Medium: evapotranspirative cooling | Retrofits existing right-of-way; compatible with redevelopment | Soil suitability testing; utility conflicts | Low: proven technology | Planning estimate |
| Threatened habitat corridor under near-term development pressure | Parcel acquisition or conservation easement | Terrestrial and access connectivity | High: corridor continuity preserved before fragmentation | Low to medium: depends on site hydrology | Low to medium: canopy retention | Removes parcels from development | Willing seller; funding eligibility; title review | Low if acquired early; high if delayed | Planning estimate |
| Degraded wetland; limited hydrologic connection | Wetland restoration or expansion | Hydrologic and habitat connectivity | High: improved wetland function and habitat | High: detention and flood attenuation | Medium: cooling from water and vegetation | May constrain nearby grading or drainage | Water-quality permitting; invasive-species management | Medium: hydrology and vegetation establishment | Planning estimate |
Cost ranges should include design, land acquisition, construction, permitting, and basic vegetation establishment. At this stage, those figures are planning estimates, not bid prices.
Before a final budget decision, add lifecycle operations and maintenance costs. That includes vegetation replacement, sediment removal, inspection, and invasive-species control. A project can look affordable on paper and still become expensive to keep up over time.
This is where the table earns its keep. A greenway, for example, may improve habitat and public access while also needing easements, shrinking developable land, or adding long-term irrigation duties. Showing both the upside and the drag makes the comparison far more useful than a simple score.
Where Council Fire can support implementation
Use the scenario results to set the delivery sequence. Council Fire can help cities move from ranking to delivery by working with governments, foundations, NGOs, infrastructure owners, and private stakeholders on stakeholder alignment, benefit analysis, and delivery sequencing across agencies and capital programs.
Stage 5: Set Monitoring Rules and Long-Term Governance
Stage 4 decided what gets funded. Stage 5 checks whether those projects do what they were supposed to do once they’re in the ground. After ranking projects, this stage sets the baseline, reporting rules, and the triggers for action when results slip.
Separate outputs from outcomes in performance reporting
Construction alone is not proof that a project works. Outputs show what was built or installed: acres restored, trees planted, corridor miles completed. Outcomes show whether conditions changed in the way the city wanted.
"10,000 trees planted" is an output. "A measurable reduction in afternoon land-surface temperature in a priority heat-vulnerability area" is an outcome. EPA guidance draws the same line, separating implementation metrics such as the number and area of green infrastructure facilities from effectiveness metrics such as runoff-flow reductions and receiving-water response.[16]
The table below shows where each metric fits across the five benefit categories in this framework:
| Benefit Category | Delivery | Performance |
|---|---|---|
| Habitat | Acres restored; corridor miles completed; parcels protected | Wildlife movement suitability; corridor continuity; road-barrier permeability |
| Flood Control | Stormwater assets built; wetland acres restored; culverts retrofitted | Runoff volume retained; peak-flow reduction; combined-sewer overflow volume |
| Heat Reduction | Trees planted; shaded public spaces improved | Surface or air temperature reduction (°F); heat-exposure hours; access to cooling spaces |
| Access | Miles of greenway; public-space improvements | Residents within a defined walking distance or travel time of a shaded, cooled, or water-accessible public space |
| Equity | Investment ($) in high-vulnerability neighborhoods | More equitable distribution of investments by neighborhood; reduced displacement or maintenance burdens |
Assign one owner to each metric row. If no one clearly owns a metric, missing data usually follows.
Build an indicator specification table and wrap up
Use one citywide baseline year for trend reporting. Only use project-level baselines when construction years differ. Report each result in two ways: the absolute value and the change from baseline. For example, "peak runoff reduced by 18% compared with the 2026 pre-project model" and "12 acres of connected habitat added since the 2026 citywide baseline." If methods change later, keep the original baseline in place and document the update instead of quietly swapping out past values.
Update schedules should match how fast the data changes. Asset inventories and maintenance records can be updated quarterly. Habitat connectivity models should be checked each year and recalibrated after major land-use, transportation, flood, wildfire, or development changes. Climate assumptions, including precipitation intensity and extreme-heat thresholds, should be reviewed every three to five years, or sooner if official projections change.[17] Vulnerability and demographic data should be refreshed with each new official release, with a formal review at least every three to five years.
Using the same baseline year and named metric owners makes reporting easier to audit:
| Indicator | Definition | Calculation or Method | Spatial Unit | Baseline | Target | Data Source | Reporting Frequency | Responsible Entity |
|---|---|---|---|---|---|---|---|---|
| Connected habitat area | Habitat meeting connectivity criteria and linked to a priority network | GIS overlay of suitable habitat and modeled corridor network | Acres by corridor and citywide | 2026 mapped network | 10% increase by 2035 | Land-cover map, habitat model, project GIS | Annual | Parks and natural resources |
| Wildlife movement suitability | Modeled likelihood that target species can move between priority habitat patches | Connectivity model calibrated with field observations where available | Raster cells and corridor segments | 2026 model score | 15% improvement in priority corridors by 2035 | Habitat model, camera or track surveys | Annual; model review every 3–5 years | Natural-resources department |
| Runoff volume managed | Stormwater volume retained, infiltrated, reused, or detained by green infrastructure | Asset capacity and validated event-based or continuous hydrologic modeling | Site, subcatchment, and sewer service area | 2026 asset inventory | City target for annual volume and design-storm capture | Asset registry, rainfall, flow monitoring, model | Quarterly outputs; annual outcomes | Stormwater utility |
| Peak-flow reduction | Reduction in peak discharge relative to the defined baseline scenario | Pre-project versus post-project hydrologic model or monitored flow comparison | Subcatchment or outfall | 2026 baseline model | Project-specific reduction target | Flow gauges, rainfall, hydrologic model | After qualifying storms and annually | Public works |
| Heat exposure | Population-weighted exposure above the city's heat threshold | Combine temperature or land-surface-temperature data with population and vulnerability layers | Census tract or raster cell | 2026 heat-risk map | Reduce exposure in priority areas by 2035 | Weather sensors, satellite data, vulnerability data | Seasonal and annual | Public health and sustainability |
| Access to cooling space | Residents within a defined walking distance or travel time of a shaded, cooled, or water-accessible public space | Network analysis using sidewalks, entrances, hours, and accessibility features | Census block, tract, or service area | 2026 access map | 90% coverage in priority neighborhoods | Parks inventory, pedestrian network, demographic data | Annual | Parks and planning |
| Maintenance compliance | Percent of assets meeting inspection and maintenance standards | Completed required inspections and corrective actions divided by scheduled inspections | Asset and department | 2026 maintenance registry | At least 95% annually | Work orders, inspections, contractor reports | Quarterly | Asset owner |
Monitoring should lead to action, not sit in a report. Set the response in advance when performance falls short: maintenance escalation, species replacement, revised stormwater controls, or shifted investment. Cities that use monitoring as a governance tool are the ones that close the gap between what gets built and what gets delivered.
FAQs
How is connectivity different from acres of open space?
Acres of open space tell you how much land is there. Connectivity tells you whether that land works as part of a larger living system.
A city can have plenty of parkland on paper. But when those spaces sit apart from each other, they may do far less for species movement, migration, and genetic diversity. That’s the gap many land-based plans miss.
Council Fire helps organizations look past acreage alone and evaluate landscape integrity and ecosystem connectivity.
Which metrics best show real outcomes?
Prioritize a mix of standardized environmental, social, and economic metrics that connect directly to project goals. Begin with baseline conditions, then track indicators such as water absorption, flood risk reduction, air or land surface temperatures, heat-related hospitalizations, energy demand savings, and access to green space.
Economic results should be shown through avoided costs - for example, lower disaster recovery expenses or utility bills - when compared with traditional infrastructure over a 20- to 30-year period.
How should cities prioritize projects across agencies?
Cities need a multi-criteria scoring framework to compare projects in a clear, consistent way. That framework should look at hazard reduction, the number of people who benefit, equity impacts, cost-effectiveness, and environmental co-benefits. The work starts with interdepartmental coordination so teams can align around shared climate data and resilience goals.
From there, cities can rank projects by expected return on investment, using net present value alongside social and operational metrics. That makes it easier to see which projects do the most good for the money spent. Those rankings can then feed into comprehensive or land-use plans, helping city leaders spot shared opportunities and get more from limited budgets.

FAQ