In This Article
Convert local heat and flood observations into prioritized, owned actions with triggers and measurable outcomes.
Community Action Learning Builds Climate Readiness
We build climate readiness by turning local heat and flood findings into actions with owners, deadlines, and funding. We start with one neighborhood and two or three urgent priorities, then check resident reports against field observations and public records.
Our approach connects three tasks:
Find and check risks: Map heat, cooling access, drainage trouble spots, and blocked routes while protecting privacy and fieldwork safety.
Assign the response: Rank actions by urgency, who faces harm, cost, and feasibility; confirm responsibilities and set service triggers.
Check results: Track whether work gets done and whether exposure and disruption decline, then revise the plan with residents.
<u>Our measure of success is less risk - not a finished report.</u> A cooling site must be reachable when people need it; a cleared drain must help keep a route usable.
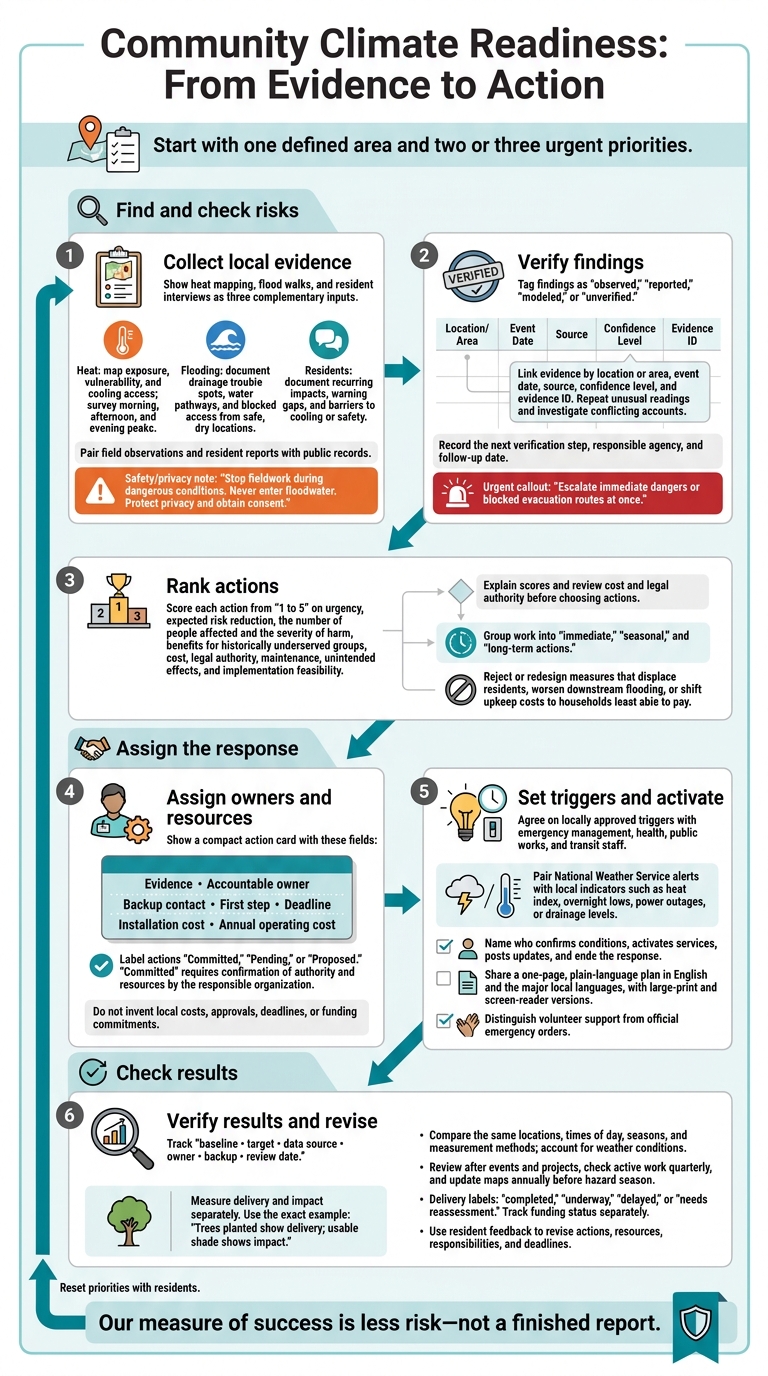
Community Climate Readiness: From Evidence to Action
Map Heat Risks and Cooling Access
Survey Streets and Everyday Destinations
Map heat exposure and access to cooling within your study boundary. Include homes, bus stops, schools, day care centers, workplaces, grocery stores, parks, libraries, health clinics, public housing, and known cooling centers. Add shade trees, covered seating, drinking-water stations, pools, splash pads, air-conditioned public buildings, and the routes connecting them.
Use a standard field form or mobile map to record each location, date, time, observer, shade, surface condition, water, seating, cooling access, hours, transit, and accessibility. Record air and surface temperatures in °F, along with the sensor type and height, sun or shade exposure, recent weather, and measurement method.
Survey morning, afternoon, and evening peaks, but stop fieldwork during dangerous conditions. Label air and surface temperatures separately - an infrared reading of asphalt is not comparable to a shaded air reading. Use the same equipment and protocol at every site, check sensors before deployment, and repeat unusual readings.
Use these observations to check residents’ reports and findings from public data.
Check Hotspots With Residents and Public Data
Pair field observations with residents’ experiences and public records. Ask where and when heat feels worst, which routes or destinations are hard to use, whether homes stay hot overnight, and how people receive heat warnings. Find out what keeps residents from using cooling centers, including transportation, hours, language access, disability accommodations, pets, childcare, work schedules, and concerns about cost or trust.
Compare residents’ accounts with weather, tree canopy, land cover, transit, cooling-center hours, Census data, and the CDC Heat and Health Index.[3][4][5] Use aggregate data to understand patterns without identifying individual households.
Build separate map layers for heat exposure, vulnerability, and cooling access. Tag each finding as observed, reported, modeled, or unverified. Flag gaps, such as a possible evening hotspot with too few observations to confirm it.
Attach site-specific actions to the findings, such as shade at an exposed bus stop, longer library hours during heat alerts, or trees along a school route. Name the organization responsible for each action before adding it to the response plan.
sbb-itb-8baf5f1
Building Inclusive, Community-Led Urban Climate Resilience
Document Flood Risks With Walks and Interviews
Use the same study boundary and evidence log to trace flood pathways and identify blocked access.
Trace Water Routes From Safe Locations
Plan a route from a safe meeting point past low spots, storm drains, culverts, basement entrances, stream edges, and evacuation routes. Walk after rainfall only when local authorities confirm conditions are safe. Work in pairs, choose an accessible route, carry charged phones, and set up a check-in system. Stop for lightning, rising water, traffic hazards, or unstable ground. Never enter floodwater: 6 inches of moving water can knock an adult down, and 12 inches can move a vehicle.[7][8]
From dry, public ground, record each point’s ID, date, time, recent weather, approximate location, photos, drainage condition, and access barriers. Give every point its own ID. Note high-water marks and places where water appears to collect or flow. Keep visible blockages separate from suspected drainage-capacity problems.
Check whether entrances, sidewalks, transit stops, or evacuation routes become unusable. If inspection is unsafe, use dated resident photos or maintenance records and mark the location not verified in person.
Ask Residents About Flood Impacts and Warnings
Speak with affected residents, health workers, emergency personnel, property managers, and businesses. Ask when flooding occurred, how often it returns, where water first appeared, how long it disrupted travel, and how much warning people had.
Ask about damage, mold or contaminated-water concerns, trusted alert sources, and barriers to reaching safety. Explain how responses will be stored and used. Get consent before recording, offer anonymous participation, and avoid collecting names, exact addresses, or sensitive details.
Compare Findings Across the 3 Methods
Use this comparison to identify what needs verification before adding findings to the response plan.
| Method | Purpose | Preparation | Safety | Records | Limitations | Check |
|---|---|---|---|---|---|---|
| Heat mapping | Locate heat exposure and cooling gaps | Consistent sensors and planned routes | Avoid dangerous heat | Temperatures, shade, cooling access | Readings vary by time and weather | Repeat readings; compare weather and land-cover data |
| Flood walks | Trace drainage and blocked access | Safe route, assigned roles | Stay on dry, stable ground where access is permitted | Photos, water marks, drain conditions, access barriers | One visit cannot show what happens in every storm | Check rainfall, FEMA maps, and maintenance records |
| Resident interviews | Explain recurring impacts and warning gaps | Consent, accessible formats, diverse participants | Protect privacy; allow skipped questions | Timelines, disruptions, warning experiences | Recall and participation vary | Compare accounts with dated photos and incident records |
In the shared log, link findings by location or area, event date, source, confidence level, and evidence ID. Agreement strengthens a finding; disagreement calls for follow-up. Use confidence levels to separate findings ready for planning from those that need verification.
Have contributors check whether the account reflects their experience. Then ask public works or floodplain staff to review drainage claims and map interpretation. Check whether conflicting reports describe different storms, basement seepage, sewer backup, or street flooding. Keep unresolved accounts open; flooding outside a FEMA-mapped zone still warrants investigation.[9]
Record the next verification step, responsible agency, and follow-up date. Escalate immediate dangers or blocked evacuation routes at once. Use verified flood findings to rank actions and assign owners in the response plan.
Build a Response Plan With Clear Responsibilities
Turn verified heat and flood findings into a prioritized action matrix organized by hazard, affected population, location, and time period. Tie every action to its evidence, and group the work into immediate, seasonal, and long-term actions.
Rank Actions by Impact, Equity, and Feasibility
Use the matrix to turn findings into actions that can begin soon.
Score each action from 1 to 5 on urgency, expected risk reduction, the number of people affected and the severity of harm, benefits for historically underserved groups, cost, legal authority, maintenance, unintended effects, and implementation feasibility. Briefly explain each score, and review cost and legal authority before choosing actions.
Balance cooling access, shade, drainage, emergency transportation, building improvements, tenant protections, and continuity of critical services. Reject or redesign measures that could displace residents, worsen downstream flooding, or shift upkeep costs to households least able to pay.[10][12]
Assign Owners, Resources, and Deadlines
Use the table as a planning worksheet, not an approvals record, grounded in verified heat and flood findings. Replace each role with one accountable local owner and a backup contact. Record the first step, deadline, and local cost estimate in dollars, with installation costs separate from annual operating costs.
Label each action Committed, Pending, or Proposed. Use Committed only after the responsible organization confirms its authority and resources.[13]
| Risk | Affected groups | Location | Action and first step | Responsible organization / owner | Partners | Resources and status | Delivery date | Equity consideration | Success measure |
|---|---|---|---|---|---|---|---|---|---|
| Extreme heat | Older adults, households without air conditioning | Verified high-heat blocks | Arrange cooling access and rides; first confirm site agreements | Health department / designated coordinator | Libraries, transit agency | Staffing, water, transportation; obtain local dollar estimate; Proposed | Before next heat season; activate at agreed trigger | No-cost, accessible access and language support | Sites open by trigger time; ride requests fulfilled |
| Street flooding | Renters, pedestrians, people with mobility limitations | Documented drainage trouble spots | Inspect and clear inlets; first schedule inspection | Public works / stormwater manager | Sanitation crews, neighborhood groups | Crews, equipment, disposal; obtain local dollar estimate; Proposed | Before local storm season | Prioritize blocked routes to housing and critical services | Reports resolved within agreed response time; fewer repeat blockages |
| Indoor heat | Low-income tenants | Buildings identified through resident reports | Assess building improvements and utility assistance; first confirm inspection authority | Housing department / designated program manager | Building owners, tenant organizations, utilities | Inspection, upgrades, resident support; obtain local dollar estimate; Proposed | Pilot within 6–12 months after approval | Prevent cost shifting and displacement | Improvements completed; remaining access and affordability barriers documented |
Set Response Triggers and Share the Plan
Once actions have owners, define the conditions that will activate them.
Set triggers with emergency management, health, public works, and transit staff. Pair National Weather Service alerts with locally approved indicators, such as heat index, overnight lows, power outages, or drainage levels. For every trigger, name who confirms conditions, activates services, posts updates, and ends the response.
CDC guidance recommends activation thresholds; identification of at-risk populations and geographies; preparedness, response, and recovery actions; partnerships; clear roles; coordination procedures; and processes for evaluation and revision.[6]
Publish a one-page, plain-language plan in English and the major local languages, with large-print and screen-reader versions. Include responsibilities, timelines, accessibility details, and channels for getting help or reporting problems. Clearly distinguish volunteer support from official emergency orders, and state who issues official emergency updates.[11]
Track Results and Update the Plan
Use the response plan’s owners and deadlines to track each action against its baseline. A finished report does not prove readiness. Check whether promised work happened and whether residents face less heat, flooding, or service disruption. Measure delivery and impact separately:
Trees planted show delivery; usable shade shows impact.[16]
Set Baselines and Assign Data Owners
Maintain a separate tracking register for each action and indicator. Include the baseline, target, data source, owner, backup, and review date. Track daytime and nighttime air temperatures (°F), cooling-site access and hours, shade cover, drain condition, flood locations, disruption duration, response times, resident participation, and action completion.
Public works can own drainage records, parks can track shade and tree survival, and resident teams can document access barriers. Record measurement methods and their limits. Do not publish private household or health data.
Compare the same locations, times of day, seasons, and measurement methods before and after work. For flooding, record rainfall intensity and duration. For heat, record humidity, wind, and weather conditions. Use a nearby comparison location when feasible. Do not credit an intervention for milder weather or a single observation. Give each measure a decision rule that links disappointing results to changes in maintenance, staffing, outreach, or spending.
Review After Events and Before Hazard Seasons
Review results after events and projects, check active work quarterly, and update maps annually before hazard season.[14][15] Label delivery completed, underway, delayed, or needs reassessment, and track funding status separately. Verify work before marking it completed. For delayed actions or those needing reassessment, record a next step, owner, resource need, and revised deadline.
After each event or project review, compare results with the plan’s trigger points and assigned actions. Ask residents whether warnings arrived, cooling sites and safe routes were accessible, and disruptions became shorter. Offer phone, paper, online, multilingual, and in-person feedback options.
Share a plain-language update showing baseline versus current results, remaining risks, and what changed because of resident feedback. Record new gaps, revised deadlines, and next steps in the tracking register.
Conclusion: Start With Evidence and Assigned Actions
Start with one defined area and two or three urgent priorities. Add resident observations and public data to the evidence log. For disputed sites, check resident follow-up and public records before confirming the evidence. Then turn the findings into a short response plan with assigned actions.
Keep the cycle simple: collect evidence, assign actions, verify results, and reset priorities. Use the evidence log and tracking register to decide what comes next. Check and update every action, and reassign it when results fall short. Each round puts resident knowledge to work and uses the results to guide the next priorities.
FAQs
How can we start with limited funding?
Start with low-cost actions: set up an emergency communication plan, map cooling centers and shelters, train volunteers, and plant trees [1]. When quantitative data is hard to interpret or unavailable, use expert input or initial screenings to group risks into categories [2].
Work with universities for technical support and regional resilience networks to share resources. Build funding from several sources - state grants, local bonds, and community investment - and treat federal funds as a bonus [1].
How do we reach residents who rarely participate?
Meet residents where they are - in familiar, accessible places such as churches, community centers, schools, or housing complexes. Make it easier to attend by providing childcare, food, transportation, and translation services.
Work with trusted faith leaders, block captains, or community health workers, and pay residents for their time and expertise. Instead of town halls that can feel intimidating, use storytelling circles or photovoice projects to help neighbors speak openly with one another.
What if no agency takes responsibility?
Resilience plans can stall when no one knows who owns the work. Teams may duplicate efforts or miss tasks entirely. Set accountability early by assigning a lead department or organization to each project. Build climate considerations into capital improvement plans, zoning regulations, and departmental budgets.
Council Fire helps organizations put these governance frameworks in place, define roles, and turn sustainability strategies into measurable action that supports long-term community resilience.



FAQ