In This Article
Compare emissions to an approved baseline, track milestones and initiatives, flag data gaps, and trigger corrective action.
Carbon Emissions Dashboards: Reduction Target Tracking
A carbon emissions dashboard should show the gap between actual emissions and the reduction target - and who must act to close it. Start with an approved baseline, set annual or quarterly milestones, and compare emissions and intensity against the plan.
Effective tracking connects five steps:
Approve the baseline: Define the base year, reporting boundary, data checks, and recalculation rules.
Set the reduction path: Link targets and milestones to projects, expected savings, and named owners.
Show progress clearly: Display absolute emissions, intensity, scope totals, and data gaps. Never count missing data as zero.
Act on missed milestones: Assign corrective actions, deadlines, and checks that confirm reductions.
Review and retain records: Review progress at least annually and target validity every five years. Keep the original plan separate from revised forecasts.
The goal is simple: turn emissions data into decisions while keeping planned savings separate from measured results.
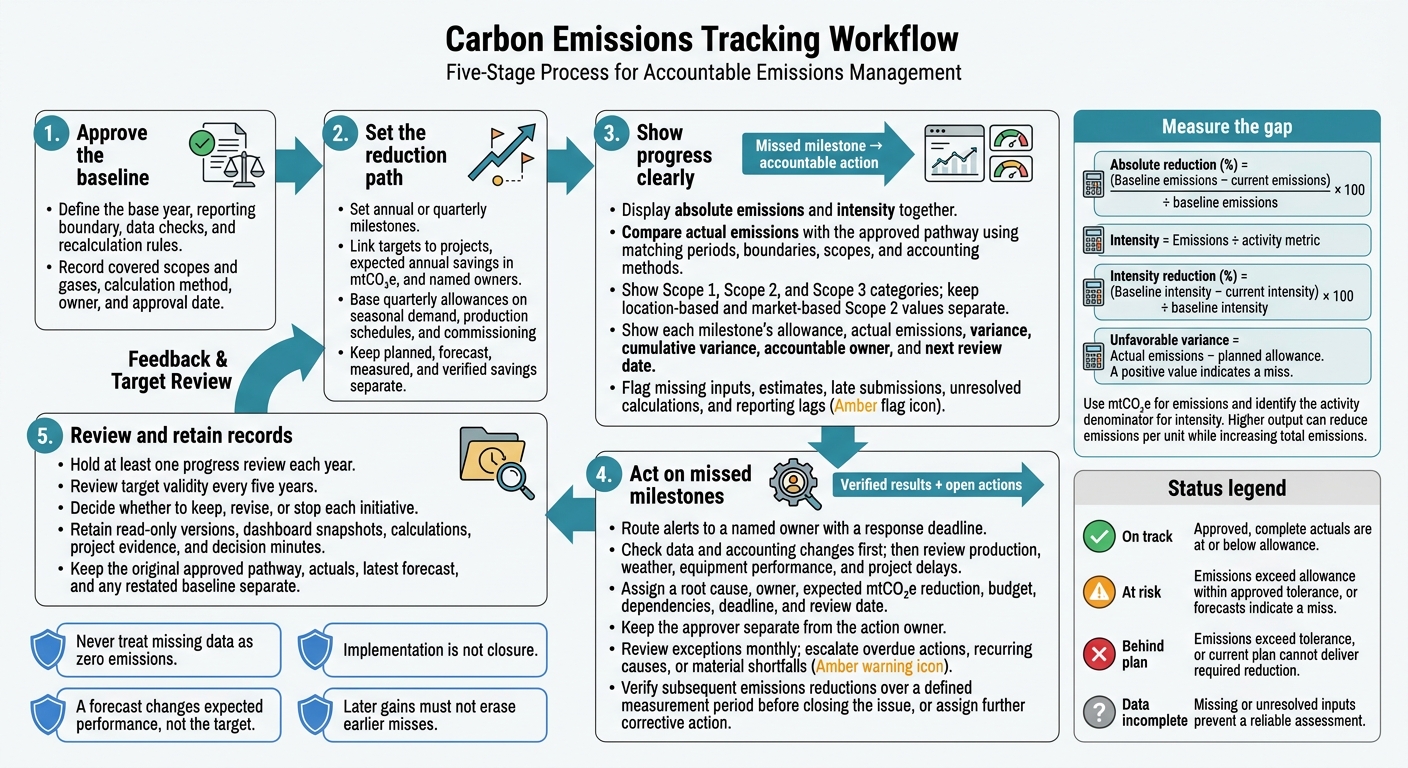
Carbon Emissions Dashboard: From Targets to Verified Reductions
2. Set Targets and Reduction Milestones
Once the baseline is set, define the reduction path the dashboard will track.
Define Absolute and Intensity Targets
Create a target record that includes the base year, target year, boundary, covered scopes and gases, calculation method, owner, and approval date. Document how the target treats renewable electricity, offsets, removals, and acquisitions. Align it with the approved baseline, and state whether it covers gross emissions, net emissions, or both.[3][4]
Use these fields to display progress:
| Metric | Formula | Required inputs | Dashboard display |
|---|---|---|---|
| Absolute reduction | (Baseline emissions − current emissions) ÷ baseline emissions × 100 | Baseline and current mtCO₂e | Baseline, current emissions, target endpoint, percentage reduction, remaining allowance |
| Intensity | Emissions ÷ activity metric | Emissions and a defined activity denominator | Current intensity, baseline intensity, activity level, denominator forecast |
| Intensity reduction | (Baseline intensity − current intensity) ÷ baseline intensity × 100 | Baseline and current intensity | Percentage improvement, target intensity, absolute emissions |
Track an organization-wide absolute target alongside activity-based intensity measures. Higher output can reduce emissions per unit while increasing total emissions.
Choose a denominator tied to operations, such as tons of product, revenue, floor area, or passenger miles. Record its units, source, and reporting period. Display the denominator forecast separately so production changes aren't mistaken for efficiency gains.
Set Annual or Quarterly Milestones
Clearly label each target type:
Base-year percentage targets reduce historical emissions.
Fixed-level targets set an emissions ceiling.
Base-year intensity targets reduce emissions per activity unit.
Baseline-scenario targets compare results with a modeled business-as-usual path.
Do not present scenario-based reductions as historical reductions. For scenario-based targets, record production plans, facility changes, acquisitions, fuel mix, electricity demand, emission factors, weather, efficiency projects, renewable procurement, and denominator changes. Give each assumption an owner, source, effective date, and confidence rating.
For a linear pathway, spread the required reduction evenly across the years between the baseline and target year. Use a nonlinear pathway when documented project schedules support it, but retain the original approved plan.
Set quarterly allowances using seasonal demand, production schedules, and commissioning dates - not simply one-fourth of the annual limit. Display each period's allowance, actual emissions, variance, and cumulative variance. Keep historical and scenario-based milestones clearly labeled, since that distinction determines how the dashboard compares actual emissions with planned reductions.
Link Initiatives to Expected Reductions
For each initiative, record the affected emissions source, expected annual savings in mtCO₂e, owner, and supporting evidence. Compare combined savings with the reductions required each year. Keep planned, forecast, measured, and verified savings separate, each with evidence and an owner. Avoid double counting savings across efficiency and renewable-electricity projects.
Use initiative tracking to explain variances and guide corrective action when milestones are missed. Track cumulative emissions against the planned pathway; later gains must not erase earlier misses. These initiative-level reductions feed the dashboard views in the next section.
sbb-itb-8baf5f1
3. Build Dashboard Views
Once targets and milestones are set, use the dashboard to compare actual performance with the approved plan and show whether progress is on track.
Show Absolute Emissions and Intensity Together
Place absolute emissions and intensity in adjacent panels. Include base-year emissions, current emissions, the target-year allowance, the percentage reduction achieved, and the reduction still required. Show separate trends for Scope 1, Scope 2, and Scope 3 categories. Display location-based and market-based Scope 2 values separately, using the same method across the baseline, current period, and target path.
Beside each intensity trend, show the denominator, reporting period, and covered scopes. For revenue-based intensity, specify U.S. dollars and whether revenue is nominal or inflation-adjusted:
mtCO₂e per $1 million of 2025 inflation-adjusted revenue
Record the inflation index and currency-conversion method. Mark methodology changes on the timeline, and note when accounting changes affect comparability.
Compare Actual Emissions With Milestones
Plot actual emissions against the approved pathway, matching periods, boundaries, scopes, and accounting methods. Define unfavorable variance as actual emissions minus planned allowance. A positive value indicates a miss.
Add filters for business unit, facility, geography, scope, source, period, and target. Keep active filters visible and retain them as users drill into supporting records.
Use one row per milestone. Include an accountable owner and next review date so teams can assign corrective action and escalate issues.
| Field group | Required columns | Display rule |
|---|---|---|
| Milestone details | Milestone period; submission due date | Keep the reporting period end separate from the due date. |
| Performance | Planned emissions allowance; actual emissions; actual reduction; variance | Use mtCO₂e and state whether reductions are measured against the baseline or prior period. |
| Accountability | Status; owner; next review date | Show the accountable owner and next review date. |
Use this same view to route misses to the accountable owner, with the next review date attached.
Flag Data Gaps and Define Status Rules
At the source level, show the latest update date, reporting coverage, and approved/provisional status. Flag missing inputs, estimates, late submissions, unresolved calculations, and reporting lags where they occur. Never treat missing data as zero emissions.
Keep data quality separate from performance. Apply these rules to show whether a period supports comparison, needs action, or cannot yet be assessed:
On track: Approved, complete actuals are at or below allowance.
At risk: Emissions exceed allowance within the approved tolerance, or forecasts indicate a miss.
Behind plan: Emissions exceed the tolerance, or the current plan cannot deliver the required reduction.
Data incomplete: Missing or unresolved inputs prevent a reliable assessment.
Use consistent value and date formats:
1,000 mtCO₂e, $25,000, November 19, 2026
For any slipped milestone, display the person responsible for the response.
4. Act on Missed Milestones
Use the dashboard’s status flags and variance alerts to trigger action - not just flag problems.
Set Alerts and Identify Causes
When a milestone falls off track, use the alert to start a root-cause review and corrective action.
Set alerts for actual emissions above the approved milestone, unfavorable variance beyond a defined tolerance, two consecutive misses, overdue activity data, and missing evidence for completed initiatives. Send each alert to a named owner with a response deadline, and use the same logic to open and route a corrective-action record.
Check data and accounting changes first. Then review production, weather, equipment performance, and project delays. Higher production may explain higher absolute emissions, but it does not close the gap.
| Cause | Required response | Owner | Approval | Evidence |
|---|---|---|---|---|
| Data error or missing data | Correct source data, rerun calculations, document the fix, and restate prior periods if needed. | Data or facilities manager | Sustainability controller or equivalent | Utility bills, meter logs, calculation file, correction log |
| Temporary operating variance | Explain the variance, monitor the next period, and leave the target unchanged unless the change persists. | Operations manager | Business-unit leader | Production data, weather data, maintenance records |
| Structural change | Follow the recalculation policy consistently and disclose original and restated values. | Sustainability lead and finance | Executive sustainability or finance approver | Acquisition or divestiture records, boundary memo, recalculation workbook |
| Delayed initiative | Rebaseline the schedule only with approval and quantify the remaining reduction gap. | Initiative owner | Capital committee or business leader | Project plan, procurement records, revised completion date |
| Proposed target revision | Prepare the business and climate rationale, quantify the impact, and obtain formal approval. Do not weaken the target because of one miss. | Sustainability and finance leadership | Executive committee or board-designated body | Target methodology, scenarios, stakeholder review, approval minutes |
Let the documented recalculation policy - not the missed milestone - determine whether a restatement is required. Structural changes, methodology updates, and discovered errors may trigger recalculation. Organic growth or decline alone does not.[5][6][7]
Assign Corrective Actions and Escalate Repeated Misses
Give every issue a record that includes its root cause, confidence level, owner, expected mtCO₂e reduction, budget, dependencies, deadline, and review date. Keep the approver separate from the action owner.
Review exceptions monthly. Escalate overdue actions, recurring causes, or material shortfalls to business leaders, finance, and sustainability leadership. Ask for a specific decision on funding, staffing, procurement, or timing.
Implementation is not closure. Confirm that the repair, installation, or contract took effect. Then compare subsequent emissions with the expected reduction over a defined measurement period, accounting for production, weather, and operating hours where relevant. Record measured results, uncertainty, and any remaining gap. Close the issue only after verification, or assign further corrective action.
Update Forecasts Without Replacing the Original Plan
Keep the original approved pathway, actuals, latest forecast, and any restated baseline separate. A forecast changes expected performance, not the target.
Label each version with its effective date, approval status, methodology, and reason for change. Clearly mark superseded records. Log old and new values, affected periods, the preparer, the approver, and supporting evidence.
Retain read-only versions, dashboard snapshots, calculations, project evidence, and decision minutes for internal reviews and external reporting. Apply recalculation rules consistently to both material increases and decreases.[5][6]
Carry the latest approved forecast and open actions into the regular target-review cycle.
5. Establish a Regular Target Review
Run regular target reviews using the latest approved forecast and open actions. Hold at least one progress review each year and a deeper target-validity review every five years.[9][8] Use the annual review to fund, revise, or stop initiatives - not simply report results.
Check whether the target still fits current operations and decision needs. Review the approved baseline, boundary, scopes, methods, and recalculation rules. Compare absolute and intensity results with the approved milestone and any interim allowance. Keep incomplete data out of performance decisions until it is approved.
Keep each meeting focused on decisions. Are corrective actions delivering verified reductions? What funding or operating decision comes next? Record whether the review keeps, revises, or stops each initiative, and keep projected savings separate from measured results.
For each target, record the approved base year, owner, primary dashboard view, next milestone and allowance, next review date, and the decision needed at that review.
FAQs
How do we choose a baseline with incomplete historical data?
Define the inventory boundaries and calculation methods, then screen all relevant Scope 3 categories. If activity data is missing, use spend-based estimates or sector-average proxies as a temporary step. Document emission factor years, estimation methods, assumptions, and data-quality scores.
Keep data gaps visible on the dashboard, with an owner and due date for replacing each estimate with activity-based or supplier-specific primary data. Maintain an audit trail so baseline calculations can be reproduced. [1][2]
What if our intensity improves but total emissions rise?
Track absolute and intensity targets separately. Lower emissions per unit can hide growth in total emissions as operations expand. Give each metric its own dashboard label, and calculate variance only when the underlying data is consistent [1][2].
If total emissions exceed your quarterly pathway by more than 10%, use the dashboard to find the root cause - such as higher production volume - and trigger a corrective action plan [1][2].
How should we set thresholds for missed-milestone alerts?
Set clear escalation rules before reporting begins, with thresholds that account for normal operating volatility. Trigger alerts when:
Internal data is more than five business days overdue.
Emissions increase without explanation by more than 5% month over month or 10% against the quarterly pathway.
Factor or GWP changes affect totals by more than 2%.
Annual results miss a target by more than 5%.
Projects are forecast to deliver less than 90% of their approved savings [1].




FAQ