Sep 28, 2026 · 14 min read
Sustainability Strategy
In This Article
How targeted blended finance removes the single binding risk that blocks private investment in solar, wind and mini-grids.
Blended Finance Models: Solar, Wind, Mini-Grids
Not all clean-power projects fail for the same reason, so they should not be financed the same way. From the article, I’d boil it down like this: solar usually needs help with offtake, grid access, or FX risk; wind often needs help with resource, construction, and transmission risk; mini-grids usually need grants, first-loss support, and demand backing.
If I had to give the whole article in a few lines, it would be this:
Utility-scale solar is often the simplest to finance when there is a long-term PPA and a bankable buyer.
Utility-scale wind can have lower power costs, but lenders look harder at wind studies, logistics, and build risk.
Mini-grids face the toughest revenue path because income comes from many small customers, not one contracted buyer.
Blended finance works best when it targets one clear problem - not when it subsidizes the full project.
A few numbers make the point fast:
Global solar investment was projected at $450 billion for 2025
Global grid spending is about $400 billion per year
Solar weighted-average LCOE: $0.043/kWh
Onshore wind weighted-average LCOE: $0.034/kWh
Mini-grid median capital cost in one ESMAP dataset: $4,849/kW
A 40% mini-grid capital grant can cut modeled LCOE from $0.55/kWh to $0.43/kWh
What stands out to me is simple: cheap equipment does not fix weak cash flow, weak buyers, grid delays, or currency mismatch. That is why the article keeps coming back to one test: what is the one risk stopping private money, and what is the smallest public fix that removes it?
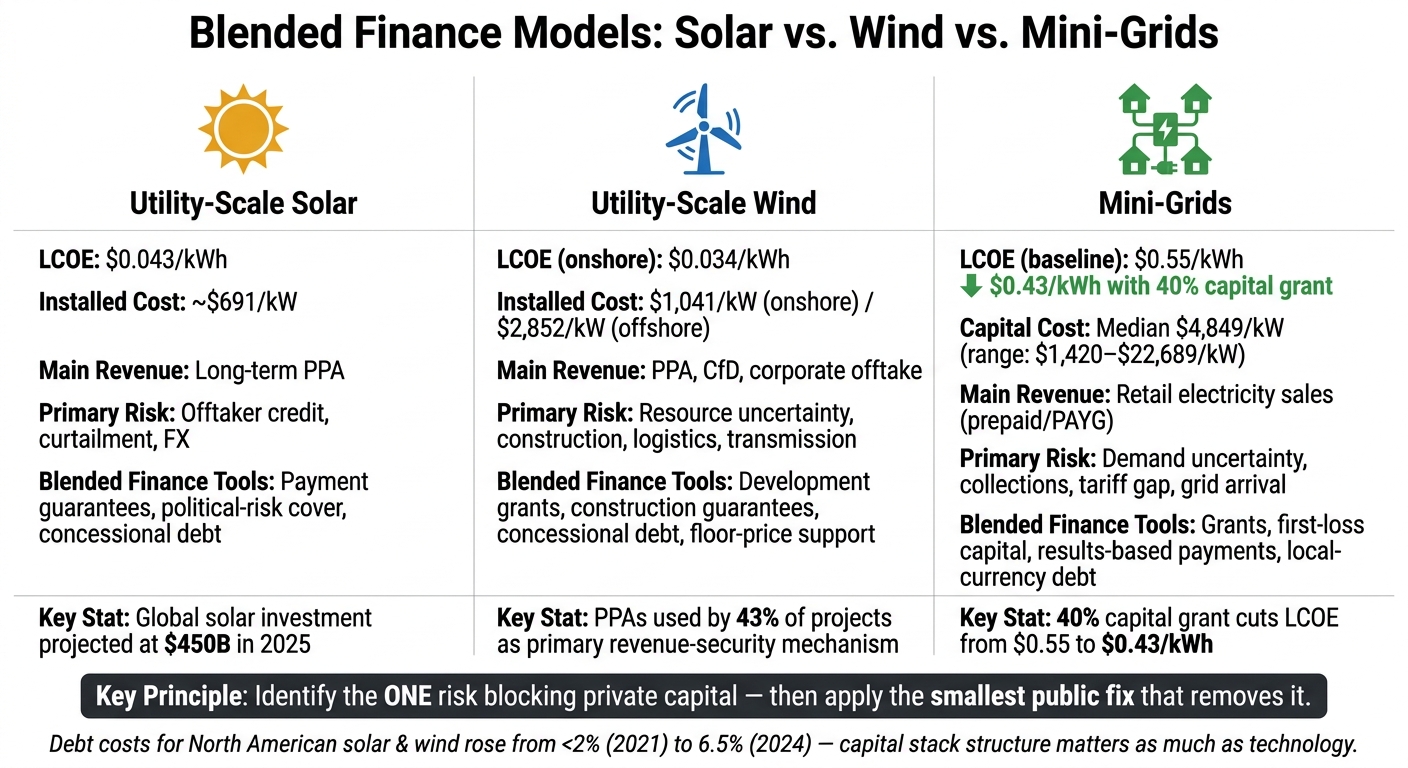
Blended Finance Models: Solar vs. Wind vs. Mini-Grids at a Glance
How are you using blended finance to support renewable energy companies?
sbb-itb-8baf5f1
Quick comparison
| Project type | Main revenue base | Main risk | Common blended-finance use |
|---|---|---|---|
| Utility-scale solar | PPA or merchant sales | Offtaker credit, curtailment, interconnection, FX | Guarantees, political-risk cover, concessional debt |
| Utility-scale wind | PPA, CfD, corporate offtake, merchant mix | Resource uncertainty, construction, logistics, transmission | Development support, guarantees, floor-price tools, concessional debt |
| Mini-grids | Retail power sales to local users | Demand, collections, tariff gap, grid arrival | Grants, first-loss capital, results-based payments, local-currency debt |
My takeaway: the article is less about solar vs. wind vs. mini-grids, and more about matching capital to the exact weak point in each model. Once that fit is right, private lenders are much more willing to come in.
1. Utility-Scale Solar
Risk Profile
Once a utility-scale solar project is operating, day-to-day risk is fairly low. The tougher issues tend to show up earlier, during development and construction. The main pressure points are land, permitting, interconnection, offtaker credit, curtailment, equipment performance, and policy stability.
Even with a signed PPA and a fully permitted site, a project can still get stuck on interconnection delays or grid congestion. That’s where a lot of deals start to wobble. Curtailment risk also has to be built into the base-case energy forecast, debt sizing, and reserve accounts from the start. On the equipment side, module degradation and inverter performance are well understood, but they still matter enough that lenders want bankable technical due diligence before they commit.
For solar, the hard part usually isn’t the technology itself. It’s making the revenue stream bankable and making sure the project can actually deliver power to the grid.
Revenue Model
The easiest structure to finance is a long-term power purchase agreement, or PPA, with a buyer that lenders trust. That usually means a regulated utility, a government-backed buyer, or an investment-grade corporate offtaker. In the U.S., sponsors often combine PPAs with the ITC, accelerated depreciation, and tax equity.[1][3] That package gives lenders something they can underwrite: cash flow they can see and model with some confidence.
Merchant or partly merchant projects are a different story. They usually need more equity, larger reserves, hedging, or concessional risk-sharing because future power prices and congestion are less certain. If cash flow is not locked in by contract, lenders will price in wholesale power volatility. That can mean higher borrowing costs, less debt capacity, or both.
Capital Stack and De-Risking Instruments
A typical U.S. utility-scale solar capital stack includes sponsor or developer equity, construction debt, term debt, tax equity, and sometimes subordinated debt or back-levered debt. Senior lenders usually size debt against contracted cash flow and require debt-service coverage tests, with a typical DSCR target of about 1.25:1.00.[2]
Once contract risk is dealt with, the remaining issues tend to be payment risk, political risk, currency risk, and interest-rate risk. In cases like weak offtaker credit, political exposure in a cross-border deal, or a mismatch between local revenue and U.S.-dollar debt, blended finance can fill the gap. The key is using the right tool in the right place, not throwing broad subsidies at the whole structure.
| Risk | Instrument |
|---|---|
| Utility or government payment default | Payment guarantee or letter-of-credit support |
| Political force majeure, expropriation | Political-risk insurance (e.g., MIGA) |
| Lender repayment risk in higher-risk markets | Partial credit guarantee |
| Early-stage or emerging-market financing gap | Concessional or subordinated debt |
| Floating-rate debt exposure | Interest-rate swap |
| Local-currency revenue vs. U.S.-dollar debt | Currency hedge or local-currency facility |
The World Bank's Scaling Solar program shows how these tools can work together. In Zambia, the International Development Association provided $5.7 million in payment guarantees to backstop a 25-year offtake agreement with state-owned utility ZESCO. That support helped unlock long-term letters of credit and brought in both development and commercial lenders.[4] The lesson here is simple: a small public commitment, placed in the right layer of the capital stack, can pull in much more private money.
For smaller utility-scale projects, standalone project finance often struggles to pencil out because transaction costs are too high relative to deal size. Portfolio aggregation can help by bundling several projects under one financing structure. That spreads risk, cuts due-diligence costs on a per-project basis, and gets the portfolio to a scale that institutional investors can take seriously.
Wind uses much the same project-finance framework, but resource uncertainty, logistics, and transmission risk are tougher to model.
2. Utility-Scale Wind
Risk Profile
Compared with solar, wind calls for deeper resource testing and more downside analysis before lenders will size debt. In practice, they usually want an independent long-term wind-resource assessment and energy-yield report that covers P50 and P90 cases, wake-loss assumptions, turbine availability, and curtailment scenarios. It also helps to pressure-test the model against cost overruns, interconnection delays, interest-rate spikes, weak power prices, and turbine underperformance.
Construction risk matters here too, and it can get messy fast. Large turbines need specialized transport, heavy-lift equipment, and complicated civil works. Offshore wind pushes that even further, with marine weather windows, installation vessels, subsea cables, port capacity, and foundation engineering all in play. Any one of those can become a bottleneck.
Revenue Model
The structure lenders usually like most is a long-term PPA with a creditworthy buyer. IRENA reports that PPAs were identified by 43% of survey respondents as the most common revenue-security mechanism, ahead of feed-in tariffs (22%) and contracts for difference (14%).[9] Even then, wind PPAs need careful drafting around price mismatch risk, curtailment compensation, and imbalance costs.
Corporate offtake can work as well through physical PPAs, virtual PPAs, or contracts for differences. The catch is that these setups may leave the project exposed to the gap between the project node price and the market hub price. Merchant or hybrid-revenue projects usually need lower leverage, larger reserves, or floor-price support to keep senior lenders comfortable. Tax benefits can lift investor returns, but they do not create the same debt-service capacity as operating cash flow.[6]
Capital Stack and De-Risking Instruments
A typical U.S. land-based wind capital stack combines sponsor equity, tax equity, and debt, including construction loans, term debt, and sometimes back-leverage debt at the sponsor level.[5] NREL's representative land-based wind financial cases assume about 80% construction leverage, a 1.40x debt-service coverage ratio, and a 9% after-tax operating equity return.[7][8] Those assumptions show, in plain terms, how lenders size wind debt.
Concessional capital works best when it is aimed at the last risk keeping private debt out of the deal. That might be weak offtaker credit, merchant exposure, political risk, or a currency mismatch. The table below shows the main wind risks and the tools most often used to address them.
| Risk | Instrument |
|---|---|
| Weak offtaker | Payment guarantee, sovereign backstop, letter of credit |
| Merchant or partial merchant exposure | CfD, floor-price support, subordinated debt |
| Construction and completion risk | Completion guarantee, liquidated damages, contingency reserves |
| Political risk in cross-border deals | Political-risk insurance (e.g., MIGA) |
| Local-currency cash flow vs. U.S.-dollar debt | Currency hedge, TCX or GuarantCo facility |
| Offshore supply-chain, port, and vessel risk | First-loss capital, concessional loans, public port/grid investment |
A Finland-supported IFC blended-finance climate program reported that each $1 of Finland's contribution mobilized more than $13 from IFC and third-party sources.[10] That is a program-level figure, not a per-project wind benchmark. Still, it shows how a small concessional commitment can bring in much larger pools of private and development capital. The main point is discipline: use concessional tools only for the specific residual risk blocking private capital. Mini-grids change the picture again, shifting the risk mix away from resource and transmission issues and toward demand and collection risk.
3. Mini-Grids
Risk Profile
Mini-grids don’t work like utility-scale solar or wind. The developer isn’t just funding power generation. They also have to build distribution, run retail service, and deal with the fact that local demand may or may not show up as planned. On top of that, they face payment collection risk and the chance that the national grid arrives later and changes the whole business case.
That changes the financing picture in a big way. Utility-scale solar and wind usually live or die on grid access and the strength of the offtaker. Mini-grids depend far more on local demand and whether customers actually pay. So the risk shifts away from resource and transmission issues and toward demand, collections, and regulation. Construction and technology risk are still there, but they sit alongside uncertain demand, low customer density, payment collection, local permitting, and future grid arrival.
ESMAP data across 53 mini-grid projects show capital costs from $1,420 to $22,689 per kW of firm capacity, with a median of $4,849/kW, driven by location, system design, network length, and customer density.[13] Most sites are too small for plain project finance, so developers often need portfolio structures and concessional capital to get to financial close.
Revenue Model
Mini-grid revenue comes from electricity sales, usually through regulated tariffs, prepaid metering, or pay-as-you-go billing. That sounds simple enough, but the cash flow profile is very different from utility-scale solar and wind. Instead of one contracted buyer, the project depends on hundreds or thousands of small payments.
Customer mix makes or breaks the model. If the load is mostly households, usage is often too low to support strong cash flow. The picture gets better when the system serves commercial and productive-use customers such as mills, irrigation pumps, refrigeration, telecom towers, workshops, and small manufacturers. Those users help lift utilization and improve project economics.
ESMAP modeled fully cost-recovering electricity costs at $0.55/kWh in a low-productive-use scenario and $0.42/kWh where productive-use activity raised utilization to 40%.[13] More productive use pushes LCOE down and gives the project more room to carry debt. Results-based financing and targeted subsidies can help cover the gap between what customers can pay and what full cost recovery requires, without putting the whole burden on consumer tariffs.
That revenue profile shapes how much concessional capital needs to sit in the stack.
Capital Stack and De-Risking Instruments
A blended-finance structure for mini-grids usually starts with grants or first-loss capital at the base. Above that comes concessional debt or subordinated capital, then sponsor equity, and, if cash flows are stable enough, commercial senior debt. Portfolio structures matter here because they cut transaction costs and make a group of projects easier to finance than a single small site on its own.
ESMAP analysis found that a portfolio approach could reduce upfront capital costs by roughly $100/kW compared to isolated projects.[12] ESMAP also estimates that a 40% capital-cost grant could reduce LCOE from $0.55/kWh to $0.43/kWh in a low-productive-use case, or from $0.42/kWh to $0.34/kWh where productive use raises utilization to 40%.[13]
| Risk | Instrument |
|---|---|
| Uncertain demand and slow connection ramp-up | Results-based financing, demand-stimulation grants, appliance finance |
| Customer affordability and tariff gap | Viability-gap funding, lifeline tariffs, targeted subsidies |
| Local-currency revenue vs. U.S.-dollar equipment costs | Local-currency lending, guarantees, or currency hedges |
| Early portfolio losses | First-loss capital, subordinated debt |
| Regulatory and grid-arrival uncertainty | Standardized concession agreements, clear grid-arrival rules |
| Battery replacement and degradation | Battery performance warranties, clear replacement provisions |
| Development-stage costs | Development grants, technical-assistance funding |
Results-based grants tend to fit best when the main goal is electricity access. One Sustainable Energy for All program in Madagascar provided $433 per verified electricity connection, paid only after verified connections.[11] The pattern is pretty clear: public capital works best when it covers the first layer of demand, collection, or development risk, rather than paying for the entire system. That’s why mini-grid finance leans more heavily on grants, first-loss capital, and demand support than utility-scale solar or wind.
Pros and Cons by Project Type
Each technology comes with its own mix of upside and risk, and that mix shapes the financing structure. Put simply, different risk profiles lead to different capital stacks.
Utility-scale solar is usually the most standardized and repeatable of the three. IRENA's 2024 data puts its global weighted-average LCOE at $0.043/kWh and its total installed cost at about $691/kW, around 41% lower than the cheapest fossil-fuel alternative.[14] Because solar is modular and build times are short, lenders and investors often find it easier to back at scale. Still, the weak spots are familiar: intermittency, land and transmission limits, and exposure to offtaker risk or merchant power prices.
Utility-scale wind can produce even lower power costs in the right places. Onshore wind reached a global weighted-average LCOE of $0.034/kWh in 2024, about 53% below the cheapest new fossil-fuel option.[14] But wind is more site-specific and harder to replicate from one project to the next. Permitting often takes longer, and turbine transport and installation add more moving parts. Offshore wind is even more capital-heavy, with average installed costs of $2,852/kW in 2024 versus $1,041/kW for onshore projects.[14]
Mini-grids fill a very different role. They serve places where extending the central grid does not make economic sense, so their financing problems go well beyond construction risk. Demand, affordability, regulation, and long-term operating strength tend to matter more. The International Finance Corporation built a blended-finance guarantee aimed at demand risk in mini-grids and expects it to help mobilize about $400 million in capital investment.[17] A Global Infrastructure Hub case study from the Democratic Republic of the Congo points to a minimum-revenue guarantee that cut demand and revenue risk and drew in more private investment.[16]
The table below shows where the financing model starts to split by project type:
| Project Type | Major Advantages | Major Drawbacks | Where Blended Finance Adds the Most Value |
|---|---|---|---|
| Utility-scale solar | Modular design; relatively standardized equipment; short construction periods; scalable portfolio financing; predictable operating costs | Intermittency; land and transmission constraints; offtaker or merchant-price exposure | Development grants; payment, political-risk, and foreign-exchange guarantees; concessional or subordinated debt; aggregation in newer markets |
| Utility-scale wind | High energy yield; can complement solar generation; established project-finance structures in mature markets | Longer development and permitting timelines; resource and production uncertainty; complex logistics; transmission and community-acceptance risks | Resource assessment grants; early development capital; construction and political-risk guarantees; concessional debt; community-benefit planning and transmission support |
| Mini-grids | Extends electricity access; supports local businesses and productive use; deployable where grid extension is uneconomic | Fragmented customer base; demand and affordability uncertainty; weak customer credit; regulatory and grid-arrival risk; high transaction and operating costs | Pre-investment grants; CAPEX subsidies; demand-risk and minimum-revenue guarantees; performance-based grants; portfolio finance; productive-use appliance finance; technical assistance |
One point runs through all three: lower equipment costs do not erase financing risk. A 2025 analysis found that nominal debt costs for North American solar and wind deals climbed from below 2% in 2021 to 6.5% in 2024.[15] So even when hardware gets cheaper, higher interest rates, currency volatility, and country risk can still push up LCOE and weaken bankability. That's why the structure of the capital stack matters just as much as the technology itself.
The pattern is pretty clear: the less risk left on the table, the easier it is to bring in private capital.
Conclusion
Blended finance works best when it goes straight at the thing keeping private capital on the sidelines. Sometimes that’s weak offtaker credit. Sometimes it’s early-stage development risk, lack of scale, or foreign-exchange exposure. The first job is simple: figure out the binding constraint. Then use the instrument that fits it.
That idea leads to a clear financing map:
| Project Conditions | Best-Fit Model | Primary Constraint Addressed |
|---|---|---|
| Large solar or wind; creditworthy PPA; moderate country risk | Senior commercial debt plus political-risk cover | Country or contract-enforcement risk |
| Utility-scale wind; pre-financial close | Development grants plus concessional equity and construction guarantee | Development-stage and completion risk |
| Medium distributed portfolio; local-currency revenues | Warehouse facility with first-loss tranche plus local-currency debt | Portfolio aggregation and FX risk |
| Mini-grid portfolio; uncertain demand; foreign-currency debt | Aggregated platform plus first-loss capital, results-based payments, and local-currency debt or FX hedge | Demand risk, small scale, and currency depreciation |
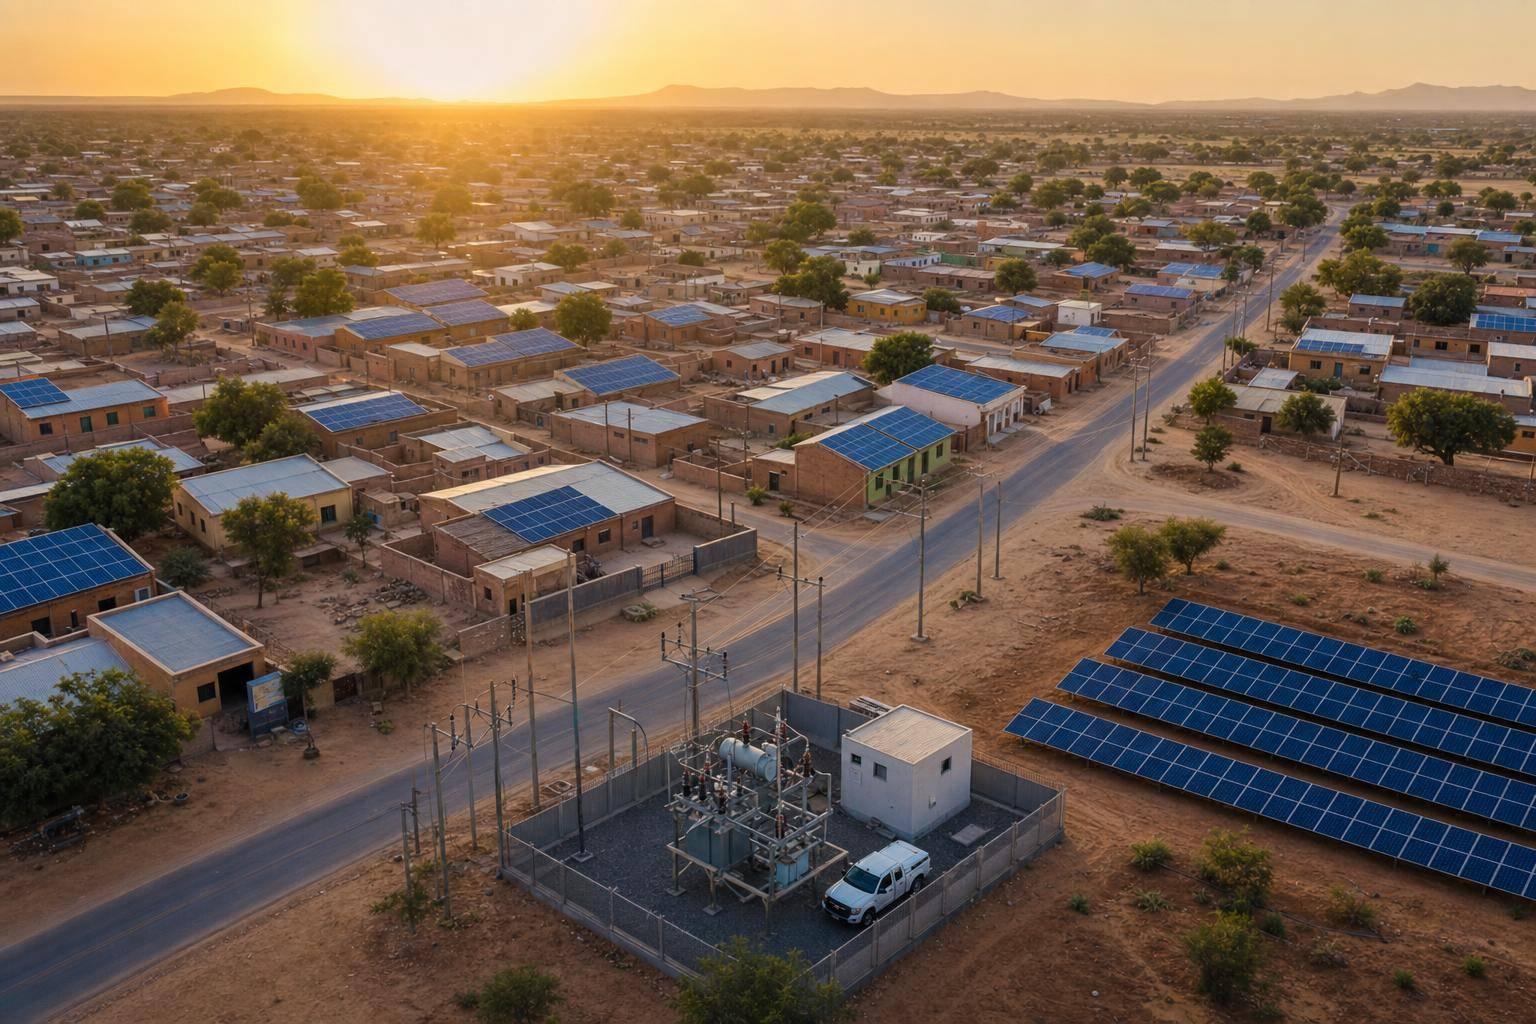
The Darway Coast solar mini-grid in Nigeria puts that logic into practice. A 526-kilowatt system serving 7,711 connections was financed with a fixed-rate naira facility, subordinated first-loss capital, an AAA-rated InfraCredit guarantee for senior green bonds, and six domestic institutional investors.[18] That setup worked because it fit the project’s core issues: small scale, local-currency revenue, and limited domestic credit appetite. The same pattern holds across solar, wind, and mini-grids: fund the risk that blocks private capital, and no more than that.
FAQs
What is blended finance in clean energy?
Blended finance brings together public, philanthropic, and private capital to fund clean energy projects that might look too risky to commercial investors on their own.
The idea is simple: use concessional funding - such as grants, low-interest loans, or first-loss capital - to improve a project’s risk-return profile. In plain terms, that early support helps absorb some of the upfront risk. Once that cushion is in place, private investors are often more willing to come in, which helps move clean energy projects forward while supporting broader climate goals.
Why do solar, wind, and mini-grids need different financing models?
They need different financing models because the projects don’t look the same on the ground. Their scale is different, their income is more or less predictable, and the level of risk shifts a lot from one setup to another.
Utility-scale solar and wind projects often produce steady, long-term cash flow through power purchase agreements. That kind of income stream fits what commercial investors usually want: a clearer path to returns and less uncertainty over time.
Mini-grids are a different story. They tend to serve smaller, scattered customer groups, and they often face higher operating risk. Because of that, they more often depend on results-based financing or portfolio models. Those approaches help cut performance risk and lower transaction costs.
How do investors identify the main risk to de-risk first?
Investors start by pinpointing the main risk they need to reduce before private capital will come in. That means looking closely at the barriers getting in the way, whether that’s political instability, currency swings, or uncertainty around performance.
From there, they study the project’s revenue model, the gap it fills in the market, and the size of the opportunity. The goal is simple: figure out whether the key obstacle is financial, operational, or regulatory. Once that binding constraint is clear, they can match it with the financial instrument that fits best.
FAQ