In This Article
Screen basins broadly, verify locally, and act on water risk—scores flag exposure but don't predict losses.
Water Risk Tools Link Basin Stress to Business Risk
A high water-stress score is a reason to investigate - not proof that production will stop. I use WRI Aqueduct to screen basin pressures and WWF Water Risk Filter to assess how those pressures could affect sites and suppliers. Before choosing actions, I check water sources, seasonal demand, permits, and backup supplies.
The comparison covers three questions:
Where and when could shortages occur? Compare basin stress, drought, seasonal patterns, and future scenarios.
What else could limit supply? Check water quality, ecosystem health, access, rules, and community concerns.
What should the business do? Link site dependence and supplier exposure to demand reduction, reuse, contingency plans, or watershed work.
Quick Comparison
| Comparison | WRI Aqueduct | WWF Water Risk Filter |
|---|---|---|
| Main use | Compare basin pressures across locations | Connect basin pressures with site dependence and controls |
| Timing | Seasonal layers and scenarios for 2030, 2050, and 2080 | Drought and seasonal shortage indicators |
| Ecosystems and governance | Screening indicators that need local checks | Physical, regulatory, and reputational risk across 12 categories |
| Company inputs | Locations and portfolio data | Locations, industries, and site questionnaires |
| Decision support | Prioritize sites for investigation | Match site weaknesses with response options |
My rule is simple: screen broadly, verify locally, then act. <u>Neither tool predicts business losses on its own.</u> I would track water use, downtime, permit compliance, and watershed results - not just changes in a score.
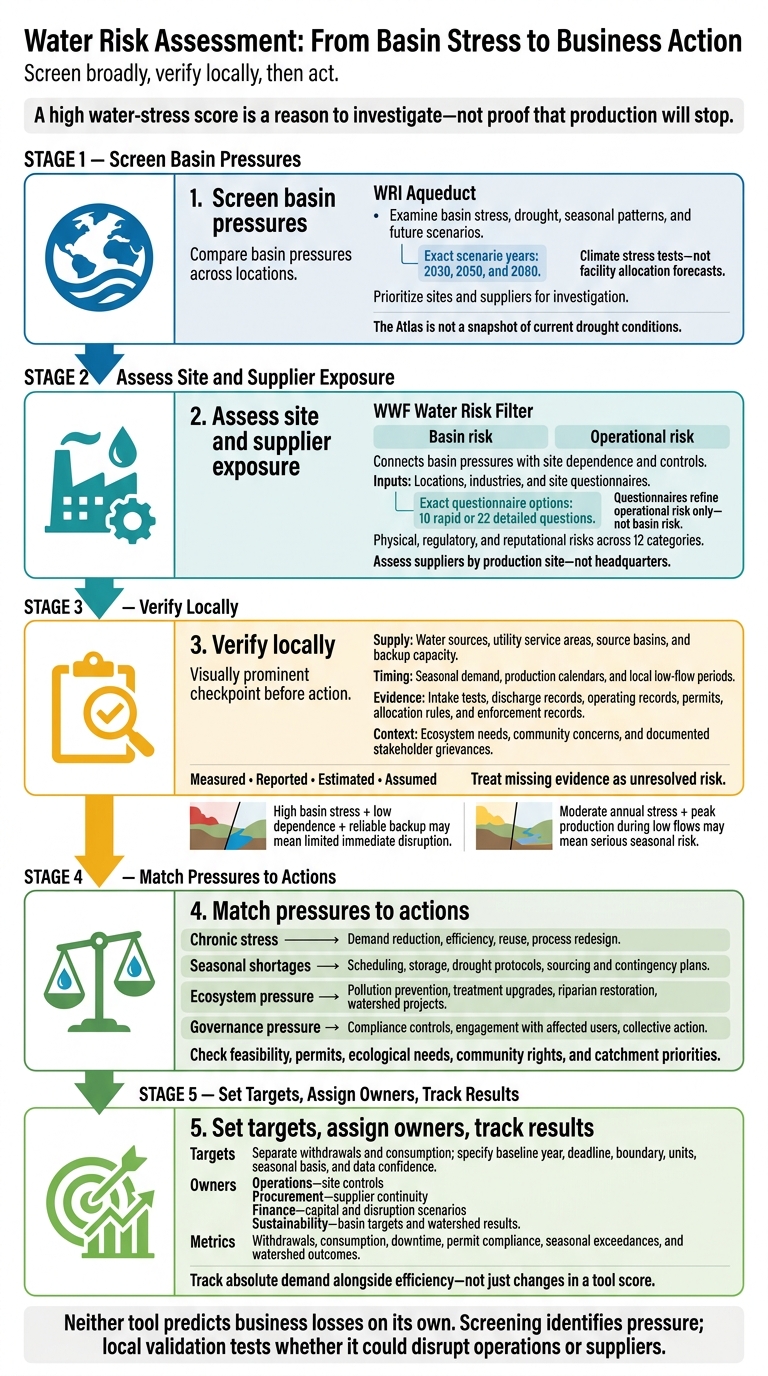
Water Risk Assessment: From Basin Stress to Business Action
1. WRI Aqueduct Water Risk Atlas
Basin and Seasonal Coverage
Aqueduct 4.0 adds basin-scale and seasonal layers, usually mapped to HydroBASINS Level 6 sub-basins.[7][8][9] This scale helps compare locations worldwide, but it can miss differences between neighboring facilities served by separate utilities or aquifers. Many water quantity indicators draw on 1979–2019 data, so the Atlas is not a snapshot of current drought conditions.[2]
Seasonal variability tracks changes in freshwater supply within a year; interannual variability tracks year-to-year swings.[1] Check monthly results for overlap between peak demand and low supply, especially when production peaks during the dry season. Projections for 2030, 2050, and 2080 support climate stress tests - not forecasts of facility-level water allocation.[6]
Ecosystem and Governance Indicators
After assessing basin stress, check whether local water quality, depletion, or access pressures add business risk. Water depletion measures consumptive use relative to supply. Quality indicators cover untreated wastewater and coastal eutrophication risk, while drinking water and sanitation indicators provide social context.[10]
Use these layers for screening, not local verification. Their source resolutions and methods differ, so they cannot confirm local habitat health, discharge compliance, or regulatory capacity. Review individual indicators rather than relying only on the composite score, which can hide separate pressures.[9]
Business Exposure and Mitigation
Screen basin stress, identify exposed sites and suppliers, and then test mitigation options. Overlay the results with withdrawal volumes, production value, and supplier criticality. Give priority to sites where water constraints could halt core production - not just those with the highest basin scores.
Check demand-reduction investments against local hydrology and site operations. Record the dataset version, baseline period, basin unit, and scenario so future comparisons use a clear reference point. The next tool tests how basin stress reaches facilities, suppliers, and local operations.
sbb-itb-8baf5f1
2. WWF Water Risk Filter
Basin and Seasonal Coverage
The free WWF Water Risk Filter separates basin risk from operational risk and supports assessments of owned facilities, suppliers, and planned expansions.[4][15][16] Scores range from 1, “very low,” to 5, “very high.”[16]
Water availability, drought, and seasonal indicators track different pressures: water stress, drought exposure, and recurring shortages.[4][12] A seasonal classification flags elevated stress during at least one month each year; it is not a monthly water balance.[5] Use site operating records and local hydrology to confirm when shortages occur and how long they last.
Ecosystem and Governance Indicators
The framework assesses physical, regulatory, and reputational risks across 12 categories, including ecosystem services, water quality, accessibility, and governance.[4][16] These results help explain why efficiency alone may fall short. Pollution may require treatment upgrades, ecosystem damage may call for watershed restoration, and stakeholder conflict may require engagement.[13]
Business Exposure and Mitigation
Enter a location and industry to generate the initial basin assessment with default industry weights. Operational questionnaires offer a choice of 10 rapid or 22 detailed questions, adding data on water dependence, sources, discharge, and controls. They refine operational risk only, not basin risk.[4][11]
Start detailed assessments at high-materiality sites that depend on water. Screen critical suppliers by production site rather than headquarters.[4][14] WWF’s response toolbox offers more than 200 mitigation actions. Match each action to a specific operational weakness, assign an owner, and confirm that it is feasible.[13]
For the comparison that follows, keep basin stress, site exposure, and response options separate.
WRI's Aqueduct: an interactive map of water risk and stress
Compare Ecosystem and Governance Indicators
Use the table below to distinguish modeled basin signals from local evidence of business disruption. Compare what each score measures - not just its label - and check evidence gaps locally.[18] Treat missing evidence as unresolved risk.
| Pressure | WRI Aqueduct | WWF Water Risk Filter | What to verify before assigning business risk |
|---|---|---|---|
| Water quality | Modeled: coastal eutrophication potential. Proxy: untreated connected wastewater, which does not show contaminant levels at an intake.[2] | Flags basin water-quality pressure. | Direct: intake tests and discharge records. Check salinity, turbidity, and permit-specific contaminants to assess treatment costs and production limits. |
| Ecosystem condition and services | Proxies: threatened amphibians and upstream protected land.[1] | Flags ecosystem-service pressure. | Gap: filtration, recharge, and flood buffering. Use field surveys, environmental-flow studies, and watershed plans to assess source reliability and withdrawal limits. |
| Water access and sanitation | Proxies: unimproved drinking-water access and untreated connected wastewater.[2] | Flags access and sanitation pressure. | Direct: utility service records and household surveys. Check shared-source dependence and outages that could interrupt supply or intensify community opposition. |
| Regulatory pressures | Gap: governance and local water-management practices are only partly represented.[9] | Flags governance pressure. | Direct: permits, allocation rules, and enforcement records. Legal review should confirm water-rights priority, renewal risk, and drought restrictions. Base legal conclusions on permit records.[9] |
| Stakeholder signals | Proxies: media coverage and public-awareness indicators.[1] | Flags reputational pressure. | Direct: documented grievances and consultation records. Local interviews, including Indigenous or tribal perspectives, help identify unresolved concerns that could delay permits or restrict access. Date findings and record whom you consulted. Use community knowledge to test whether low media coverage reflects acceptance.[1] |
Aqueduct’s untreated-connected-wastewater indicator covers sewer-connected households whose wastewater receives no treatment. It does not cover industrial discharges, agricultural runoff, or private septic systems - gaps that matter when estimating treatment needs.[2]
Complete these checks before matching pressures to site actions.
Compare Business Uses and Mitigation Choices
Use basin screening to flag exposure, then test with site data whether that exposure could interrupt operations. Check basin stress, seasonal shortages, and ecosystem pressure against local conditions before making business decisions.[6][11][17] Each tool serves a different role in this workflow.
| Business consideration | WRI Aqueduct Water Risk Atlas | WWF Water Risk Filter |
|---|---|---|
| Required company inputs | Location and portfolio data. | Site, industry, and site questionnaire inputs. |
| Strengths | Consistent geographic comparisons and adjustable indicator weightings. | Links basin pressures to site dependence and response guidance. |
| Limits | Does not establish supply reliability, seasonal operating needs, or contractual protection. | Relies on accurate company responses checked against measurements, permits, and local evidence. |
| Suitable decisions | Prioritize investigations and provisional basin targets. | Choose site controls, contingency measures, and locations needing field assessment. |
Map Facility and Supplier Exposure
Create one record for each site that links its location, supply source, dependence, timing, permits, backups, and business impact. Include utility service areas, withdrawals, consumption, discharges, production calendars, and estimated continuity duration. Trace imported water to its source basin so source constraints can be linked to potential disruption. Apply the same approach to upstream farms, processors, and other critical suppliers - not their headquarters. Label inputs as measured, reported, estimated, or assumed, and show confidence ranges where origin data are uncertain.
High basin stress may pose little immediate disruption for a low-water-use site with reliable supply and backup capacity. Upstream exposure, however, may remain. Moderate annual stress can also hide serious seasonal risk if peak production coincides with low flows or withdrawal restrictions. Compare dry-season conditions with operating calendars, then estimate downtime, emergency supply costs, and logistics disruption. A basin score is not a loss forecast.[2]
Use the exposure map to connect each pressure with controls the business can influence.
Match Water Pressures to Actions
Choose actions based on severity, dependence, timing, and control.
| Pressure and business condition | Actions matched to timing and control | Checks before committing |
|---|---|---|
| Chronic stress: persistent scarcity and high dependence | Operations: reduce demand, improve efficiency, reuse water, or redesign processes. | Water quality, treatment energy, residuals, permits, and downstream flows. |
| Seasonal shortages: low flows overlap production peaks | Operations: scheduling, storage, and drought protocols. Procurement: sourcing and contingency plans. | Storage duration, drought triggers, allocation rules, and alternative-source reliability. |
| Ecosystem pressure: abstraction or discharge threatens source reliability or operating permissions | Pollution prevention, treatment upgrades, riparian restoration, and watershed projects. | Ecological needs, cumulative impacts, discharge limits, and community priorities. |
| Governance pressure: conflicting claims or changing rules threaten access | Compliance controls, engagement with affected users, and collective action. | Legal authority, equitable allocation, local representation, and grievance processes. |
Set Targets and Assign Owners
Give each selected action a tracked target and an accountable owner.
Set separate basin-specific targets for withdrawals and consumption. State the baseline year, deadline, boundary, units, seasonal basis, and data confidence. Specify whether targets cover owned operations, suppliers, or both. Aqueduct’s threshold-based reductions are planning scenarios, not enforceable limits or allocation rules.[3] Final targets should align with permits, ecological needs, community rights, and catchment priorities.[19][20]
Assign operations responsibility for meters, efficiency, reuse, storage, and drought procedures. Procurement should manage supplier locations, origins, contracts, and continuity plans. Finance should own capital and disruption scenarios, while sustainability should own basin targets, stakeholder engagement, and watershed results.
Track withdrawals, consumption, downtime, permit compliance, seasonal exceedances, and watershed outcomes, with an owner assigned to every metric.
Conclusion: Screen Broadly and Validate Locally
The comparison points to a simple rule: Choose the tool that fits the decision. WRI Aqueduct screens basin stress and future scenarios, while the WWF Water Risk Filter adds site-level, ecosystem, governance, and stakeholder context.[2][6][21] Use both when the decision and available data support it. When data are sparse, label findings preliminary. Screening shows where water stress exists; local validation checks whether it could disrupt operations or suppliers.
When screening flags material risk, validate priority sites and suppliers using input from local authorities, operating records, and affected communities. Resolve gaps in basin boundaries, timeframes, and data quality before acting. Focus business action on reducing water demand, disruption exposure, and watershed pressure, rather than simply improving a tool score. Track absolute demand alongside efficiency so growth does not hide increasing pressure on shared water sources.
FAQs
What should I do if water risk scores conflict?
When water risk scores conflict, assess the site directly. Combine global risk mapping tools with input from local water authorities and hydrogeological consultants. Their local knowledge helps account for sub-basin conditions, aging infrastructure, and stakeholder dynamics that broader datasets may miss.
Add internal data on water withdrawal volumes, discharge quality, and supply chain dependencies. This grounds your assessment in actual watershed conditions instead of leaving you to rely on conflicting external scores.
How can I assess suppliers with limited water data?
Map supplier locations using geographic coordinates. Then use basin-level screening tools to assess water stress, drought risk, and regulatory exposure - even when facility data isn’t available.
Ask major suppliers in high-risk locations to report their water use and management practices. Help smaller suppliers with training and simple assessments. Make water resilience part of procurement criteria and supplier agreements, and consult local water authorities or hydrogeological consultants for site-specific context.
How often should I reassess my water risks?
Track baseline water risk indicators monthly or annually, and reassess when heat waves or droughts occur. Annual averages can hide seasonal shortages and sudden changes that affect operations and supply chains.
Pair routine monitoring with in-depth vulnerability assessments. Use local hydrological data, climate scenarios for 2030, 2040, and 2050, and early warning systems to identify emerging pressures.


FAQ