
Jun 29, 2026
Ultimate Guide to ESG Risk Analysis in Agriculture
ESG Strategy
In This Article
ESG risk in agriculture must link field data, supplier oversight, and governance to money, reporting, and capital decisions.
Ultimate Guide to ESG Risk Analysis in Agriculture
Agriculture faces ESG risk from every angle: water, weather, labor, supply chains, and board oversight. In the U.S., this matters because a farm issue can turn into a processor cost problem, a lender credit problem, or a reporting problem for a public company.
If I had to boil this article down, I’d say this:
Start with the risks that hit cash flow first: drought, water limits, soil loss, worker safety, and weak supplier controls.
Use the right frameworks for the job:SASB for investor-facing metrics, IFC standards for project finance reviews, and TCFD/TNFD for climate and nature risk.
Build the process in order: assign oversight, map the value chain, score risk, collect field and supplier data, and tie results to spending decisions.
Focus on proof, not promises: farm-level data, labor records, satellite data, and Scope 3 inputs matter because upstream and downstream emissions can make up 80%–95% of an agrifood company’s footprint.
Treat ESG as a business risk system: not a side report, but part of capital planning, supplier review, and board reporting.
A few numbers frame the issue fast:
U.S. agriculture is a $400+ billion industry.
Agriculture produces about 10%–12% of global greenhouse gas emissions directly, or about 22% with land-use change.
Farming uses about 70% of global freshwater withdrawals.
For many food companies, emissions outside direct control account for about 90% of total greenhouse gas inventory.
Bottom line: if you want ESG risk analysis in agriculture to work, you need a simple system that links field conditions, supplier data, and governance to money, risk, and reporting.
Are you ESG ready? | What is ESG?
Core ESG Risks Across Agricultural Value Chains
Agricultural ESG risk tends to land in three groups: environmental, social, and governance. On paper, that sounds neat and tidy. In practice, these risks show up all along the value chain, from the farm gate to processors, lenders, and buyers. A problem in one part of the chain can spill into the rest through supply disruption, cost swings, and reporting pressure.
Environmental Risks: Climate, Water, Soil, and Inputs
Climate swings can hit hard and fast. One bad season can cut yields and push insurance costs up at the same time. In the 2023 crop year, drought across the Southern Plains and flooding in California's Central Valley caused significant yield reductions and increased price volatility across multiple commodity markets [1].
Water risk is just as serious, especially in places where irrigation is doing the heavy lifting. In water-stressed regions, that dependence can turn into both regulatory risk and asset risk. Fertilizer use adds another layer. Synthetic fertilizer runoff contributes to nitrous oxide emissions, and nitrous oxide has a warming potential about 265 times higher than CO2 [1]. That makes it more than a field-level issue. It can become a compliance issue too.
Soil health usually slips in a quieter way. The damage does not always show up in one harvest, but over time it can drag down productivity and increase fertilizer demand.
Risk Category | Business Impacts | Mitigation Options | Tradeoffs |
|---|---|---|---|
Climate (Drought/Heat) | Yield loss, crop failure, higher premiums | Drought-resistant crops, precision irrigation | High upfront technology costs; potential initial yield dips |
Water Scarcity/Quality | Stranded assets, regulatory fines for runoff | Drip irrigation, buffer strips, nutrient management | Significant capital spending; reduced planted acreage |
Soil Erosion/Health | Long-term productivity decline, higher fertilizer needs | No-till farming, cover cropping | Transition period may bring yield dips [1] |
GHG Emissions | Carbon costs, financing risk | Feed additives, manure management, precision fertilizer | Complex data tracking; specialized expertise required |
These operating pressures rarely stay confined to land and inputs. They often spill over into labor planning, supplier reliability, and day-to-day execution.
Social Risks: Labor, Human Rights, and Community Impacts
The main social pressure points are familiar but easy to underestimate: worker health and safety, pay, housing conditions, and grievance systems. This is often more acute in operations that rely on seasonal and migrant labor. High turnover, use of unvetted labor brokers, and weak safety records are not small admin issues. They are warning lights.
Some of the most serious labor-abuse risk sits deeper in the supply chain, where visibility is lowest [3]. That is where things can go wrong without much notice until a buyer, regulator, or journalist starts asking questions.
Community impact matters too. Odor complaints, truck traffic, and changes in the water table can sour local support fast. When that happens, the fallout may include protests, media heat, or litigation that interrupts operations.
Risk Category | Indicators | Warning Signs | Management Response |
|---|---|---|---|
Labor Rights | Wage levels, housing quality, contract transparency | High turnover, use of unvetted labor brokers | Formalize contracts, provide healthcare access, audit labor providers |
Worker Safety | Injury rates, heat stress incidents, training hours | Frequent accidents, lack of PPE, poor safety documentation | Implement safety protocols, automate hazardous tasks, regular training |
Community Impact | Water table levels, odor complaints, traffic volume | Local protests, negative media coverage, litigation | Community engagement programs, improved waste management |
Human Rights | Presence of forced/child labor in deep tiers | Lack of visibility beyond Tier 1, sourcing from high-risk regions | Traceability platforms, geolocation data, supplier capacity building |
Managing risk at this level comes down to oversight, controls, and steady reporting habits. Good intentions do not count for much if the operation cannot show what is happening on the ground.
Governance Risks: Oversight, Transparency, and Accountability
Governance risk is often the reason environmental and social problems stay hidden or linger too long. Weak oversight, poor data controls, loose supplier standards, and uneven reporting create a gap between what a company says and what happens in the field.
That gap can affect access to capital, green financing eligibility, and exposure to regulatory action. The shift in regulation is plain: disclosure alone is no longer enough. Companies are being pushed toward due diligence, which means they must spot risks, respond to them, and track the results.
Strong governance is not just a shield against downside. It is what gives ESG claims weight with investors, lenders, regulators, and buyers. Without that backbone, even well-meaning environmental and social programs lack the accountability needed to produce measurable results.
These risks lead straight into the frameworks and reporting rules used to assess them.
Frameworks, Standards, and Compliance Drivers
Frameworks turn the risks above into something you can track, manage, and report. They help organizations move from broad concern to specific metrics, controls, and disclosure.
Key Frameworks for Agricultural ESG Analysis
Agricultural ESG risks only become useful in practice when they are mapped to the right framework. No single framework covers the whole field, so most organizations use a mix. The right choice depends on who needs the information and what decision is on the table.
SASB Agriculture & Forestry standards are built around financial materiality. They focus on the ESG issues most likely to affect cash flow and valuation, including water management, soil health, GHG emissions, pesticide use, and labor practices. The metrics are quantitative and comparable, covering Scope 1 emissions, water use, soil health, pesticide use, and labor data. [6] That makes SASB a strong fit when the main audience is investors or lenders looking at farms, processors, and agribusinesses and wanting data they can compare across companies.
IFC Environmental and Social Performance Standards take a different route. They set minimum requirements across eight areas and are often used in project finance and development investment, including agriculture and agribusiness. [7][10] Performance Standard 6 matters a great deal in agriculture because it focuses on biodiversity conservation and the sustainable management of living natural resources, with different requirements tied to different habitat types. It also calls for attention to ecosystem services such as pollination and water filtration. [10] If a company is pursuing financing for a processing facility, an irrigation project, or a large-scale land investment, IFC standards often shape the due diligence review.
TCFD and TNFD deal with future climate and nature exposure. TCFD structures climate risk analysis around four pillars: governance, strategy, risk management, and metrics and targets. It asks organizations to assess physical risks like drought and flooding, along with transition risks such as carbon pricing and changing demand. [8] TNFD extends that logic to nature-related risk through its LEAP framework - Locate, Evaluate, Assess, Prepare - and food and agriculture guidance that points to water availability and biodiversity. [4]
These frameworks do not sit on their own. They connect directly with federal, state, lender, and buyer demands.
Framework | Scope | Primary Use Case | Key Strengths | Limitations | Application in Agriculture |
|---|---|---|---|---|---|
SASB Agriculture & Forestry | Industry-specific, financially material ESG topics | Investor disclosure and benchmarking | Quantitative, comparable metrics; investor-ready | Narrower stakeholder scope | Water, soil, GHG, pesticide, and labor metrics for farms and agribusinesses |
Eight environmental and social areas including biodiversity, labor, and community impacts | Project finance due diligence | Broad operational controls; widely recognized by lenders | Primarily designed for project finance contexts | Processing facilities, irrigation projects, large-scale land investments | |
TCFD / TNFD | Cross-sector climate- and nature-related risk frameworks | Forward-looking risk analysis and investor disclosure | Scenario-based thinking; connects climate and nature to capital planning | Requires heavy data and modeling; adoption is still uneven in U.S. agriculture | Yield risk, supply chain stress-testing, and water scarcity mapping for agrifood companies |
U.S. Policy and Reporting Considerations
The U.S. regulatory setting for agricultural ESG is fragmented. Federal rules under the Clean Water Act, Clean Air Act, and Resource Conservation and Recovery Act set baseline standards for nutrient management, air emissions, and waste handling, especially for large concentrated animal feeding operations (CAFOs). But federal law does not tell the whole story.
A lot of the sharper exposure sits at the state and regional level. California's Sustainable Groundwater Management Act (SGMA) requires Groundwater Sustainability Agencies to create plans that achieve sustainable pumping over a 20-year period, with limits meant to avoid chronic groundwater-level declines and degraded water quality. [11] For farms in affected basins, that creates direct constraints on water use. Colorado River allocation disputes add still more uncertainty for operations across the Southwest. In the Midwest, state nutrient management rules can directly shape fertilizer application rates per acre and require runoff controls that affect operating costs.
Investor and lender pressure is also building, even where formal mandates have not arrived. Sustainability-focused lenders are more often asking for proof of environmental compliance and better operating practices, such as participation in conservation programs or independent certification, as part of agricultural loan underwriting. [5] The SEC's climate-related disclosure rules require certain public companies to report climate risks, governance processes, and emissions in a standardized, audit-ready format. That pushes agrifood firms with U.S. listings to a higher reporting bar. [9]
In practice, U.S. agriculture faces layered ESG demands: federal rules set the floor, state water and land-use rules add place-based limits, and lenders and buyers often push expectations higher through disclosure and mitigation planning.
Next, apply these standards through a structured assessment process.
How to Conduct ESG Risk Analysis in Agriculture
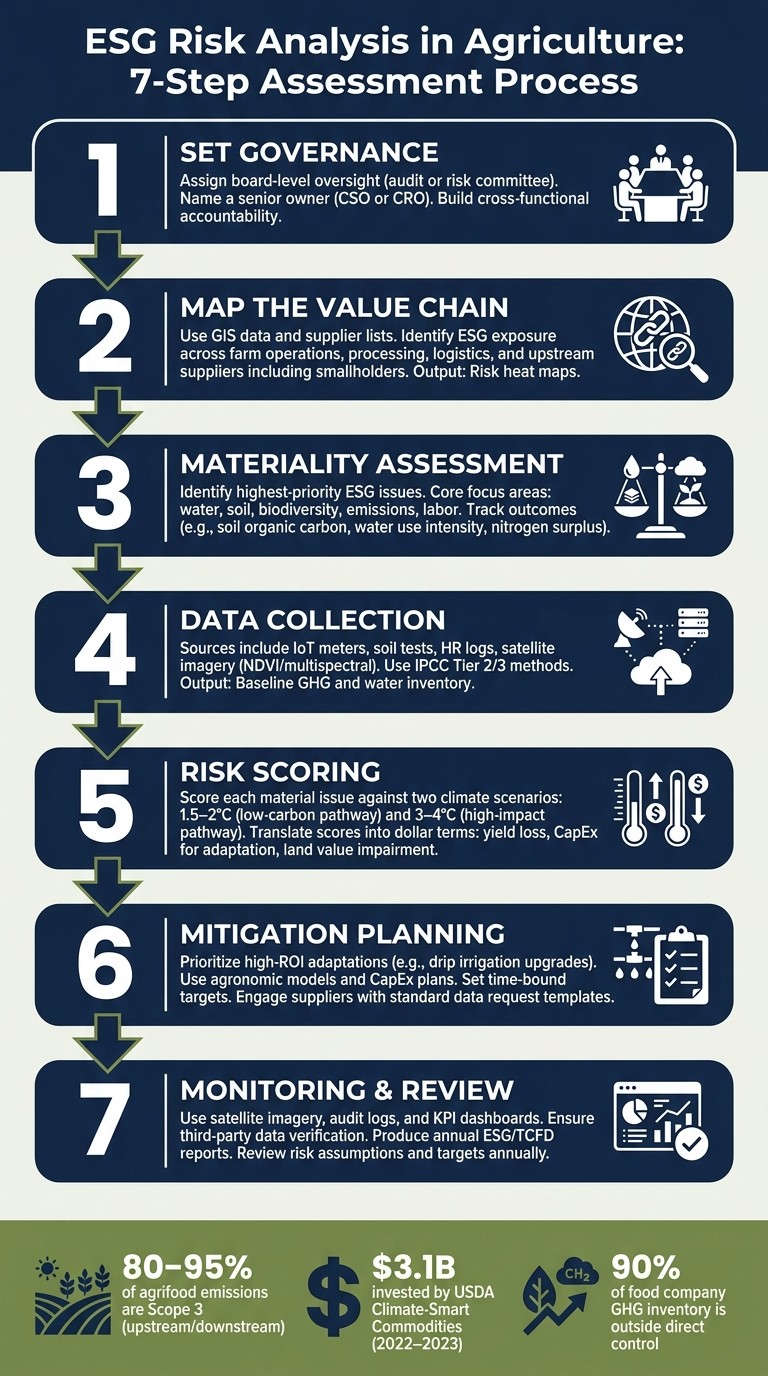
ESG Risk Analysis in Agriculture: 7-Step Assessment Process
With the frameworks in place, the next move is to turn them into a repeatable process that measures actual agricultural exposure.
A Step-by-Step Assessment Process
A sound ESG risk program needs a clear order of operations. Start with governance. Assign formal oversight to a board-level committee, usually audit or risk, and name a senior owner such as a Chief Sustainability Officer or Chief Risk Officer.
Then map the full value chain. Pinpoint every place where ESG exposure is concentrated: your own farm operations, processing sites, logistics partners, and upstream suppliers, including smallholder growers [13].
After that, run a materiality assessment to identify which ESG issues matter most for your business. For most agricultural operations, the core issues are water, soil, biodiversity, emissions, and labor. Focus on outcomes, not just whether a practice exists on paper. That means tracking changes in soil organic carbon, water use intensity, and nitrogen surplus [12].
Next comes risk scoring and mitigation ranking. Score each material issue against at least two climate scenarios: a low-carbon pathway of 1.5–2°C and a high-impact climate pathway of 3–4°C [13]. Then translate those scores into dollar terms. Estimate yield loss under drought, capital costs for adaptation such as drip irrigation, and possible land value impairment. Once risks are expressed in dollars, they can shape budget choices in a way leadership can act on [13].
That set of priorities tells you what data to gather next.
Data, Tools, and Monitoring Systems
Strong ESG analysis starts with dependable data from the field, suppliers, and labor systems. Add supplier inputs for Scope 3 emissions and stakeholder feedback so the social side is covered too.
For many operations, precision agriculture tools are the most practical place to begin. GPS-guided variable-rate application equipment and soil moisture sensors can produce detailed data for sustainability reporting [2]. Satellite imagery, especially NDVI and multispectral data, can track crop vigor and habitat change across large acreages without constant field visits [12]. The USDA's Climate-Smart Commodities program invested $3.1 billion across more than 140 projects in 2022–2023, including supply chain programs led by ADM and Cargill to quantify and verify the GHG benefits of sustainable practices [1].
Once the process is mapped out, connect each step to the smallest data set that can still support good decisions. The table below shows the minimum data and tool mix for each stage.
Process Step | Data Sources | Tool Types | Key Outputs | Implementation Notes |
|---|---|---|---|---|
Set Governance | Board charters, ERM registers | ESG dashboards, risk registers | Accountability matrix | Assign board oversight. |
Map Value Chain | Supplier lists, GIS data | Traceability software | Risk heat maps | Include indirect suppliers. |
Materiality Assessment | Stakeholder surveys, GHG inventory, water stress maps | Carbon accounting software, double materiality tools | Material issue list | Align with the frameworks above. |
Data Collection | IoT meters, soil tests, HR logs, satellite imagery | Precision ag tools, remote sensing | Baseline GHG and water inventory | |
Risk Scoring | Climate models (IPCC/IEA), yield variability data | Scenario analysis software, ERM systems | Financial impact estimates | Model 1.5°C vs. 4°C pathways [13]. |
Mitigation Planning | Agronomic models, CapEx plans, input records | Management systems | Time-bound targets | Prioritize high-ROI adaptations such as irrigation upgrades [13]. |
Monitoring & Review | Satellite imagery, audit logs, KPI dashboards | ESG data platforms, reporting tools | Annual ESG/TCFD reports | Ensure third-party verification of data [12]. |
Turning Analysis Into Mitigation and Investment Decisions
Risk scores matter only if they change decisions. The clearest example is farm and facility capital planning. Any new investment in irrigation systems or land acquisition should pass through a formal climate risk screen that tests projected yield loss and land value impairment under stress scenarios [13]. If drip irrigation cuts water use intensity and reduces physical risk exposure, that effect should sit in the investment case right next to yield and cost projections.
Supplier engagement is the other big lever. Supplier programs are central to emissions target work. Use standard data request templates, and when smaller suppliers do not have the staff or systems to respond, offer support or training instead of pushing them out [2].
Board reporting should also reflect the risk scoring process. Set clear escalation thresholds ahead of time. For example, define what level of projected yield loss or other material ESG risk requires board-level review [13]. That kind of discipline keeps ESG risk tied to actual decisions and turns it into a live input for resource allocation and priority setting.
Those choices become the base of a long-term ESG risk program.
Building a Long-Term ESG Risk Strategy
A single assessment is just the starting line. After risk scoring and mitigation planning, the next move is to make ESG part of day-to-day management. The aim is simple: build ESG risk analysis into routine choices about capital, suppliers, and reporting.
Creating an Organization-Wide ESG Risk Program
A durable ESG risk program starts with clear ownership. In practice, that means adding ESG items to your company’s Enterprise Risk Management (ERM) register and setting materiality thresholds that trigger board-level escalation. Board oversight should be formal, with a senior owner in place and shared responsibility across finance, risk, operations, and sustainability. Cross-functional working groups help keep that ownership spread across the business instead of leaving it with one team.
Once governance is set, supplier data becomes the main place where execution either works or falls apart. Scope 3 emissions make supplier engagement, standard data requests, and traceability tools a must. For food companies, emissions outside direct company control account for roughly 90% of their total greenhouse gas inventory [14].
Targets also need to be measurable and time-bound. Risk assumptions and targets should be reviewed each year [13].
Key Takeaways for Agriculture Leaders
With ESG built into governance and supplier systems, the next step is steady review and reporting. Agriculture carries material ESG risk across climate, water, labor, and governance. The strongest programs build ESG into ERM, capital planning, and supplier management, then track progress with TCFD, TNFD, and SASB.
FAQs
How do I start ESG risk analysis on a farm?
Start with a materiality assessment to pinpoint the ESG issues that matter most to your farm. That may include water use, carbon intensity, labor standards, and supply chain traceability. The goal is simple: figure out where the biggest risks and pressure points sit before you start measuring everything under the sun.
From there, map your supply chain and build a baseline for Scope 1 and Scope 2 emissions. At the same time, assess whether Scope 3 tracking is practical for your operation. For some farms, that step is within reach. For others, it can be a heavy lift, so it makes sense to judge feasibility early.
Next, bring those findings into your enterprise risk management process. Set materiality thresholds, and screen capital spending for climate-related risks so major investments are judged with the same discipline as other business decisions. Digital tools can also help tighten data accuracy, which matters when you're trying to track progress without getting lost in messy spreadsheets.
Which ESG framework fits agriculture best?
No single framework works for every agriculture business. The sector is messy by nature, with different crops, regions, labor models, and supply chains creating very different reporting needs. That’s why most organizations don’t rely on just one standard. They usually combine mandatory reporting with specialized voluntary standards to deal with agriculture’s environmental and social issues in a more practical way.
Common choices include the OECD-FAO Guidance for supply chain due diligence, the GHG Protocol for emissions, the TNFD’s LEAP approach for nature-related risks, and the RAI Tool for supply chain sustainability. Put simply, companies often need a mix-and-match approach rather than a one-size-fits-all playbook. Council Fire can help organizations sort through these requirements and choose a path that fits their goals and reporting duties.
What data matters most for agricultural ESG risk?
Effective analysis starts with granular, farm-level data. Without that level of detail, it’s hard to see what’s working, what’s slipping, and where action should go first.
The most useful indicators tend to fall into two groups:
Environmental: water-use efficiency, soil health, greenhouse gas emissions, energy use, and biodiversity
Social: worker safety, injury rates, and labor compliance
To gather this data with more precision, many organizations use precision agriculture, satellite imagery, and environmental monitoring. These tools help teams collect accurate information and improve supply chain transparency.
Related Blog Posts
Latest Articles
©2025

Narrative Change and Power Building: The Missing Half of Advocacy
Narrative change is the process of disrupting dominant narratives that normalize inequity and advancing new narratives from historically marginalized communities.

Funding Resilience Without Federal Grants
BRIC is unreliable and FEMA is shrinking. Here's how cities fund climate resilience with dedicated revenue, blended finance, and a coordinating authority.

The ESG Blind Spot: How AI Is Finding Risks in Companies Nobody Else Is Watching
Norway's sovereign wealth fund uses AI to screen 7,200 portfolio companies for forced labor and corruption within 24 hours. The real story is the emerging-market coverage gap that traditional ESG data vendors miss — and what it means for any company with a global supply chain.
Narrative Change and Power Building: The Missing Half of Advocacy
Narrative change is the process of disrupting dominant narratives that normalize inequity and advancing new narratives from historically marginalized communities.
Funding Resilience Without Federal Grants
BRIC is unreliable and FEMA is shrinking. Here's how cities fund climate resilience with dedicated revenue, blended finance, and a coordinating authority.
The ESG Blind Spot: How AI Is Finding Risks in Companies Nobody Else Is Watching
Norway's sovereign wealth fund uses AI to screen 7,200 portfolio companies for forced labor and corruption within 24 hours. The real story is the emerging-market coverage gap that traditional ESG data vendors miss — and what it means for any company with a global supply chain.
FAQ
01
What does it really mean to “redefine profit”?
02
What makes Council Fire different?
03
Who does Council Fire work with?
04
What does working with Council Fire actually look like?
05
How does Council Fire help organizations turn big goals into action?
06
How does Council Fire define and measure success?
Jun 29, 2026
Ultimate Guide to ESG Risk Analysis in Agriculture
ESG Strategy
In This Article
ESG risk in agriculture must link field data, supplier oversight, and governance to money, reporting, and capital decisions.
Ultimate Guide to ESG Risk Analysis in Agriculture
Agriculture faces ESG risk from every angle: water, weather, labor, supply chains, and board oversight. In the U.S., this matters because a farm issue can turn into a processor cost problem, a lender credit problem, or a reporting problem for a public company.
If I had to boil this article down, I’d say this:
Start with the risks that hit cash flow first: drought, water limits, soil loss, worker safety, and weak supplier controls.
Use the right frameworks for the job:SASB for investor-facing metrics, IFC standards for project finance reviews, and TCFD/TNFD for climate and nature risk.
Build the process in order: assign oversight, map the value chain, score risk, collect field and supplier data, and tie results to spending decisions.
Focus on proof, not promises: farm-level data, labor records, satellite data, and Scope 3 inputs matter because upstream and downstream emissions can make up 80%–95% of an agrifood company’s footprint.
Treat ESG as a business risk system: not a side report, but part of capital planning, supplier review, and board reporting.
A few numbers frame the issue fast:
U.S. agriculture is a $400+ billion industry.
Agriculture produces about 10%–12% of global greenhouse gas emissions directly, or about 22% with land-use change.
Farming uses about 70% of global freshwater withdrawals.
For many food companies, emissions outside direct control account for about 90% of total greenhouse gas inventory.
Bottom line: if you want ESG risk analysis in agriculture to work, you need a simple system that links field conditions, supplier data, and governance to money, risk, and reporting.
Are you ESG ready? | What is ESG?
Core ESG Risks Across Agricultural Value Chains
Agricultural ESG risk tends to land in three groups: environmental, social, and governance. On paper, that sounds neat and tidy. In practice, these risks show up all along the value chain, from the farm gate to processors, lenders, and buyers. A problem in one part of the chain can spill into the rest through supply disruption, cost swings, and reporting pressure.
Environmental Risks: Climate, Water, Soil, and Inputs
Climate swings can hit hard and fast. One bad season can cut yields and push insurance costs up at the same time. In the 2023 crop year, drought across the Southern Plains and flooding in California's Central Valley caused significant yield reductions and increased price volatility across multiple commodity markets [1].
Water risk is just as serious, especially in places where irrigation is doing the heavy lifting. In water-stressed regions, that dependence can turn into both regulatory risk and asset risk. Fertilizer use adds another layer. Synthetic fertilizer runoff contributes to nitrous oxide emissions, and nitrous oxide has a warming potential about 265 times higher than CO2 [1]. That makes it more than a field-level issue. It can become a compliance issue too.
Soil health usually slips in a quieter way. The damage does not always show up in one harvest, but over time it can drag down productivity and increase fertilizer demand.
Risk Category | Business Impacts | Mitigation Options | Tradeoffs |
|---|---|---|---|
Climate (Drought/Heat) | Yield loss, crop failure, higher premiums | Drought-resistant crops, precision irrigation | High upfront technology costs; potential initial yield dips |
Water Scarcity/Quality | Stranded assets, regulatory fines for runoff | Drip irrigation, buffer strips, nutrient management | Significant capital spending; reduced planted acreage |
Soil Erosion/Health | Long-term productivity decline, higher fertilizer needs | No-till farming, cover cropping | Transition period may bring yield dips [1] |
GHG Emissions | Carbon costs, financing risk | Feed additives, manure management, precision fertilizer | Complex data tracking; specialized expertise required |
These operating pressures rarely stay confined to land and inputs. They often spill over into labor planning, supplier reliability, and day-to-day execution.
Social Risks: Labor, Human Rights, and Community Impacts
The main social pressure points are familiar but easy to underestimate: worker health and safety, pay, housing conditions, and grievance systems. This is often more acute in operations that rely on seasonal and migrant labor. High turnover, use of unvetted labor brokers, and weak safety records are not small admin issues. They are warning lights.
Some of the most serious labor-abuse risk sits deeper in the supply chain, where visibility is lowest [3]. That is where things can go wrong without much notice until a buyer, regulator, or journalist starts asking questions.
Community impact matters too. Odor complaints, truck traffic, and changes in the water table can sour local support fast. When that happens, the fallout may include protests, media heat, or litigation that interrupts operations.
Risk Category | Indicators | Warning Signs | Management Response |
|---|---|---|---|
Labor Rights | Wage levels, housing quality, contract transparency | High turnover, use of unvetted labor brokers | Formalize contracts, provide healthcare access, audit labor providers |
Worker Safety | Injury rates, heat stress incidents, training hours | Frequent accidents, lack of PPE, poor safety documentation | Implement safety protocols, automate hazardous tasks, regular training |
Community Impact | Water table levels, odor complaints, traffic volume | Local protests, negative media coverage, litigation | Community engagement programs, improved waste management |
Human Rights | Presence of forced/child labor in deep tiers | Lack of visibility beyond Tier 1, sourcing from high-risk regions | Traceability platforms, geolocation data, supplier capacity building |
Managing risk at this level comes down to oversight, controls, and steady reporting habits. Good intentions do not count for much if the operation cannot show what is happening on the ground.
Governance Risks: Oversight, Transparency, and Accountability
Governance risk is often the reason environmental and social problems stay hidden or linger too long. Weak oversight, poor data controls, loose supplier standards, and uneven reporting create a gap between what a company says and what happens in the field.
That gap can affect access to capital, green financing eligibility, and exposure to regulatory action. The shift in regulation is plain: disclosure alone is no longer enough. Companies are being pushed toward due diligence, which means they must spot risks, respond to them, and track the results.
Strong governance is not just a shield against downside. It is what gives ESG claims weight with investors, lenders, regulators, and buyers. Without that backbone, even well-meaning environmental and social programs lack the accountability needed to produce measurable results.
These risks lead straight into the frameworks and reporting rules used to assess them.
Frameworks, Standards, and Compliance Drivers
Frameworks turn the risks above into something you can track, manage, and report. They help organizations move from broad concern to specific metrics, controls, and disclosure.
Key Frameworks for Agricultural ESG Analysis
Agricultural ESG risks only become useful in practice when they are mapped to the right framework. No single framework covers the whole field, so most organizations use a mix. The right choice depends on who needs the information and what decision is on the table.
SASB Agriculture & Forestry standards are built around financial materiality. They focus on the ESG issues most likely to affect cash flow and valuation, including water management, soil health, GHG emissions, pesticide use, and labor practices. The metrics are quantitative and comparable, covering Scope 1 emissions, water use, soil health, pesticide use, and labor data. [6] That makes SASB a strong fit when the main audience is investors or lenders looking at farms, processors, and agribusinesses and wanting data they can compare across companies.
IFC Environmental and Social Performance Standards take a different route. They set minimum requirements across eight areas and are often used in project finance and development investment, including agriculture and agribusiness. [7][10] Performance Standard 6 matters a great deal in agriculture because it focuses on biodiversity conservation and the sustainable management of living natural resources, with different requirements tied to different habitat types. It also calls for attention to ecosystem services such as pollination and water filtration. [10] If a company is pursuing financing for a processing facility, an irrigation project, or a large-scale land investment, IFC standards often shape the due diligence review.
TCFD and TNFD deal with future climate and nature exposure. TCFD structures climate risk analysis around four pillars: governance, strategy, risk management, and metrics and targets. It asks organizations to assess physical risks like drought and flooding, along with transition risks such as carbon pricing and changing demand. [8] TNFD extends that logic to nature-related risk through its LEAP framework - Locate, Evaluate, Assess, Prepare - and food and agriculture guidance that points to water availability and biodiversity. [4]
These frameworks do not sit on their own. They connect directly with federal, state, lender, and buyer demands.
Framework | Scope | Primary Use Case | Key Strengths | Limitations | Application in Agriculture |
|---|---|---|---|---|---|
SASB Agriculture & Forestry | Industry-specific, financially material ESG topics | Investor disclosure and benchmarking | Quantitative, comparable metrics; investor-ready | Narrower stakeholder scope | Water, soil, GHG, pesticide, and labor metrics for farms and agribusinesses |
Eight environmental and social areas including biodiversity, labor, and community impacts | Project finance due diligence | Broad operational controls; widely recognized by lenders | Primarily designed for project finance contexts | Processing facilities, irrigation projects, large-scale land investments | |
TCFD / TNFD | Cross-sector climate- and nature-related risk frameworks | Forward-looking risk analysis and investor disclosure | Scenario-based thinking; connects climate and nature to capital planning | Requires heavy data and modeling; adoption is still uneven in U.S. agriculture | Yield risk, supply chain stress-testing, and water scarcity mapping for agrifood companies |
U.S. Policy and Reporting Considerations
The U.S. regulatory setting for agricultural ESG is fragmented. Federal rules under the Clean Water Act, Clean Air Act, and Resource Conservation and Recovery Act set baseline standards for nutrient management, air emissions, and waste handling, especially for large concentrated animal feeding operations (CAFOs). But federal law does not tell the whole story.
A lot of the sharper exposure sits at the state and regional level. California's Sustainable Groundwater Management Act (SGMA) requires Groundwater Sustainability Agencies to create plans that achieve sustainable pumping over a 20-year period, with limits meant to avoid chronic groundwater-level declines and degraded water quality. [11] For farms in affected basins, that creates direct constraints on water use. Colorado River allocation disputes add still more uncertainty for operations across the Southwest. In the Midwest, state nutrient management rules can directly shape fertilizer application rates per acre and require runoff controls that affect operating costs.
Investor and lender pressure is also building, even where formal mandates have not arrived. Sustainability-focused lenders are more often asking for proof of environmental compliance and better operating practices, such as participation in conservation programs or independent certification, as part of agricultural loan underwriting. [5] The SEC's climate-related disclosure rules require certain public companies to report climate risks, governance processes, and emissions in a standardized, audit-ready format. That pushes agrifood firms with U.S. listings to a higher reporting bar. [9]
In practice, U.S. agriculture faces layered ESG demands: federal rules set the floor, state water and land-use rules add place-based limits, and lenders and buyers often push expectations higher through disclosure and mitigation planning.
Next, apply these standards through a structured assessment process.
How to Conduct ESG Risk Analysis in Agriculture
ESG Risk Analysis in Agriculture: 7-Step Assessment Process
With the frameworks in place, the next move is to turn them into a repeatable process that measures actual agricultural exposure.
A Step-by-Step Assessment Process
A sound ESG risk program needs a clear order of operations. Start with governance. Assign formal oversight to a board-level committee, usually audit or risk, and name a senior owner such as a Chief Sustainability Officer or Chief Risk Officer.
Then map the full value chain. Pinpoint every place where ESG exposure is concentrated: your own farm operations, processing sites, logistics partners, and upstream suppliers, including smallholder growers [13].
After that, run a materiality assessment to identify which ESG issues matter most for your business. For most agricultural operations, the core issues are water, soil, biodiversity, emissions, and labor. Focus on outcomes, not just whether a practice exists on paper. That means tracking changes in soil organic carbon, water use intensity, and nitrogen surplus [12].
Next comes risk scoring and mitigation ranking. Score each material issue against at least two climate scenarios: a low-carbon pathway of 1.5–2°C and a high-impact climate pathway of 3–4°C [13]. Then translate those scores into dollar terms. Estimate yield loss under drought, capital costs for adaptation such as drip irrigation, and possible land value impairment. Once risks are expressed in dollars, they can shape budget choices in a way leadership can act on [13].
That set of priorities tells you what data to gather next.
Data, Tools, and Monitoring Systems
Strong ESG analysis starts with dependable data from the field, suppliers, and labor systems. Add supplier inputs for Scope 3 emissions and stakeholder feedback so the social side is covered too.
For many operations, precision agriculture tools are the most practical place to begin. GPS-guided variable-rate application equipment and soil moisture sensors can produce detailed data for sustainability reporting [2]. Satellite imagery, especially NDVI and multispectral data, can track crop vigor and habitat change across large acreages without constant field visits [12]. The USDA's Climate-Smart Commodities program invested $3.1 billion across more than 140 projects in 2022–2023, including supply chain programs led by ADM and Cargill to quantify and verify the GHG benefits of sustainable practices [1].
Once the process is mapped out, connect each step to the smallest data set that can still support good decisions. The table below shows the minimum data and tool mix for each stage.
Process Step | Data Sources | Tool Types | Key Outputs | Implementation Notes |
|---|---|---|---|---|
Set Governance | Board charters, ERM registers | ESG dashboards, risk registers | Accountability matrix | Assign board oversight. |
Map Value Chain | Supplier lists, GIS data | Traceability software | Risk heat maps | Include indirect suppliers. |
Materiality Assessment | Stakeholder surveys, GHG inventory, water stress maps | Carbon accounting software, double materiality tools | Material issue list | Align with the frameworks above. |
Data Collection | IoT meters, soil tests, HR logs, satellite imagery | Precision ag tools, remote sensing | Baseline GHG and water inventory | |
Risk Scoring | Climate models (IPCC/IEA), yield variability data | Scenario analysis software, ERM systems | Financial impact estimates | Model 1.5°C vs. 4°C pathways [13]. |
Mitigation Planning | Agronomic models, CapEx plans, input records | Management systems | Time-bound targets | Prioritize high-ROI adaptations such as irrigation upgrades [13]. |
Monitoring & Review | Satellite imagery, audit logs, KPI dashboards | ESG data platforms, reporting tools | Annual ESG/TCFD reports | Ensure third-party verification of data [12]. |
Turning Analysis Into Mitigation and Investment Decisions
Risk scores matter only if they change decisions. The clearest example is farm and facility capital planning. Any new investment in irrigation systems or land acquisition should pass through a formal climate risk screen that tests projected yield loss and land value impairment under stress scenarios [13]. If drip irrigation cuts water use intensity and reduces physical risk exposure, that effect should sit in the investment case right next to yield and cost projections.
Supplier engagement is the other big lever. Supplier programs are central to emissions target work. Use standard data request templates, and when smaller suppliers do not have the staff or systems to respond, offer support or training instead of pushing them out [2].
Board reporting should also reflect the risk scoring process. Set clear escalation thresholds ahead of time. For example, define what level of projected yield loss or other material ESG risk requires board-level review [13]. That kind of discipline keeps ESG risk tied to actual decisions and turns it into a live input for resource allocation and priority setting.
Those choices become the base of a long-term ESG risk program.
Building a Long-Term ESG Risk Strategy
A single assessment is just the starting line. After risk scoring and mitigation planning, the next move is to make ESG part of day-to-day management. The aim is simple: build ESG risk analysis into routine choices about capital, suppliers, and reporting.
Creating an Organization-Wide ESG Risk Program
A durable ESG risk program starts with clear ownership. In practice, that means adding ESG items to your company’s Enterprise Risk Management (ERM) register and setting materiality thresholds that trigger board-level escalation. Board oversight should be formal, with a senior owner in place and shared responsibility across finance, risk, operations, and sustainability. Cross-functional working groups help keep that ownership spread across the business instead of leaving it with one team.
Once governance is set, supplier data becomes the main place where execution either works or falls apart. Scope 3 emissions make supplier engagement, standard data requests, and traceability tools a must. For food companies, emissions outside direct company control account for roughly 90% of their total greenhouse gas inventory [14].
Targets also need to be measurable and time-bound. Risk assumptions and targets should be reviewed each year [13].
Key Takeaways for Agriculture Leaders
With ESG built into governance and supplier systems, the next step is steady review and reporting. Agriculture carries material ESG risk across climate, water, labor, and governance. The strongest programs build ESG into ERM, capital planning, and supplier management, then track progress with TCFD, TNFD, and SASB.
FAQs
How do I start ESG risk analysis on a farm?
Start with a materiality assessment to pinpoint the ESG issues that matter most to your farm. That may include water use, carbon intensity, labor standards, and supply chain traceability. The goal is simple: figure out where the biggest risks and pressure points sit before you start measuring everything under the sun.
From there, map your supply chain and build a baseline for Scope 1 and Scope 2 emissions. At the same time, assess whether Scope 3 tracking is practical for your operation. For some farms, that step is within reach. For others, it can be a heavy lift, so it makes sense to judge feasibility early.
Next, bring those findings into your enterprise risk management process. Set materiality thresholds, and screen capital spending for climate-related risks so major investments are judged with the same discipline as other business decisions. Digital tools can also help tighten data accuracy, which matters when you're trying to track progress without getting lost in messy spreadsheets.
Which ESG framework fits agriculture best?
No single framework works for every agriculture business. The sector is messy by nature, with different crops, regions, labor models, and supply chains creating very different reporting needs. That’s why most organizations don’t rely on just one standard. They usually combine mandatory reporting with specialized voluntary standards to deal with agriculture’s environmental and social issues in a more practical way.
Common choices include the OECD-FAO Guidance for supply chain due diligence, the GHG Protocol for emissions, the TNFD’s LEAP approach for nature-related risks, and the RAI Tool for supply chain sustainability. Put simply, companies often need a mix-and-match approach rather than a one-size-fits-all playbook. Council Fire can help organizations sort through these requirements and choose a path that fits their goals and reporting duties.
What data matters most for agricultural ESG risk?
Effective analysis starts with granular, farm-level data. Without that level of detail, it’s hard to see what’s working, what’s slipping, and where action should go first.
The most useful indicators tend to fall into two groups:
Environmental: water-use efficiency, soil health, greenhouse gas emissions, energy use, and biodiversity
Social: worker safety, injury rates, and labor compliance
To gather this data with more precision, many organizations use precision agriculture, satellite imagery, and environmental monitoring. These tools help teams collect accurate information and improve supply chain transparency.
Related Blog Posts
Latest Articles
©2025
Narrative Change and Power Building: The Missing Half of Advocacy
Narrative change is the process of disrupting dominant narratives that normalize inequity and advancing new narratives from historically marginalized communities.
Funding Resilience Without Federal Grants
BRIC is unreliable and FEMA is shrinking. Here's how cities fund climate resilience with dedicated revenue, blended finance, and a coordinating authority.
The ESG Blind Spot: How AI Is Finding Risks in Companies Nobody Else Is Watching
Norway's sovereign wealth fund uses AI to screen 7,200 portfolio companies for forced labor and corruption within 24 hours. The real story is the emerging-market coverage gap that traditional ESG data vendors miss — and what it means for any company with a global supply chain.
FAQ
01
What does it really mean to “redefine profit”?
02
What makes Council Fire different?
03
Who does Council Fire work with?
04
What does working with Council Fire actually look like?
05
How does Council Fire help organizations turn big goals into action?
06
How does Council Fire define and measure success?
Jun 29, 2026
Ultimate Guide to ESG Risk Analysis in Agriculture
ESG Strategy
In This Article
ESG risk in agriculture must link field data, supplier oversight, and governance to money, reporting, and capital decisions.
Ultimate Guide to ESG Risk Analysis in Agriculture
Agriculture faces ESG risk from every angle: water, weather, labor, supply chains, and board oversight. In the U.S., this matters because a farm issue can turn into a processor cost problem, a lender credit problem, or a reporting problem for a public company.
If I had to boil this article down, I’d say this:
Start with the risks that hit cash flow first: drought, water limits, soil loss, worker safety, and weak supplier controls.
Use the right frameworks for the job:SASB for investor-facing metrics, IFC standards for project finance reviews, and TCFD/TNFD for climate and nature risk.
Build the process in order: assign oversight, map the value chain, score risk, collect field and supplier data, and tie results to spending decisions.
Focus on proof, not promises: farm-level data, labor records, satellite data, and Scope 3 inputs matter because upstream and downstream emissions can make up 80%–95% of an agrifood company’s footprint.
Treat ESG as a business risk system: not a side report, but part of capital planning, supplier review, and board reporting.
A few numbers frame the issue fast:
U.S. agriculture is a $400+ billion industry.
Agriculture produces about 10%–12% of global greenhouse gas emissions directly, or about 22% with land-use change.
Farming uses about 70% of global freshwater withdrawals.
For many food companies, emissions outside direct control account for about 90% of total greenhouse gas inventory.
Bottom line: if you want ESG risk analysis in agriculture to work, you need a simple system that links field conditions, supplier data, and governance to money, risk, and reporting.
Are you ESG ready? | What is ESG?
Core ESG Risks Across Agricultural Value Chains
Agricultural ESG risk tends to land in three groups: environmental, social, and governance. On paper, that sounds neat and tidy. In practice, these risks show up all along the value chain, from the farm gate to processors, lenders, and buyers. A problem in one part of the chain can spill into the rest through supply disruption, cost swings, and reporting pressure.
Environmental Risks: Climate, Water, Soil, and Inputs
Climate swings can hit hard and fast. One bad season can cut yields and push insurance costs up at the same time. In the 2023 crop year, drought across the Southern Plains and flooding in California's Central Valley caused significant yield reductions and increased price volatility across multiple commodity markets [1].
Water risk is just as serious, especially in places where irrigation is doing the heavy lifting. In water-stressed regions, that dependence can turn into both regulatory risk and asset risk. Fertilizer use adds another layer. Synthetic fertilizer runoff contributes to nitrous oxide emissions, and nitrous oxide has a warming potential about 265 times higher than CO2 [1]. That makes it more than a field-level issue. It can become a compliance issue too.
Soil health usually slips in a quieter way. The damage does not always show up in one harvest, but over time it can drag down productivity and increase fertilizer demand.
Risk Category | Business Impacts | Mitigation Options | Tradeoffs |
|---|---|---|---|
Climate (Drought/Heat) | Yield loss, crop failure, higher premiums | Drought-resistant crops, precision irrigation | High upfront technology costs; potential initial yield dips |
Water Scarcity/Quality | Stranded assets, regulatory fines for runoff | Drip irrigation, buffer strips, nutrient management | Significant capital spending; reduced planted acreage |
Soil Erosion/Health | Long-term productivity decline, higher fertilizer needs | No-till farming, cover cropping | Transition period may bring yield dips [1] |
GHG Emissions | Carbon costs, financing risk | Feed additives, manure management, precision fertilizer | Complex data tracking; specialized expertise required |
These operating pressures rarely stay confined to land and inputs. They often spill over into labor planning, supplier reliability, and day-to-day execution.
Social Risks: Labor, Human Rights, and Community Impacts
The main social pressure points are familiar but easy to underestimate: worker health and safety, pay, housing conditions, and grievance systems. This is often more acute in operations that rely on seasonal and migrant labor. High turnover, use of unvetted labor brokers, and weak safety records are not small admin issues. They are warning lights.
Some of the most serious labor-abuse risk sits deeper in the supply chain, where visibility is lowest [3]. That is where things can go wrong without much notice until a buyer, regulator, or journalist starts asking questions.
Community impact matters too. Odor complaints, truck traffic, and changes in the water table can sour local support fast. When that happens, the fallout may include protests, media heat, or litigation that interrupts operations.
Risk Category | Indicators | Warning Signs | Management Response |
|---|---|---|---|
Labor Rights | Wage levels, housing quality, contract transparency | High turnover, use of unvetted labor brokers | Formalize contracts, provide healthcare access, audit labor providers |
Worker Safety | Injury rates, heat stress incidents, training hours | Frequent accidents, lack of PPE, poor safety documentation | Implement safety protocols, automate hazardous tasks, regular training |
Community Impact | Water table levels, odor complaints, traffic volume | Local protests, negative media coverage, litigation | Community engagement programs, improved waste management |
Human Rights | Presence of forced/child labor in deep tiers | Lack of visibility beyond Tier 1, sourcing from high-risk regions | Traceability platforms, geolocation data, supplier capacity building |
Managing risk at this level comes down to oversight, controls, and steady reporting habits. Good intentions do not count for much if the operation cannot show what is happening on the ground.
Governance Risks: Oversight, Transparency, and Accountability
Governance risk is often the reason environmental and social problems stay hidden or linger too long. Weak oversight, poor data controls, loose supplier standards, and uneven reporting create a gap between what a company says and what happens in the field.
That gap can affect access to capital, green financing eligibility, and exposure to regulatory action. The shift in regulation is plain: disclosure alone is no longer enough. Companies are being pushed toward due diligence, which means they must spot risks, respond to them, and track the results.
Strong governance is not just a shield against downside. It is what gives ESG claims weight with investors, lenders, regulators, and buyers. Without that backbone, even well-meaning environmental and social programs lack the accountability needed to produce measurable results.
These risks lead straight into the frameworks and reporting rules used to assess them.
Frameworks, Standards, and Compliance Drivers
Frameworks turn the risks above into something you can track, manage, and report. They help organizations move from broad concern to specific metrics, controls, and disclosure.
Key Frameworks for Agricultural ESG Analysis
Agricultural ESG risks only become useful in practice when they are mapped to the right framework. No single framework covers the whole field, so most organizations use a mix. The right choice depends on who needs the information and what decision is on the table.
SASB Agriculture & Forestry standards are built around financial materiality. They focus on the ESG issues most likely to affect cash flow and valuation, including water management, soil health, GHG emissions, pesticide use, and labor practices. The metrics are quantitative and comparable, covering Scope 1 emissions, water use, soil health, pesticide use, and labor data. [6] That makes SASB a strong fit when the main audience is investors or lenders looking at farms, processors, and agribusinesses and wanting data they can compare across companies.
IFC Environmental and Social Performance Standards take a different route. They set minimum requirements across eight areas and are often used in project finance and development investment, including agriculture and agribusiness. [7][10] Performance Standard 6 matters a great deal in agriculture because it focuses on biodiversity conservation and the sustainable management of living natural resources, with different requirements tied to different habitat types. It also calls for attention to ecosystem services such as pollination and water filtration. [10] If a company is pursuing financing for a processing facility, an irrigation project, or a large-scale land investment, IFC standards often shape the due diligence review.
TCFD and TNFD deal with future climate and nature exposure. TCFD structures climate risk analysis around four pillars: governance, strategy, risk management, and metrics and targets. It asks organizations to assess physical risks like drought and flooding, along with transition risks such as carbon pricing and changing demand. [8] TNFD extends that logic to nature-related risk through its LEAP framework - Locate, Evaluate, Assess, Prepare - and food and agriculture guidance that points to water availability and biodiversity. [4]
These frameworks do not sit on their own. They connect directly with federal, state, lender, and buyer demands.
Framework | Scope | Primary Use Case | Key Strengths | Limitations | Application in Agriculture |
|---|---|---|---|---|---|
SASB Agriculture & Forestry | Industry-specific, financially material ESG topics | Investor disclosure and benchmarking | Quantitative, comparable metrics; investor-ready | Narrower stakeholder scope | Water, soil, GHG, pesticide, and labor metrics for farms and agribusinesses |
Eight environmental and social areas including biodiversity, labor, and community impacts | Project finance due diligence | Broad operational controls; widely recognized by lenders | Primarily designed for project finance contexts | Processing facilities, irrigation projects, large-scale land investments | |
TCFD / TNFD | Cross-sector climate- and nature-related risk frameworks | Forward-looking risk analysis and investor disclosure | Scenario-based thinking; connects climate and nature to capital planning | Requires heavy data and modeling; adoption is still uneven in U.S. agriculture | Yield risk, supply chain stress-testing, and water scarcity mapping for agrifood companies |
U.S. Policy and Reporting Considerations
The U.S. regulatory setting for agricultural ESG is fragmented. Federal rules under the Clean Water Act, Clean Air Act, and Resource Conservation and Recovery Act set baseline standards for nutrient management, air emissions, and waste handling, especially for large concentrated animal feeding operations (CAFOs). But federal law does not tell the whole story.
A lot of the sharper exposure sits at the state and regional level. California's Sustainable Groundwater Management Act (SGMA) requires Groundwater Sustainability Agencies to create plans that achieve sustainable pumping over a 20-year period, with limits meant to avoid chronic groundwater-level declines and degraded water quality. [11] For farms in affected basins, that creates direct constraints on water use. Colorado River allocation disputes add still more uncertainty for operations across the Southwest. In the Midwest, state nutrient management rules can directly shape fertilizer application rates per acre and require runoff controls that affect operating costs.
Investor and lender pressure is also building, even where formal mandates have not arrived. Sustainability-focused lenders are more often asking for proof of environmental compliance and better operating practices, such as participation in conservation programs or independent certification, as part of agricultural loan underwriting. [5] The SEC's climate-related disclosure rules require certain public companies to report climate risks, governance processes, and emissions in a standardized, audit-ready format. That pushes agrifood firms with U.S. listings to a higher reporting bar. [9]
In practice, U.S. agriculture faces layered ESG demands: federal rules set the floor, state water and land-use rules add place-based limits, and lenders and buyers often push expectations higher through disclosure and mitigation planning.
Next, apply these standards through a structured assessment process.
How to Conduct ESG Risk Analysis in Agriculture
ESG Risk Analysis in Agriculture: 7-Step Assessment Process
With the frameworks in place, the next move is to turn them into a repeatable process that measures actual agricultural exposure.
A Step-by-Step Assessment Process
A sound ESG risk program needs a clear order of operations. Start with governance. Assign formal oversight to a board-level committee, usually audit or risk, and name a senior owner such as a Chief Sustainability Officer or Chief Risk Officer.
Then map the full value chain. Pinpoint every place where ESG exposure is concentrated: your own farm operations, processing sites, logistics partners, and upstream suppliers, including smallholder growers [13].
After that, run a materiality assessment to identify which ESG issues matter most for your business. For most agricultural operations, the core issues are water, soil, biodiversity, emissions, and labor. Focus on outcomes, not just whether a practice exists on paper. That means tracking changes in soil organic carbon, water use intensity, and nitrogen surplus [12].
Next comes risk scoring and mitigation ranking. Score each material issue against at least two climate scenarios: a low-carbon pathway of 1.5–2°C and a high-impact climate pathway of 3–4°C [13]. Then translate those scores into dollar terms. Estimate yield loss under drought, capital costs for adaptation such as drip irrigation, and possible land value impairment. Once risks are expressed in dollars, they can shape budget choices in a way leadership can act on [13].
That set of priorities tells you what data to gather next.
Data, Tools, and Monitoring Systems
Strong ESG analysis starts with dependable data from the field, suppliers, and labor systems. Add supplier inputs for Scope 3 emissions and stakeholder feedback so the social side is covered too.
For many operations, precision agriculture tools are the most practical place to begin. GPS-guided variable-rate application equipment and soil moisture sensors can produce detailed data for sustainability reporting [2]. Satellite imagery, especially NDVI and multispectral data, can track crop vigor and habitat change across large acreages without constant field visits [12]. The USDA's Climate-Smart Commodities program invested $3.1 billion across more than 140 projects in 2022–2023, including supply chain programs led by ADM and Cargill to quantify and verify the GHG benefits of sustainable practices [1].
Once the process is mapped out, connect each step to the smallest data set that can still support good decisions. The table below shows the minimum data and tool mix for each stage.
Process Step | Data Sources | Tool Types | Key Outputs | Implementation Notes |
|---|---|---|---|---|
Set Governance | Board charters, ERM registers | ESG dashboards, risk registers | Accountability matrix | Assign board oversight. |
Map Value Chain | Supplier lists, GIS data | Traceability software | Risk heat maps | Include indirect suppliers. |
Materiality Assessment | Stakeholder surveys, GHG inventory, water stress maps | Carbon accounting software, double materiality tools | Material issue list | Align with the frameworks above. |
Data Collection | IoT meters, soil tests, HR logs, satellite imagery | Precision ag tools, remote sensing | Baseline GHG and water inventory | |
Risk Scoring | Climate models (IPCC/IEA), yield variability data | Scenario analysis software, ERM systems | Financial impact estimates | Model 1.5°C vs. 4°C pathways [13]. |
Mitigation Planning | Agronomic models, CapEx plans, input records | Management systems | Time-bound targets | Prioritize high-ROI adaptations such as irrigation upgrades [13]. |
Monitoring & Review | Satellite imagery, audit logs, KPI dashboards | ESG data platforms, reporting tools | Annual ESG/TCFD reports | Ensure third-party verification of data [12]. |
Turning Analysis Into Mitigation and Investment Decisions
Risk scores matter only if they change decisions. The clearest example is farm and facility capital planning. Any new investment in irrigation systems or land acquisition should pass through a formal climate risk screen that tests projected yield loss and land value impairment under stress scenarios [13]. If drip irrigation cuts water use intensity and reduces physical risk exposure, that effect should sit in the investment case right next to yield and cost projections.
Supplier engagement is the other big lever. Supplier programs are central to emissions target work. Use standard data request templates, and when smaller suppliers do not have the staff or systems to respond, offer support or training instead of pushing them out [2].
Board reporting should also reflect the risk scoring process. Set clear escalation thresholds ahead of time. For example, define what level of projected yield loss or other material ESG risk requires board-level review [13]. That kind of discipline keeps ESG risk tied to actual decisions and turns it into a live input for resource allocation and priority setting.
Those choices become the base of a long-term ESG risk program.
Building a Long-Term ESG Risk Strategy
A single assessment is just the starting line. After risk scoring and mitigation planning, the next move is to make ESG part of day-to-day management. The aim is simple: build ESG risk analysis into routine choices about capital, suppliers, and reporting.
Creating an Organization-Wide ESG Risk Program
A durable ESG risk program starts with clear ownership. In practice, that means adding ESG items to your company’s Enterprise Risk Management (ERM) register and setting materiality thresholds that trigger board-level escalation. Board oversight should be formal, with a senior owner in place and shared responsibility across finance, risk, operations, and sustainability. Cross-functional working groups help keep that ownership spread across the business instead of leaving it with one team.
Once governance is set, supplier data becomes the main place where execution either works or falls apart. Scope 3 emissions make supplier engagement, standard data requests, and traceability tools a must. For food companies, emissions outside direct company control account for roughly 90% of their total greenhouse gas inventory [14].
Targets also need to be measurable and time-bound. Risk assumptions and targets should be reviewed each year [13].
Key Takeaways for Agriculture Leaders
With ESG built into governance and supplier systems, the next step is steady review and reporting. Agriculture carries material ESG risk across climate, water, labor, and governance. The strongest programs build ESG into ERM, capital planning, and supplier management, then track progress with TCFD, TNFD, and SASB.
FAQs
How do I start ESG risk analysis on a farm?
Start with a materiality assessment to pinpoint the ESG issues that matter most to your farm. That may include water use, carbon intensity, labor standards, and supply chain traceability. The goal is simple: figure out where the biggest risks and pressure points sit before you start measuring everything under the sun.
From there, map your supply chain and build a baseline for Scope 1 and Scope 2 emissions. At the same time, assess whether Scope 3 tracking is practical for your operation. For some farms, that step is within reach. For others, it can be a heavy lift, so it makes sense to judge feasibility early.
Next, bring those findings into your enterprise risk management process. Set materiality thresholds, and screen capital spending for climate-related risks so major investments are judged with the same discipline as other business decisions. Digital tools can also help tighten data accuracy, which matters when you're trying to track progress without getting lost in messy spreadsheets.
Which ESG framework fits agriculture best?
No single framework works for every agriculture business. The sector is messy by nature, with different crops, regions, labor models, and supply chains creating very different reporting needs. That’s why most organizations don’t rely on just one standard. They usually combine mandatory reporting with specialized voluntary standards to deal with agriculture’s environmental and social issues in a more practical way.
Common choices include the OECD-FAO Guidance for supply chain due diligence, the GHG Protocol for emissions, the TNFD’s LEAP approach for nature-related risks, and the RAI Tool for supply chain sustainability. Put simply, companies often need a mix-and-match approach rather than a one-size-fits-all playbook. Council Fire can help organizations sort through these requirements and choose a path that fits their goals and reporting duties.
What data matters most for agricultural ESG risk?
Effective analysis starts with granular, farm-level data. Without that level of detail, it’s hard to see what’s working, what’s slipping, and where action should go first.
The most useful indicators tend to fall into two groups:
Environmental: water-use efficiency, soil health, greenhouse gas emissions, energy use, and biodiversity
Social: worker safety, injury rates, and labor compliance
To gather this data with more precision, many organizations use precision agriculture, satellite imagery, and environmental monitoring. These tools help teams collect accurate information and improve supply chain transparency.
Related Blog Posts
Latest Articles
©2025
Narrative Change and Power Building: The Missing Half of Advocacy
Narrative change is the process of disrupting dominant narratives that normalize inequity and advancing new narratives from historically marginalized communities.
Funding Resilience Without Federal Grants
BRIC is unreliable and FEMA is shrinking. Here's how cities fund climate resilience with dedicated revenue, blended finance, and a coordinating authority.
The ESG Blind Spot: How AI Is Finding Risks in Companies Nobody Else Is Watching
Norway's sovereign wealth fund uses AI to screen 7,200 portfolio companies for forced labor and corruption within 24 hours. The real story is the emerging-market coverage gap that traditional ESG data vendors miss — and what it means for any company with a global supply chain.
FAQ
What does it really mean to “redefine profit”?
What makes Council Fire different?
Who does Council Fire work with?
What does working with Council Fire actually look like?
How does Council Fire help organizations turn big goals into action?
How does Council Fire define and measure success?