
Jul 21, 2026
Ultimate Guide to ESG Cloud Platforms
ESG Strategy
In This Article
Choose, implement, and use ESG cloud platforms for governed data, audit-ready reporting, and actionable decarbonization.
Ultimate Guide to ESG Cloud Platforms
About 50% of organizations still track ESG in spreadsheets - and that breaks down fast once reporting, audit checks, and multi-site data get involved.
If I had to sum up this guide in a few lines, I’d say this: an ESG cloud platform gives you one place for data, controls, calculations, dashboards, and reporting. It helps you move from scattered files to a system with user permissions, sign-offs, change logs, framework mapping, and reports tied back to source records.
Here’s the short version of what matters most:
Start with sustainability consulting and governance, not software. I’d define data owners, approval steps, KPI definitions, and reporting boundaries before comparing vendors.
Move past spreadsheets when audit trails matter. File version issues, broken formulas, and weak traceability become a bigger risk as reporting rules tighten.
Check the core workflow: ingest data, validate it, store it, calculate metrics, and produce reports.
Review security early. Look for RBAC, SSO, MFA, encryption, logs, SOC 2 Type II, and ISO 27001.
Pick for fit, not feature count. I’d test integrations, user experience, Scope 3 support, multi-entity setup, and auditor-facing records with my own data.
Treat setup like a reporting program. Scope the entities, map source systems, migrate clean history, assign owners, train users, and track submission and exception rates.
Use the platform for more than reports. Once data is stable, I’d use it for intensity metrics, site benchmarking, outlier alerts, supplier follow-up, and planning tied to budgets and cost centers.
A few facts in this guide stand out:
About 50% of organizations still use spreadsheets for ESG tracking.
A common first migration target is the most recent two years of history.
One example showed revenue-normalized Scope 1 emissions intensity falling 65%, from 4.0 to 1.4 tCO₂e per $1,000,000 in revenue.
In another case, work with 200 suppliers found 28% needed better management steps, and focused action cut carbon emissions by 12% across the supply base.
If you’re selecting a platform, I’d keep my review centered on a short checklist: data inputs, controls, audit trail depth, framework mapping, security records, Scope 3 handling, dashboards, and implementation support. That gives you a clearer path than relying on demos alone.
This guide, in short, shows how to pick, set up, and use an ESG cloud platform so your data can support reporting, assurance, benchmarking, and planning.
How to Master ESG Compliance: Scalable, Automated, and Audit-ready (walkthrough)
How ESG Cloud Platforms Work
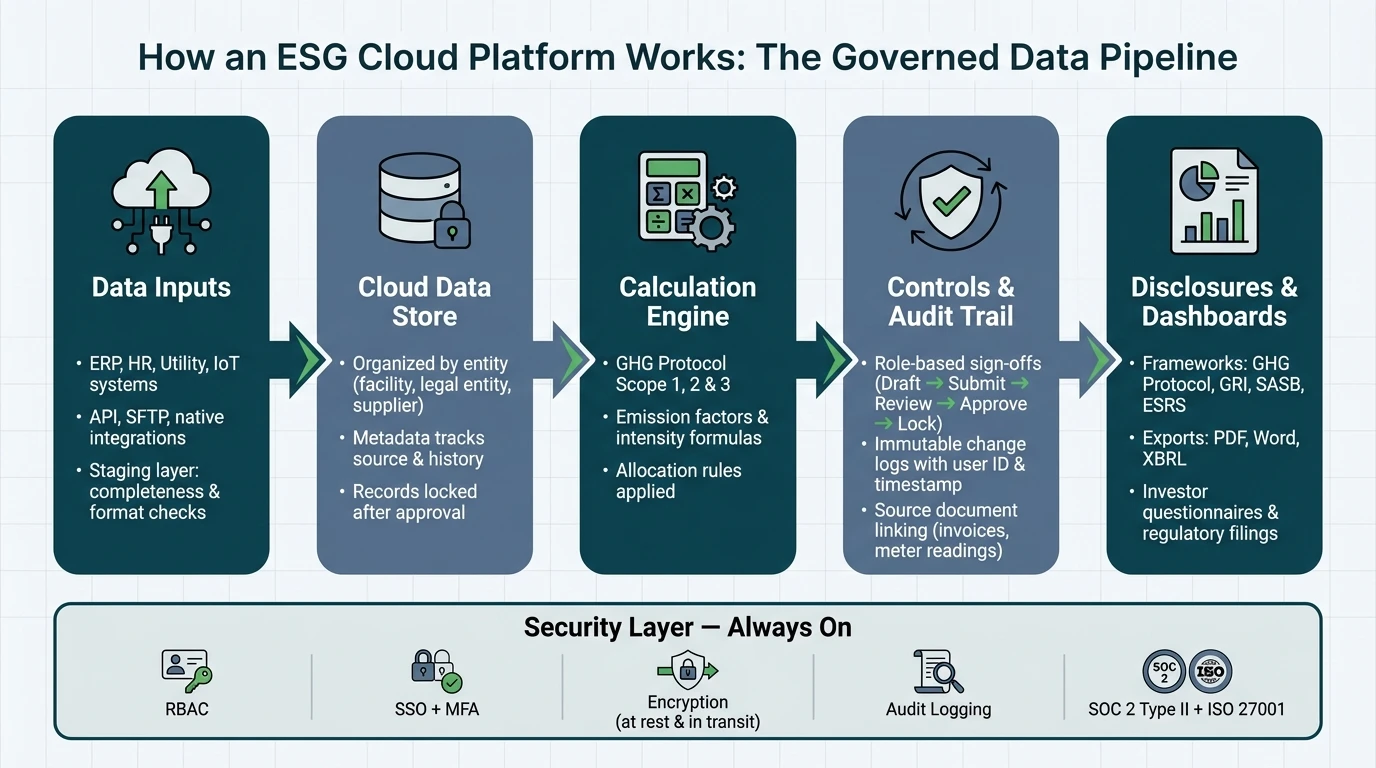
ESG Cloud Platform: From Raw Data to Reliable Reporting
An ESG cloud platform is a governed pipeline that moves data from source systems to validated disclosures. That pipeline only holds up when governance is built into every step.
Core Architecture: Data Inputs, Storage, Analytics, and Reporting
The architecture follows a simple flow: ingest, store, calculate, report. At the ingestion layer, the platform pulls data from ERP, HR, utility, supplier, facilities, and IoT systems through API, SFTP, or native integrations. Incoming data first lands in a staging layer, where the system checks for completeness and format before anything is loaded.
From there, the validated data moves into a cloud data store. Records are organized by entity, such as facility, legal entity, supplier, or reporting period. Metadata tracks where each record came from and what happened to it along the way. A calculation engine then applies emission factors, intensity formulas, and allocation rules, including GHG Protocol-compliant scope 1, 2, and 3 calculations.
The analytics layer turns that data into dashboards, scorecards, and benchmarks that teams can filter by region, business unit, or time period. At the output layer, the platform produces structured disclosures aligned with frameworks such as GHG Protocol, GRI, SASB, and ESRS, along with investor questionnaires, regulatory filings, and internal management reports. Exports are usually available in PDF, Word, or machine-readable formats like XBRL.
The next piece is control: who owns the data, who approves it, and how every change is tracked.
Key Functions: Data Governance, Framework Mapping, and Audit Trails
Raw data has little value without controls around it. ESG cloud platforms build governance into the workflow itself. Each dataset - whether it's a facility's energy use, a scope 3 category, or a diversity metric - gets a data owner who is responsible for quality and sign-off. Validation rules flag problems early, including missing fields, values outside allowed ranges, and year-over-year changes that don't look right. Those exceptions appear in data quality dashboards so owners can review and fix them before the data moves ahead.
Approval workflows often look a lot like financial close processes. Data moves through stages such as draft, submit, review, approve, and lock, with role-based sign-offs at each point. Once a period is locked, any correction has to go through an approved workflow that keeps the old value and records the change. That's what makes the data assurance-ready. An auditor can trace any reported figure back through approval steps, transformation rules, and source records, including attached invoices, meter readings, or supplier declarations.
Framework mapping sits above that governed dataset. Platforms keep taxonomies for GHG Protocol, GRI, SASB, and ESRS, then map internal indicators to each framework's disclosure rules. For multinational organizations, this matters a lot. The same source data can support both U.S. investor reporting needs and EU requirements under CSRD, without forcing teams to build separate datasets from scratch.
Once the data model and workflows are in place, the platform still needs strong enterprise access controls and logging.
Security and Compliance Requirements
Enterprise ESG platforms should meet the same security standard as other critical business systems. Role-based access control (RBAC) lets administrators limit visibility by business unit, region, facility, and data domain. In plain terms, HR data should not be visible to facilities managers, and supplier files should not be open to everyone with a login. Single sign-on (SSO) with corporate identity providers helps keep access tied to existing credentials and multi-factor authentication policies.
Data should be encrypted at rest and in transit, and all access and administrative activity should be logged for security monitoring. Public-sector and regulated organizations may also need FedRAMP or NIST alignment. When reviewing vendors, organizations should ask for current SOC 2 Type II reports and ISO 27001 certificates, check for any noted exceptions, and confirm exactly which services and environments are covered by the audit scope.
Security Feature | What to Look For |
|---|---|
Access control | Role-based permissions by entity, region, and data domain |
Authentication | SSO integration with MFA via SAML or OAuth |
Encryption | At-rest and in-transit encryption for all data |
Audit logging | Immutable logs of access, changes, and approvals |
Compliance documentation | SOC 2 Type II report, ISO 27001 certificate, and documentation of covered services and environments |
How to Evaluate and Select an ESG Cloud Platform
Picking an ESG cloud platform from a feature checklist alone is a good way to end up with too much software or not enough of it. The better choice is the platform that matches your reporting scope and the way your team actually works.
Define Requirements Before Reviewing Products
Start with the data flows and controls you’ve already mapped. Use them to set your selection criteria before you look at products.
First, pin down the basics: reporting drivers, in-scope entities, emissions scopes, and the ESG metrics that matter most. Be clear on why you’re making the investment. Is it driven by regulatory compliance, such as SEC climate disclosures or other reporting rules? Is it coming from investor and lender pressure, customer RFPs, or internal goals like net-zero targets or DEI commitments?
Then define what sits inside the boundary. That might mean U.S. operations only, global operations, joint ventures, or franchisees. From there, decide which emissions scopes you need to measure. Scope 1 and Scope 2 are often where teams begin. Scope 3 changes the game because it brings in supplier workflows, richer data models, and scenario analysis.
Emissions are only part of the picture. You also need a clean map of workforce and governance metrics such as board diversity, safety rates, training hours, and turnover. For each metric, trace it back to the source system that owns it today, whether that’s your HRIS, EHS platform, or finance system. Then map each metric to its source system and current approval path. That inventory helps you define integrations, ownership, and reporting cutoffs.
Those operating patterns should shape the approval chains and role assignments you set up in the platform. If contributors are entering data across more than one time zone, check for support for time-zone cutoffs and local date formats. That sounds like a small detail until quarter-end hits and teams are looking at different reporting windows.
Selection Criteria: Integration, Usability, Scalability, and Assurance Readiness
Test your requirements with your own data, not polished vendor samples. Ask for a proof of concept that uses your actual entity hierarchy, one or two live data sources, and one indicator calculated end to end. That’s where integration gaps and workflow friction tend to show up.
On integration, look past the sales pitch. Ask for documented REST APIs, supported authentication methods such as OAuth 2.0 and SAML, and pre-built connectors for the systems you already use, including SAP, Oracle, Workday, and energy management or utility data sources.
Usability matters just as much. Bring real users into the demo process: facility managers, HR analysts, and finance controllers. Score each platform on how well it guides non-technical contributors through data entry, task management, and approvals. People won’t sign off on numbers they don’t trust, so calculation logic needs to be visible. Contributors should be able to see how emissions were derived, including activity data, emission factors, and assumptions.
For assurance readiness, ask vendors to show the auditor view. You want to see lineage, source evidence, methodology notes, and version control. Then check scalability. Make sure the platform can handle multi-entity structures without forcing you into separate instances, supports multiple currencies, and can take on new Scope 3 categories or framework updates without a costly re-implementation.
This is also the point where you test whether the platform can do more than annual reporting. It should support long-term decarbonization work and stakeholder planning too. If it can’t help with capital allocation or supplier engagement, you may outgrow it fast. Pick the platform that can support setup, ownership, and reporting discipline across the business.
Comparison Table for Internal Platform Review
Use this table to score vendors with objective evidence from demos, documentation, and reference checks.
Capability Category | What to Evaluate |
|---|---|
API Integrations | Documented REST APIs, pre-built connectors for ERP (SAP, Oracle), HRIS (Workday), and energy management or utility data sources; read/write access and webhook support |
Scope 3 Support | Coverage of key categories, supplier data collection tools, ability to use both primary and secondary emission factors |
Workflow Controls | Configurable approval chains, role-based task assignments, automated reminders, and multi-step sign-offs |
Audit Trail Detail | Granular logs of every data change with user ID, timestamp, version history, and source document linking |
Dashboarding | Drill-down by facility, region, business unit, and reporting period; executive summaries and operational views; export options |
Security Documentation | Current SOC 2 Type II report, ISO 27001 certificate, penetration testing cadence, and U.S.-based data residency |
Implementation Support | U.S. time zone onboarding, structured training programs, professional services for complex multi-entity setups |
Strategic Fit | Score whether the platform supports decarbonization, circularity, or stakeholder planning |
Use the scorecard to define implementation scope, ownership, and controls.
Implementation: From Setup to Reliable Reporting
Implementation is an operating program, not a software install. Start by defining scope, set up controls, and then build reporting routines people can follow without friction.
Scope the Program and Prepare the Data
Before you load anything into the platform, draw the reporting boundary clearly. Decide which entities, geographies, and business units are in scope. Spell out which ESG frameworks or customer requirements the system needs to meet on day one. A solid implementation plan should also lock in the baseline year, reporting cadence, and the historical data needed to keep comparisons consistent over time.
Next, do a source-system inventory. Trace every metric back to where it starts - whether that’s your ERP, HRIS, utility bills, travel systems, fleet management tools, EHS databases, or procurement platforms. This step shows where integrations are needed, where manual entry can’t be avoided, and where data quality problems are most likely to show up.
For historical data, keep it simple. A common recommendation is to migrate the most recent two years first [2]. That gives you enough history for trend analysis without bogging down the first rollout. Older archives can come later, once the core workflows are steady. Before moving any data, clean and normalize it. Standardize units, entity names, currencies, and estimates before import.
That groundwork speeds up workflow design and cuts down on rework later.
Configure Workflows, Ownership, and Controls
Each major ESG data stream needs a named owner, a preparer, and an approver, all documented in a RACI-style model. Sustainability teams usually coordinate methodology, but finance, facilities, HR, procurement, and operations own the upstream activity data. Clear ownership cuts rework and makes it much easier to see who checked each figure and when.
Set collection cycles that match how the business already runs. Monthly or quarterly cycles fit most operational metrics, while annual cycles may be enough for some disclosures. Build approval workflows with validation rules, required fields, and version control.
Exception handling needs its own written process. If data is missing, late, or unverified, the platform should flag it at once and route it to the right owner - not quietly mix it in with verified figures. Estimated values should carry a confidence flag, a documented estimation method, and a reconciliation date. That keeps reporting clear and helps stop weak inputs from being mistaken for verified performance.
Every KPI also needs a written definition, including:
Formula
Source
Unit
Cadence
Framework mapping
Measurement basis
This keeps different business units from calculating the same metric in different ways and makes assurance much easier.
With roles, controls, and definitions in place, the next job is getting people to use the system well.
Train Contributors and Manage Organizational Change
Generic system training rarely sticks. Role-based training usually does, because each user group works with the platform in a different way.
Training should match each user’s role in the reporting cycle.
User Group | Training Focus |
|---|---|
Sustainability teams | Methodology, framework mapping, reporting workflows, exception review |
Finance staff | Controls, sign-off logic, escalation paths |
Facilities & procurement | Simple, repeatable data-entry instructions, task management |
Executive reviewers | Dashboard interpretation, trend analysis, escalation points |
Short, process-specific sessions and job aids tend to work better than one-off system demos. For multinational teams, training in local languages helps a lot. Adoption also improves when the platform fits into existing business rhythms - monthly close, facilities reviews, procurement scorecards - instead of being treated like a separate sustainability side project.
After launch, run recurring governance reviews to check data completeness, late submissions, approval bottlenecks, unresolved exceptions, and methodology changes. Track a small set of implementation KPIs, such as:
On-time submission rates
Percentage of metrics with complete audit trails
Number of open exceptions
Time to close the reporting cycle
Once those routines are steady, the same data can support benchmarking and decarbonization planning.
Optimization: Using ESG Cloud Platforms for Performance, Planning, and Long-Term Value
Once ownership, controls, and reporting cadence are set, the next step is to use that data to manage performance, not just report it. The same governed inputs - defined metrics, named owners, and documented methodologies - can support benchmarking, planning, and day-to-day decision-making.
Track Performance With Better Metrics and Benchmarking
Raw totals only tell part of the story. Intensity metrics give you a cleaner view of performance, especially when you’re comparing sites with different sizes, output levels, or revenue bases. Configure your platform to calculate ratios such as tCO₂e per $1,000,000 in revenue, energy use per square foot, or waste generated per unit of output. That makes cross-site comparison far more useful.
Internal benchmarking works best when it is built around peer groups. A U.S. distribution center should be compared with other U.S. distribution centers. A North American manufacturing plant should be measured against similar plants in that region. From there, compare each entity against medians and quartiles for energy intensity, water use, injury rates, and other key indicators [3].
It also helps to set outlier alerts. If water use jumps without a clear reason, or if safety metrics start slipping, the platform should flag it and send it to the manager who owns that metric for review [1]. That kind of alerting turns reporting into action.
One portfolio ESG benchmarking report showed why this matters: revenue-normalized Scope 1 emissions intensity fell from 4.0 to 1.4 tCO₂e per $1,000,000 in revenue, a 65% reduction [4]. Raw totals might miss that story. Intensity data shows it plainly.
Use those benchmark results and outlier alerts to decide where investment should go next and where supplier action is needed.
Connect Platform Data to Decarbonization and Stakeholder Planning
When emissions data is tied to cost centers and project budgets, it becomes much easier to rank energy efficiency projects and see where capital spending can cut the most carbon per dollar. That’s where a platform starts to matter in day-to-day business decisions, not just annual reporting.
Scope 3 data from procurement and supply chain modules can also point to high-emitting hotspots. That gives teams a clearer path for supplier engagement. In one automotive supplier example, annual ESG assessments of 200 key suppliers found that 28% needed environmental management improvements; focused training and material changes cut carbon emissions by 12% across the supply base [5].
That is where platform data becomes operational. Council Fire helps turn platform outputs into decarbonization pathways, stakeholder-centered planning, and investment decisions.
Conclusion: What to Prioritize First
Start with governance. Then move to benchmarking. After that, build planning on top of both.
Choose a platform for integration depth and assurance readiness, not for a long feature list. Set it up with disciplined data ownership and role-based controls. Once reporting is stable, shift attention to optimization: intensity benchmarking, outlier management, and linking ESG data to the decisions that move performance forward.
Organizations that follow this path move beyond compliance-led reporting. They build a system that improves accountability, guides capital allocation, and supports long-term sustainability value.
FAQs
When should we move beyond spreadsheets?
Move past spreadsheets once manual work stops keeping up with the volume, complexity, or assurance demands of your reporting.
As reporting frameworks grow and assurance expectations tighten, dedicated software shifts from a nice-to-have to a must-have. Spreadsheets simply don't offer key controls such as audit trails, role-based access, and automated validation. A centralized platform gives teams a faster path to reporting, can cut assurance costs, and supports better decisions.
What should we set up before choosing a platform?
Before you pick a platform, get clear on the decision it needs to improve. Don’t shop by broad category names. Start with the immediate goal instead: disclosure, emissions reduction, supplier assessment, or risk management. That changes the conversation from “Which tool looks best?” to “Which tool helps us act on the thing that matters most right now?”
At the same time, put the data groundwork in place. Run a materiality assessment, map the metrics you need back to the source systems that hold them, and assign clear ownership for each data set. If no one owns the data, things slip fast.
Council Fire can help build this data architecture, put governance policies in place, and get your team ready for assurance.
How long does ESG platform implementation usually take?
ESG platform implementation usually takes about 12 months from start to finish. In most cases, the work begins with a 2-month assessment to map the current state and spot gaps early.
From there, teams often spend 3 months on architecture and governance planning. That phase sets the rules, data structure, and ownership model before the heavier build work starts.
Deployment, integration, and data migration tend to fall in months 6–8. After that, the focus shifts to testing, dry-run reporting, and assurance readiness during months 9–12. For larger enterprise projects, the timeline can stretch beyond a year.
Related Blog Posts
Latest Articles
©2026

Narrative Change and Power Building: The Missing Half of Advocacy
Narrative change is the process of disrupting dominant narratives that normalize inequity and advancing new narratives from historically marginalized communities.

Funding Resilience Without Federal Grants
BRIC is unreliable and FEMA is shrinking. Here's how cities fund climate resilience with dedicated revenue, blended finance, and a coordinating authority.

The ESG Blind Spot: How AI Is Finding Risks in Companies Nobody Else Is Watching
Norway's sovereign wealth fund uses AI to screen 7,200 portfolio companies for forced labor and corruption within 24 hours. The real story is the emerging-market coverage gap that traditional ESG data vendors miss — and what it means for any company with a global supply chain.
Narrative Change and Power Building: The Missing Half of Advocacy
Narrative change is the process of disrupting dominant narratives that normalize inequity and advancing new narratives from historically marginalized communities.
Funding Resilience Without Federal Grants
BRIC is unreliable and FEMA is shrinking. Here's how cities fund climate resilience with dedicated revenue, blended finance, and a coordinating authority.
The ESG Blind Spot: How AI Is Finding Risks in Companies Nobody Else Is Watching
Norway's sovereign wealth fund uses AI to screen 7,200 portfolio companies for forced labor and corruption within 24 hours. The real story is the emerging-market coverage gap that traditional ESG data vendors miss — and what it means for any company with a global supply chain.
FAQ
01
What does it really mean to “redefine profit”?
02
What makes Council Fire different?
03
Who does Council Fire work with?
04
What does working with Council Fire actually look like?
05
How does Council Fire help organizations turn big goals into action?
06
How does Council Fire define and measure success?
07
How does technology fit into Council Fire’s work?
Jul 21, 2026
Ultimate Guide to ESG Cloud Platforms
ESG Strategy
In This Article
Choose, implement, and use ESG cloud platforms for governed data, audit-ready reporting, and actionable decarbonization.
Ultimate Guide to ESG Cloud Platforms
About 50% of organizations still track ESG in spreadsheets - and that breaks down fast once reporting, audit checks, and multi-site data get involved.
If I had to sum up this guide in a few lines, I’d say this: an ESG cloud platform gives you one place for data, controls, calculations, dashboards, and reporting. It helps you move from scattered files to a system with user permissions, sign-offs, change logs, framework mapping, and reports tied back to source records.
Here’s the short version of what matters most:
Start with sustainability consulting and governance, not software. I’d define data owners, approval steps, KPI definitions, and reporting boundaries before comparing vendors.
Move past spreadsheets when audit trails matter. File version issues, broken formulas, and weak traceability become a bigger risk as reporting rules tighten.
Check the core workflow: ingest data, validate it, store it, calculate metrics, and produce reports.
Review security early. Look for RBAC, SSO, MFA, encryption, logs, SOC 2 Type II, and ISO 27001.
Pick for fit, not feature count. I’d test integrations, user experience, Scope 3 support, multi-entity setup, and auditor-facing records with my own data.
Treat setup like a reporting program. Scope the entities, map source systems, migrate clean history, assign owners, train users, and track submission and exception rates.
Use the platform for more than reports. Once data is stable, I’d use it for intensity metrics, site benchmarking, outlier alerts, supplier follow-up, and planning tied to budgets and cost centers.
A few facts in this guide stand out:
About 50% of organizations still use spreadsheets for ESG tracking.
A common first migration target is the most recent two years of history.
One example showed revenue-normalized Scope 1 emissions intensity falling 65%, from 4.0 to 1.4 tCO₂e per $1,000,000 in revenue.
In another case, work with 200 suppliers found 28% needed better management steps, and focused action cut carbon emissions by 12% across the supply base.
If you’re selecting a platform, I’d keep my review centered on a short checklist: data inputs, controls, audit trail depth, framework mapping, security records, Scope 3 handling, dashboards, and implementation support. That gives you a clearer path than relying on demos alone.
This guide, in short, shows how to pick, set up, and use an ESG cloud platform so your data can support reporting, assurance, benchmarking, and planning.
How to Master ESG Compliance: Scalable, Automated, and Audit-ready (walkthrough)
How ESG Cloud Platforms Work
ESG Cloud Platform: From Raw Data to Reliable Reporting
An ESG cloud platform is a governed pipeline that moves data from source systems to validated disclosures. That pipeline only holds up when governance is built into every step.
Core Architecture: Data Inputs, Storage, Analytics, and Reporting
The architecture follows a simple flow: ingest, store, calculate, report. At the ingestion layer, the platform pulls data from ERP, HR, utility, supplier, facilities, and IoT systems through API, SFTP, or native integrations. Incoming data first lands in a staging layer, where the system checks for completeness and format before anything is loaded.
From there, the validated data moves into a cloud data store. Records are organized by entity, such as facility, legal entity, supplier, or reporting period. Metadata tracks where each record came from and what happened to it along the way. A calculation engine then applies emission factors, intensity formulas, and allocation rules, including GHG Protocol-compliant scope 1, 2, and 3 calculations.
The analytics layer turns that data into dashboards, scorecards, and benchmarks that teams can filter by region, business unit, or time period. At the output layer, the platform produces structured disclosures aligned with frameworks such as GHG Protocol, GRI, SASB, and ESRS, along with investor questionnaires, regulatory filings, and internal management reports. Exports are usually available in PDF, Word, or machine-readable formats like XBRL.
The next piece is control: who owns the data, who approves it, and how every change is tracked.
Key Functions: Data Governance, Framework Mapping, and Audit Trails
Raw data has little value without controls around it. ESG cloud platforms build governance into the workflow itself. Each dataset - whether it's a facility's energy use, a scope 3 category, or a diversity metric - gets a data owner who is responsible for quality and sign-off. Validation rules flag problems early, including missing fields, values outside allowed ranges, and year-over-year changes that don't look right. Those exceptions appear in data quality dashboards so owners can review and fix them before the data moves ahead.
Approval workflows often look a lot like financial close processes. Data moves through stages such as draft, submit, review, approve, and lock, with role-based sign-offs at each point. Once a period is locked, any correction has to go through an approved workflow that keeps the old value and records the change. That's what makes the data assurance-ready. An auditor can trace any reported figure back through approval steps, transformation rules, and source records, including attached invoices, meter readings, or supplier declarations.
Framework mapping sits above that governed dataset. Platforms keep taxonomies for GHG Protocol, GRI, SASB, and ESRS, then map internal indicators to each framework's disclosure rules. For multinational organizations, this matters a lot. The same source data can support both U.S. investor reporting needs and EU requirements under CSRD, without forcing teams to build separate datasets from scratch.
Once the data model and workflows are in place, the platform still needs strong enterprise access controls and logging.
Security and Compliance Requirements
Enterprise ESG platforms should meet the same security standard as other critical business systems. Role-based access control (RBAC) lets administrators limit visibility by business unit, region, facility, and data domain. In plain terms, HR data should not be visible to facilities managers, and supplier files should not be open to everyone with a login. Single sign-on (SSO) with corporate identity providers helps keep access tied to existing credentials and multi-factor authentication policies.
Data should be encrypted at rest and in transit, and all access and administrative activity should be logged for security monitoring. Public-sector and regulated organizations may also need FedRAMP or NIST alignment. When reviewing vendors, organizations should ask for current SOC 2 Type II reports and ISO 27001 certificates, check for any noted exceptions, and confirm exactly which services and environments are covered by the audit scope.
Security Feature | What to Look For |
|---|---|
Access control | Role-based permissions by entity, region, and data domain |
Authentication | SSO integration with MFA via SAML or OAuth |
Encryption | At-rest and in-transit encryption for all data |
Audit logging | Immutable logs of access, changes, and approvals |
Compliance documentation | SOC 2 Type II report, ISO 27001 certificate, and documentation of covered services and environments |
How to Evaluate and Select an ESG Cloud Platform
Picking an ESG cloud platform from a feature checklist alone is a good way to end up with too much software or not enough of it. The better choice is the platform that matches your reporting scope and the way your team actually works.
Define Requirements Before Reviewing Products
Start with the data flows and controls you’ve already mapped. Use them to set your selection criteria before you look at products.
First, pin down the basics: reporting drivers, in-scope entities, emissions scopes, and the ESG metrics that matter most. Be clear on why you’re making the investment. Is it driven by regulatory compliance, such as SEC climate disclosures or other reporting rules? Is it coming from investor and lender pressure, customer RFPs, or internal goals like net-zero targets or DEI commitments?
Then define what sits inside the boundary. That might mean U.S. operations only, global operations, joint ventures, or franchisees. From there, decide which emissions scopes you need to measure. Scope 1 and Scope 2 are often where teams begin. Scope 3 changes the game because it brings in supplier workflows, richer data models, and scenario analysis.
Emissions are only part of the picture. You also need a clean map of workforce and governance metrics such as board diversity, safety rates, training hours, and turnover. For each metric, trace it back to the source system that owns it today, whether that’s your HRIS, EHS platform, or finance system. Then map each metric to its source system and current approval path. That inventory helps you define integrations, ownership, and reporting cutoffs.
Those operating patterns should shape the approval chains and role assignments you set up in the platform. If contributors are entering data across more than one time zone, check for support for time-zone cutoffs and local date formats. That sounds like a small detail until quarter-end hits and teams are looking at different reporting windows.
Selection Criteria: Integration, Usability, Scalability, and Assurance Readiness
Test your requirements with your own data, not polished vendor samples. Ask for a proof of concept that uses your actual entity hierarchy, one or two live data sources, and one indicator calculated end to end. That’s where integration gaps and workflow friction tend to show up.
On integration, look past the sales pitch. Ask for documented REST APIs, supported authentication methods such as OAuth 2.0 and SAML, and pre-built connectors for the systems you already use, including SAP, Oracle, Workday, and energy management or utility data sources.
Usability matters just as much. Bring real users into the demo process: facility managers, HR analysts, and finance controllers. Score each platform on how well it guides non-technical contributors through data entry, task management, and approvals. People won’t sign off on numbers they don’t trust, so calculation logic needs to be visible. Contributors should be able to see how emissions were derived, including activity data, emission factors, and assumptions.
For assurance readiness, ask vendors to show the auditor view. You want to see lineage, source evidence, methodology notes, and version control. Then check scalability. Make sure the platform can handle multi-entity structures without forcing you into separate instances, supports multiple currencies, and can take on new Scope 3 categories or framework updates without a costly re-implementation.
This is also the point where you test whether the platform can do more than annual reporting. It should support long-term decarbonization work and stakeholder planning too. If it can’t help with capital allocation or supplier engagement, you may outgrow it fast. Pick the platform that can support setup, ownership, and reporting discipline across the business.
Comparison Table for Internal Platform Review
Use this table to score vendors with objective evidence from demos, documentation, and reference checks.
Capability Category | What to Evaluate |
|---|---|
API Integrations | Documented REST APIs, pre-built connectors for ERP (SAP, Oracle), HRIS (Workday), and energy management or utility data sources; read/write access and webhook support |
Scope 3 Support | Coverage of key categories, supplier data collection tools, ability to use both primary and secondary emission factors |
Workflow Controls | Configurable approval chains, role-based task assignments, automated reminders, and multi-step sign-offs |
Audit Trail Detail | Granular logs of every data change with user ID, timestamp, version history, and source document linking |
Dashboarding | Drill-down by facility, region, business unit, and reporting period; executive summaries and operational views; export options |
Security Documentation | Current SOC 2 Type II report, ISO 27001 certificate, penetration testing cadence, and U.S.-based data residency |
Implementation Support | U.S. time zone onboarding, structured training programs, professional services for complex multi-entity setups |
Strategic Fit | Score whether the platform supports decarbonization, circularity, or stakeholder planning |
Use the scorecard to define implementation scope, ownership, and controls.
Implementation: From Setup to Reliable Reporting
Implementation is an operating program, not a software install. Start by defining scope, set up controls, and then build reporting routines people can follow without friction.
Scope the Program and Prepare the Data
Before you load anything into the platform, draw the reporting boundary clearly. Decide which entities, geographies, and business units are in scope. Spell out which ESG frameworks or customer requirements the system needs to meet on day one. A solid implementation plan should also lock in the baseline year, reporting cadence, and the historical data needed to keep comparisons consistent over time.
Next, do a source-system inventory. Trace every metric back to where it starts - whether that’s your ERP, HRIS, utility bills, travel systems, fleet management tools, EHS databases, or procurement platforms. This step shows where integrations are needed, where manual entry can’t be avoided, and where data quality problems are most likely to show up.
For historical data, keep it simple. A common recommendation is to migrate the most recent two years first [2]. That gives you enough history for trend analysis without bogging down the first rollout. Older archives can come later, once the core workflows are steady. Before moving any data, clean and normalize it. Standardize units, entity names, currencies, and estimates before import.
That groundwork speeds up workflow design and cuts down on rework later.
Configure Workflows, Ownership, and Controls
Each major ESG data stream needs a named owner, a preparer, and an approver, all documented in a RACI-style model. Sustainability teams usually coordinate methodology, but finance, facilities, HR, procurement, and operations own the upstream activity data. Clear ownership cuts rework and makes it much easier to see who checked each figure and when.
Set collection cycles that match how the business already runs. Monthly or quarterly cycles fit most operational metrics, while annual cycles may be enough for some disclosures. Build approval workflows with validation rules, required fields, and version control.
Exception handling needs its own written process. If data is missing, late, or unverified, the platform should flag it at once and route it to the right owner - not quietly mix it in with verified figures. Estimated values should carry a confidence flag, a documented estimation method, and a reconciliation date. That keeps reporting clear and helps stop weak inputs from being mistaken for verified performance.
Every KPI also needs a written definition, including:
Formula
Source
Unit
Cadence
Framework mapping
Measurement basis
This keeps different business units from calculating the same metric in different ways and makes assurance much easier.
With roles, controls, and definitions in place, the next job is getting people to use the system well.
Train Contributors and Manage Organizational Change
Generic system training rarely sticks. Role-based training usually does, because each user group works with the platform in a different way.
Training should match each user’s role in the reporting cycle.
User Group | Training Focus |
|---|---|
Sustainability teams | Methodology, framework mapping, reporting workflows, exception review |
Finance staff | Controls, sign-off logic, escalation paths |
Facilities & procurement | Simple, repeatable data-entry instructions, task management |
Executive reviewers | Dashboard interpretation, trend analysis, escalation points |
Short, process-specific sessions and job aids tend to work better than one-off system demos. For multinational teams, training in local languages helps a lot. Adoption also improves when the platform fits into existing business rhythms - monthly close, facilities reviews, procurement scorecards - instead of being treated like a separate sustainability side project.
After launch, run recurring governance reviews to check data completeness, late submissions, approval bottlenecks, unresolved exceptions, and methodology changes. Track a small set of implementation KPIs, such as:
On-time submission rates
Percentage of metrics with complete audit trails
Number of open exceptions
Time to close the reporting cycle
Once those routines are steady, the same data can support benchmarking and decarbonization planning.
Optimization: Using ESG Cloud Platforms for Performance, Planning, and Long-Term Value
Once ownership, controls, and reporting cadence are set, the next step is to use that data to manage performance, not just report it. The same governed inputs - defined metrics, named owners, and documented methodologies - can support benchmarking, planning, and day-to-day decision-making.
Track Performance With Better Metrics and Benchmarking
Raw totals only tell part of the story. Intensity metrics give you a cleaner view of performance, especially when you’re comparing sites with different sizes, output levels, or revenue bases. Configure your platform to calculate ratios such as tCO₂e per $1,000,000 in revenue, energy use per square foot, or waste generated per unit of output. That makes cross-site comparison far more useful.
Internal benchmarking works best when it is built around peer groups. A U.S. distribution center should be compared with other U.S. distribution centers. A North American manufacturing plant should be measured against similar plants in that region. From there, compare each entity against medians and quartiles for energy intensity, water use, injury rates, and other key indicators [3].
It also helps to set outlier alerts. If water use jumps without a clear reason, or if safety metrics start slipping, the platform should flag it and send it to the manager who owns that metric for review [1]. That kind of alerting turns reporting into action.
One portfolio ESG benchmarking report showed why this matters: revenue-normalized Scope 1 emissions intensity fell from 4.0 to 1.4 tCO₂e per $1,000,000 in revenue, a 65% reduction [4]. Raw totals might miss that story. Intensity data shows it plainly.
Use those benchmark results and outlier alerts to decide where investment should go next and where supplier action is needed.
Connect Platform Data to Decarbonization and Stakeholder Planning
When emissions data is tied to cost centers and project budgets, it becomes much easier to rank energy efficiency projects and see where capital spending can cut the most carbon per dollar. That’s where a platform starts to matter in day-to-day business decisions, not just annual reporting.
Scope 3 data from procurement and supply chain modules can also point to high-emitting hotspots. That gives teams a clearer path for supplier engagement. In one automotive supplier example, annual ESG assessments of 200 key suppliers found that 28% needed environmental management improvements; focused training and material changes cut carbon emissions by 12% across the supply base [5].
That is where platform data becomes operational. Council Fire helps turn platform outputs into decarbonization pathways, stakeholder-centered planning, and investment decisions.
Conclusion: What to Prioritize First
Start with governance. Then move to benchmarking. After that, build planning on top of both.
Choose a platform for integration depth and assurance readiness, not for a long feature list. Set it up with disciplined data ownership and role-based controls. Once reporting is stable, shift attention to optimization: intensity benchmarking, outlier management, and linking ESG data to the decisions that move performance forward.
Organizations that follow this path move beyond compliance-led reporting. They build a system that improves accountability, guides capital allocation, and supports long-term sustainability value.
FAQs
When should we move beyond spreadsheets?
Move past spreadsheets once manual work stops keeping up with the volume, complexity, or assurance demands of your reporting.
As reporting frameworks grow and assurance expectations tighten, dedicated software shifts from a nice-to-have to a must-have. Spreadsheets simply don't offer key controls such as audit trails, role-based access, and automated validation. A centralized platform gives teams a faster path to reporting, can cut assurance costs, and supports better decisions.
What should we set up before choosing a platform?
Before you pick a platform, get clear on the decision it needs to improve. Don’t shop by broad category names. Start with the immediate goal instead: disclosure, emissions reduction, supplier assessment, or risk management. That changes the conversation from “Which tool looks best?” to “Which tool helps us act on the thing that matters most right now?”
At the same time, put the data groundwork in place. Run a materiality assessment, map the metrics you need back to the source systems that hold them, and assign clear ownership for each data set. If no one owns the data, things slip fast.
Council Fire can help build this data architecture, put governance policies in place, and get your team ready for assurance.
How long does ESG platform implementation usually take?
ESG platform implementation usually takes about 12 months from start to finish. In most cases, the work begins with a 2-month assessment to map the current state and spot gaps early.
From there, teams often spend 3 months on architecture and governance planning. That phase sets the rules, data structure, and ownership model before the heavier build work starts.
Deployment, integration, and data migration tend to fall in months 6–8. After that, the focus shifts to testing, dry-run reporting, and assurance readiness during months 9–12. For larger enterprise projects, the timeline can stretch beyond a year.
Related Blog Posts
Latest Articles
©2026
Narrative Change and Power Building: The Missing Half of Advocacy
Narrative change is the process of disrupting dominant narratives that normalize inequity and advancing new narratives from historically marginalized communities.
Funding Resilience Without Federal Grants
BRIC is unreliable and FEMA is shrinking. Here's how cities fund climate resilience with dedicated revenue, blended finance, and a coordinating authority.
The ESG Blind Spot: How AI Is Finding Risks in Companies Nobody Else Is Watching
Norway's sovereign wealth fund uses AI to screen 7,200 portfolio companies for forced labor and corruption within 24 hours. The real story is the emerging-market coverage gap that traditional ESG data vendors miss — and what it means for any company with a global supply chain.
FAQ
01
What does it really mean to “redefine profit”?
02
What makes Council Fire different?
03
Who does Council Fire work with?
04
What does working with Council Fire actually look like?
05
How does Council Fire help organizations turn big goals into action?
06
How does Council Fire define and measure success?
07
How does technology fit into Council Fire’s work?
Jul 21, 2026
Ultimate Guide to ESG Cloud Platforms
ESG Strategy
In This Article
Choose, implement, and use ESG cloud platforms for governed data, audit-ready reporting, and actionable decarbonization.
Ultimate Guide to ESG Cloud Platforms
About 50% of organizations still track ESG in spreadsheets - and that breaks down fast once reporting, audit checks, and multi-site data get involved.
If I had to sum up this guide in a few lines, I’d say this: an ESG cloud platform gives you one place for data, controls, calculations, dashboards, and reporting. It helps you move from scattered files to a system with user permissions, sign-offs, change logs, framework mapping, and reports tied back to source records.
Here’s the short version of what matters most:
Start with sustainability consulting and governance, not software. I’d define data owners, approval steps, KPI definitions, and reporting boundaries before comparing vendors.
Move past spreadsheets when audit trails matter. File version issues, broken formulas, and weak traceability become a bigger risk as reporting rules tighten.
Check the core workflow: ingest data, validate it, store it, calculate metrics, and produce reports.
Review security early. Look for RBAC, SSO, MFA, encryption, logs, SOC 2 Type II, and ISO 27001.
Pick for fit, not feature count. I’d test integrations, user experience, Scope 3 support, multi-entity setup, and auditor-facing records with my own data.
Treat setup like a reporting program. Scope the entities, map source systems, migrate clean history, assign owners, train users, and track submission and exception rates.
Use the platform for more than reports. Once data is stable, I’d use it for intensity metrics, site benchmarking, outlier alerts, supplier follow-up, and planning tied to budgets and cost centers.
A few facts in this guide stand out:
About 50% of organizations still use spreadsheets for ESG tracking.
A common first migration target is the most recent two years of history.
One example showed revenue-normalized Scope 1 emissions intensity falling 65%, from 4.0 to 1.4 tCO₂e per $1,000,000 in revenue.
In another case, work with 200 suppliers found 28% needed better management steps, and focused action cut carbon emissions by 12% across the supply base.
If you’re selecting a platform, I’d keep my review centered on a short checklist: data inputs, controls, audit trail depth, framework mapping, security records, Scope 3 handling, dashboards, and implementation support. That gives you a clearer path than relying on demos alone.
This guide, in short, shows how to pick, set up, and use an ESG cloud platform so your data can support reporting, assurance, benchmarking, and planning.
How to Master ESG Compliance: Scalable, Automated, and Audit-ready (walkthrough)
How ESG Cloud Platforms Work
ESG Cloud Platform: From Raw Data to Reliable Reporting
An ESG cloud platform is a governed pipeline that moves data from source systems to validated disclosures. That pipeline only holds up when governance is built into every step.
Core Architecture: Data Inputs, Storage, Analytics, and Reporting
The architecture follows a simple flow: ingest, store, calculate, report. At the ingestion layer, the platform pulls data from ERP, HR, utility, supplier, facilities, and IoT systems through API, SFTP, or native integrations. Incoming data first lands in a staging layer, where the system checks for completeness and format before anything is loaded.
From there, the validated data moves into a cloud data store. Records are organized by entity, such as facility, legal entity, supplier, or reporting period. Metadata tracks where each record came from and what happened to it along the way. A calculation engine then applies emission factors, intensity formulas, and allocation rules, including GHG Protocol-compliant scope 1, 2, and 3 calculations.
The analytics layer turns that data into dashboards, scorecards, and benchmarks that teams can filter by region, business unit, or time period. At the output layer, the platform produces structured disclosures aligned with frameworks such as GHG Protocol, GRI, SASB, and ESRS, along with investor questionnaires, regulatory filings, and internal management reports. Exports are usually available in PDF, Word, or machine-readable formats like XBRL.
The next piece is control: who owns the data, who approves it, and how every change is tracked.
Key Functions: Data Governance, Framework Mapping, and Audit Trails
Raw data has little value without controls around it. ESG cloud platforms build governance into the workflow itself. Each dataset - whether it's a facility's energy use, a scope 3 category, or a diversity metric - gets a data owner who is responsible for quality and sign-off. Validation rules flag problems early, including missing fields, values outside allowed ranges, and year-over-year changes that don't look right. Those exceptions appear in data quality dashboards so owners can review and fix them before the data moves ahead.
Approval workflows often look a lot like financial close processes. Data moves through stages such as draft, submit, review, approve, and lock, with role-based sign-offs at each point. Once a period is locked, any correction has to go through an approved workflow that keeps the old value and records the change. That's what makes the data assurance-ready. An auditor can trace any reported figure back through approval steps, transformation rules, and source records, including attached invoices, meter readings, or supplier declarations.
Framework mapping sits above that governed dataset. Platforms keep taxonomies for GHG Protocol, GRI, SASB, and ESRS, then map internal indicators to each framework's disclosure rules. For multinational organizations, this matters a lot. The same source data can support both U.S. investor reporting needs and EU requirements under CSRD, without forcing teams to build separate datasets from scratch.
Once the data model and workflows are in place, the platform still needs strong enterprise access controls and logging.
Security and Compliance Requirements
Enterprise ESG platforms should meet the same security standard as other critical business systems. Role-based access control (RBAC) lets administrators limit visibility by business unit, region, facility, and data domain. In plain terms, HR data should not be visible to facilities managers, and supplier files should not be open to everyone with a login. Single sign-on (SSO) with corporate identity providers helps keep access tied to existing credentials and multi-factor authentication policies.
Data should be encrypted at rest and in transit, and all access and administrative activity should be logged for security monitoring. Public-sector and regulated organizations may also need FedRAMP or NIST alignment. When reviewing vendors, organizations should ask for current SOC 2 Type II reports and ISO 27001 certificates, check for any noted exceptions, and confirm exactly which services and environments are covered by the audit scope.
Security Feature | What to Look For |
|---|---|
Access control | Role-based permissions by entity, region, and data domain |
Authentication | SSO integration with MFA via SAML or OAuth |
Encryption | At-rest and in-transit encryption for all data |
Audit logging | Immutable logs of access, changes, and approvals |
Compliance documentation | SOC 2 Type II report, ISO 27001 certificate, and documentation of covered services and environments |
How to Evaluate and Select an ESG Cloud Platform
Picking an ESG cloud platform from a feature checklist alone is a good way to end up with too much software or not enough of it. The better choice is the platform that matches your reporting scope and the way your team actually works.
Define Requirements Before Reviewing Products
Start with the data flows and controls you’ve already mapped. Use them to set your selection criteria before you look at products.
First, pin down the basics: reporting drivers, in-scope entities, emissions scopes, and the ESG metrics that matter most. Be clear on why you’re making the investment. Is it driven by regulatory compliance, such as SEC climate disclosures or other reporting rules? Is it coming from investor and lender pressure, customer RFPs, or internal goals like net-zero targets or DEI commitments?
Then define what sits inside the boundary. That might mean U.S. operations only, global operations, joint ventures, or franchisees. From there, decide which emissions scopes you need to measure. Scope 1 and Scope 2 are often where teams begin. Scope 3 changes the game because it brings in supplier workflows, richer data models, and scenario analysis.
Emissions are only part of the picture. You also need a clean map of workforce and governance metrics such as board diversity, safety rates, training hours, and turnover. For each metric, trace it back to the source system that owns it today, whether that’s your HRIS, EHS platform, or finance system. Then map each metric to its source system and current approval path. That inventory helps you define integrations, ownership, and reporting cutoffs.
Those operating patterns should shape the approval chains and role assignments you set up in the platform. If contributors are entering data across more than one time zone, check for support for time-zone cutoffs and local date formats. That sounds like a small detail until quarter-end hits and teams are looking at different reporting windows.
Selection Criteria: Integration, Usability, Scalability, and Assurance Readiness
Test your requirements with your own data, not polished vendor samples. Ask for a proof of concept that uses your actual entity hierarchy, one or two live data sources, and one indicator calculated end to end. That’s where integration gaps and workflow friction tend to show up.
On integration, look past the sales pitch. Ask for documented REST APIs, supported authentication methods such as OAuth 2.0 and SAML, and pre-built connectors for the systems you already use, including SAP, Oracle, Workday, and energy management or utility data sources.
Usability matters just as much. Bring real users into the demo process: facility managers, HR analysts, and finance controllers. Score each platform on how well it guides non-technical contributors through data entry, task management, and approvals. People won’t sign off on numbers they don’t trust, so calculation logic needs to be visible. Contributors should be able to see how emissions were derived, including activity data, emission factors, and assumptions.
For assurance readiness, ask vendors to show the auditor view. You want to see lineage, source evidence, methodology notes, and version control. Then check scalability. Make sure the platform can handle multi-entity structures without forcing you into separate instances, supports multiple currencies, and can take on new Scope 3 categories or framework updates without a costly re-implementation.
This is also the point where you test whether the platform can do more than annual reporting. It should support long-term decarbonization work and stakeholder planning too. If it can’t help with capital allocation or supplier engagement, you may outgrow it fast. Pick the platform that can support setup, ownership, and reporting discipline across the business.
Comparison Table for Internal Platform Review
Use this table to score vendors with objective evidence from demos, documentation, and reference checks.
Capability Category | What to Evaluate |
|---|---|
API Integrations | Documented REST APIs, pre-built connectors for ERP (SAP, Oracle), HRIS (Workday), and energy management or utility data sources; read/write access and webhook support |
Scope 3 Support | Coverage of key categories, supplier data collection tools, ability to use both primary and secondary emission factors |
Workflow Controls | Configurable approval chains, role-based task assignments, automated reminders, and multi-step sign-offs |
Audit Trail Detail | Granular logs of every data change with user ID, timestamp, version history, and source document linking |
Dashboarding | Drill-down by facility, region, business unit, and reporting period; executive summaries and operational views; export options |
Security Documentation | Current SOC 2 Type II report, ISO 27001 certificate, penetration testing cadence, and U.S.-based data residency |
Implementation Support | U.S. time zone onboarding, structured training programs, professional services for complex multi-entity setups |
Strategic Fit | Score whether the platform supports decarbonization, circularity, or stakeholder planning |
Use the scorecard to define implementation scope, ownership, and controls.
Implementation: From Setup to Reliable Reporting
Implementation is an operating program, not a software install. Start by defining scope, set up controls, and then build reporting routines people can follow without friction.
Scope the Program and Prepare the Data
Before you load anything into the platform, draw the reporting boundary clearly. Decide which entities, geographies, and business units are in scope. Spell out which ESG frameworks or customer requirements the system needs to meet on day one. A solid implementation plan should also lock in the baseline year, reporting cadence, and the historical data needed to keep comparisons consistent over time.
Next, do a source-system inventory. Trace every metric back to where it starts - whether that’s your ERP, HRIS, utility bills, travel systems, fleet management tools, EHS databases, or procurement platforms. This step shows where integrations are needed, where manual entry can’t be avoided, and where data quality problems are most likely to show up.
For historical data, keep it simple. A common recommendation is to migrate the most recent two years first [2]. That gives you enough history for trend analysis without bogging down the first rollout. Older archives can come later, once the core workflows are steady. Before moving any data, clean and normalize it. Standardize units, entity names, currencies, and estimates before import.
That groundwork speeds up workflow design and cuts down on rework later.
Configure Workflows, Ownership, and Controls
Each major ESG data stream needs a named owner, a preparer, and an approver, all documented in a RACI-style model. Sustainability teams usually coordinate methodology, but finance, facilities, HR, procurement, and operations own the upstream activity data. Clear ownership cuts rework and makes it much easier to see who checked each figure and when.
Set collection cycles that match how the business already runs. Monthly or quarterly cycles fit most operational metrics, while annual cycles may be enough for some disclosures. Build approval workflows with validation rules, required fields, and version control.
Exception handling needs its own written process. If data is missing, late, or unverified, the platform should flag it at once and route it to the right owner - not quietly mix it in with verified figures. Estimated values should carry a confidence flag, a documented estimation method, and a reconciliation date. That keeps reporting clear and helps stop weak inputs from being mistaken for verified performance.
Every KPI also needs a written definition, including:
Formula
Source
Unit
Cadence
Framework mapping
Measurement basis
This keeps different business units from calculating the same metric in different ways and makes assurance much easier.
With roles, controls, and definitions in place, the next job is getting people to use the system well.
Train Contributors and Manage Organizational Change
Generic system training rarely sticks. Role-based training usually does, because each user group works with the platform in a different way.
Training should match each user’s role in the reporting cycle.
User Group | Training Focus |
|---|---|
Sustainability teams | Methodology, framework mapping, reporting workflows, exception review |
Finance staff | Controls, sign-off logic, escalation paths |
Facilities & procurement | Simple, repeatable data-entry instructions, task management |
Executive reviewers | Dashboard interpretation, trend analysis, escalation points |
Short, process-specific sessions and job aids tend to work better than one-off system demos. For multinational teams, training in local languages helps a lot. Adoption also improves when the platform fits into existing business rhythms - monthly close, facilities reviews, procurement scorecards - instead of being treated like a separate sustainability side project.
After launch, run recurring governance reviews to check data completeness, late submissions, approval bottlenecks, unresolved exceptions, and methodology changes. Track a small set of implementation KPIs, such as:
On-time submission rates
Percentage of metrics with complete audit trails
Number of open exceptions
Time to close the reporting cycle
Once those routines are steady, the same data can support benchmarking and decarbonization planning.
Optimization: Using ESG Cloud Platforms for Performance, Planning, and Long-Term Value
Once ownership, controls, and reporting cadence are set, the next step is to use that data to manage performance, not just report it. The same governed inputs - defined metrics, named owners, and documented methodologies - can support benchmarking, planning, and day-to-day decision-making.
Track Performance With Better Metrics and Benchmarking
Raw totals only tell part of the story. Intensity metrics give you a cleaner view of performance, especially when you’re comparing sites with different sizes, output levels, or revenue bases. Configure your platform to calculate ratios such as tCO₂e per $1,000,000 in revenue, energy use per square foot, or waste generated per unit of output. That makes cross-site comparison far more useful.
Internal benchmarking works best when it is built around peer groups. A U.S. distribution center should be compared with other U.S. distribution centers. A North American manufacturing plant should be measured against similar plants in that region. From there, compare each entity against medians and quartiles for energy intensity, water use, injury rates, and other key indicators [3].
It also helps to set outlier alerts. If water use jumps without a clear reason, or if safety metrics start slipping, the platform should flag it and send it to the manager who owns that metric for review [1]. That kind of alerting turns reporting into action.
One portfolio ESG benchmarking report showed why this matters: revenue-normalized Scope 1 emissions intensity fell from 4.0 to 1.4 tCO₂e per $1,000,000 in revenue, a 65% reduction [4]. Raw totals might miss that story. Intensity data shows it plainly.
Use those benchmark results and outlier alerts to decide where investment should go next and where supplier action is needed.
Connect Platform Data to Decarbonization and Stakeholder Planning
When emissions data is tied to cost centers and project budgets, it becomes much easier to rank energy efficiency projects and see where capital spending can cut the most carbon per dollar. That’s where a platform starts to matter in day-to-day business decisions, not just annual reporting.
Scope 3 data from procurement and supply chain modules can also point to high-emitting hotspots. That gives teams a clearer path for supplier engagement. In one automotive supplier example, annual ESG assessments of 200 key suppliers found that 28% needed environmental management improvements; focused training and material changes cut carbon emissions by 12% across the supply base [5].
That is where platform data becomes operational. Council Fire helps turn platform outputs into decarbonization pathways, stakeholder-centered planning, and investment decisions.
Conclusion: What to Prioritize First
Start with governance. Then move to benchmarking. After that, build planning on top of both.
Choose a platform for integration depth and assurance readiness, not for a long feature list. Set it up with disciplined data ownership and role-based controls. Once reporting is stable, shift attention to optimization: intensity benchmarking, outlier management, and linking ESG data to the decisions that move performance forward.
Organizations that follow this path move beyond compliance-led reporting. They build a system that improves accountability, guides capital allocation, and supports long-term sustainability value.
FAQs
When should we move beyond spreadsheets?
Move past spreadsheets once manual work stops keeping up with the volume, complexity, or assurance demands of your reporting.
As reporting frameworks grow and assurance expectations tighten, dedicated software shifts from a nice-to-have to a must-have. Spreadsheets simply don't offer key controls such as audit trails, role-based access, and automated validation. A centralized platform gives teams a faster path to reporting, can cut assurance costs, and supports better decisions.
What should we set up before choosing a platform?
Before you pick a platform, get clear on the decision it needs to improve. Don’t shop by broad category names. Start with the immediate goal instead: disclosure, emissions reduction, supplier assessment, or risk management. That changes the conversation from “Which tool looks best?” to “Which tool helps us act on the thing that matters most right now?”
At the same time, put the data groundwork in place. Run a materiality assessment, map the metrics you need back to the source systems that hold them, and assign clear ownership for each data set. If no one owns the data, things slip fast.
Council Fire can help build this data architecture, put governance policies in place, and get your team ready for assurance.
How long does ESG platform implementation usually take?
ESG platform implementation usually takes about 12 months from start to finish. In most cases, the work begins with a 2-month assessment to map the current state and spot gaps early.
From there, teams often spend 3 months on architecture and governance planning. That phase sets the rules, data structure, and ownership model before the heavier build work starts.
Deployment, integration, and data migration tend to fall in months 6–8. After that, the focus shifts to testing, dry-run reporting, and assurance readiness during months 9–12. For larger enterprise projects, the timeline can stretch beyond a year.
Related Blog Posts
Latest Articles
©2026
Narrative Change and Power Building: The Missing Half of Advocacy
Narrative change is the process of disrupting dominant narratives that normalize inequity and advancing new narratives from historically marginalized communities.
Funding Resilience Without Federal Grants
BRIC is unreliable and FEMA is shrinking. Here's how cities fund climate resilience with dedicated revenue, blended finance, and a coordinating authority.
The ESG Blind Spot: How AI Is Finding Risks in Companies Nobody Else Is Watching
Norway's sovereign wealth fund uses AI to screen 7,200 portfolio companies for forced labor and corruption within 24 hours. The real story is the emerging-market coverage gap that traditional ESG data vendors miss — and what it means for any company with a global supply chain.
FAQ
What does it really mean to “redefine profit”?
What makes Council Fire different?
Who does Council Fire work with?
What does working with Council Fire actually look like?
How does Council Fire help organizations turn big goals into action?
How does Council Fire define and measure success?
How does technology fit into Council Fire’s work?