In This Article
SROI fits stakeholder outcomes; CBA fits societal cost–benefit—align scope, valuation, and assumptions before comparing ratios.
SROI vs. Cost-Benefit Analysis: Social Value Methods
I’d choose SROI to understand stakeholder outcomes and CBA to compare society-wide costs and benefits - not to chase the highest ratio. A reported return of $3 per $1 does not, by itself, prove that a program caused the change or outperforms another option.
Here’s how I’d frame the choice:
SROI: Start with people’s experiences, value their outcomes, and adjust for changes that would have happened anyway or came from other sources.
CBA: Compare alternatives against a baseline, value resource use and outcomes, and calculate net present value and a benefit-cost ratio.
Both: Check outcome selection, monetary values, discount rates, time horizons, spillovers, and who gains or loses. Test how results change under different assumptions.
Quick Comparison
| Criterion | SROI | CBA |
|---|---|---|
| Main use | Learning, accountability, and impact management | Comparing options and allocating resources |
| Starting point | Stakeholder outcomes | Decision, alternatives, and baseline |
| Valuation | Financial proxies for outcomes | Market and nonmarket values tied to societal welfare |
| Impact checks | Deadweight, attribution, displacement, and drop-off | Incremental effects against the baseline |
| Main results | Adjusted value-to-investment ratio and narrative | Net present value, benefit-cost ratio, and distribution of gains and losses |
| Time and scope | Defined populations, spillovers, duration, and discounting | Defined populations, spillovers, duration, and discounting |
My rule: <u>compare assumptions before comparing ratios</u>. Use both methods when you need stakeholder learning and an investment decision, but keep their questions and findings clear.
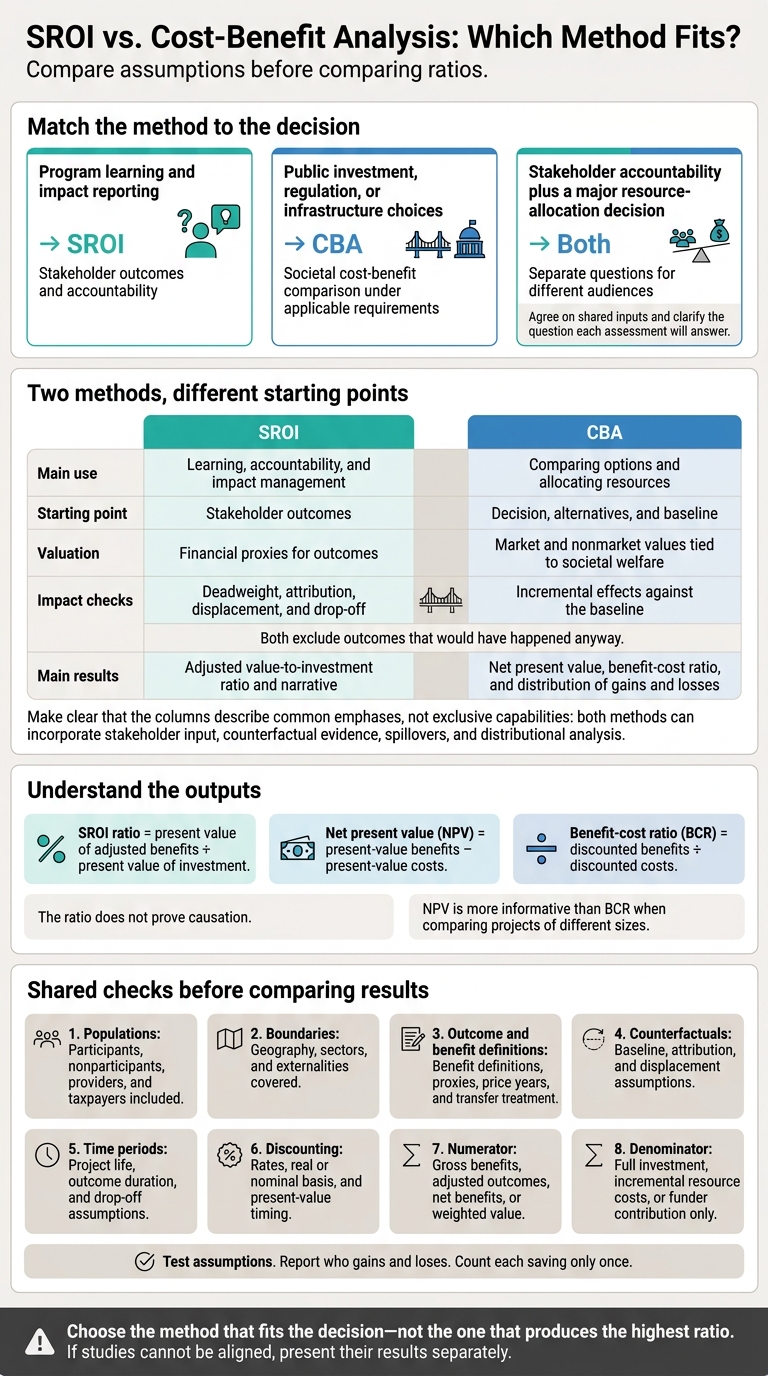
SROI vs. Cost-Benefit Analysis: Which Method Fits?
Social Return On Investment (SROI) | BLG Data Research Centre
sbb-itb-8baf5f1
How SROI and Cost-Benefit Analysis Work
Both methods translate outcomes into money. They differ in whose outcomes count, how they assign value, and how they adjust for effects.
SROI: Stakeholder Outcomes and Impact Adjustments
Social Return on Investment (SROI) assesses how an intervention changes outcomes for stakeholders. Interviews, surveys, records, and focus groups help build a theory of change that links inputs and activities to outputs and outcomes. Select material outcomes, then assign financial proxies to estimate their value. These proxies do not have to reflect market prices.[7][4][5]
SROI adjusts those estimates for deadweight (change that would happen anyway), attribution (others’ contributions), displacement (gains that cause losses elsewhere), duration (how long an outcome lasts), and drop-off (the decline in outcome value over time). Base these adjustments on comparison groups, historical data, stakeholder evidence, or sensitivity analysis - not an automatic assumption of zero.[8][9]
SROI ratio = present value of adjusted benefits ÷ present value of investment. Investment includes both financial and in-kind inputs. Discount future values consistently, and test alternative proxies and impact adjustments. The ratio does not prove causation.[11] This distinction matters most when studies count different people, places, or spillover effects.
CBA: Societal Costs, Benefits, and Alternatives
CBA uses the same monetary logic but shifts the focus from stakeholder outcomes to total social welfare.
Cost-benefit analysis (CBA) estimates whether an intervention improves overall welfare compared with one or more alternatives. It expresses society-wide costs and benefits in monetary terms. Start by defining the project, options, baseline, and counterfactual outcomes. Then set the analysis boundary: whose effects count, across what area, and over what period.[6][10][13]
Value resources at their opportunity cost - the value of their next-best use. Use market prices when suitable. Where prices are missing, use nonmarket methods such as stated preferences, revealed preferences, or benefit transfer. Stakeholder input helps identify overlooked outcomes and nonmarket effects, but CBA still values them within a common welfare framework.[6][10][13]
CBA discounts future costs and benefits to present values. Net present value (NPV) = present-value benefits − present-value costs; benefit-cost ratio (BCR) = discounted benefits ÷ discounted costs. A positive NPV indicates estimated net benefits under the stated assumptions. NPV is more informative than BCR when comparing projects of different sizes.[2]
Report who gains and who loses. A budget perspective differs from a societal perspective, and distributional reporting shows which groups bear costs even when the intervention produces a net benefit overall.[12][13]
SROI vs. CBA: Key Differences
Study design often matters more than the method’s name.[15][17] In practice, the differences between SROI and CBA depend on study scope: what gets counted, how it is valued, and how future costs and benefits are discounted.
| Dimension | SROI: common practice | CBA: common practice |
|---|---|---|
| Purpose and starting point | Support accountability, learning, and impact management, starting with stakeholder experiences | Compare alternatives and test economic efficiency, starting with the decision and baseline |
| Outcome selection | Stakeholder-defined material outcomes | All incremental costs and benefits within the chosen perspective |
| Stakeholder roles | Central to identifying and understanding change | Inform scope, evidence, and distributional analysis |
| Valuation | Financial proxies | Adjusted market prices, revealed or stated preferences, and shadow prices |
| Counterfactuals | Estimate change without the intervention | Model the baseline without the project |
| Deadweight and attribution | Often shown as separate adjustments | Usually included in incremental estimates |
| Displacement and spillovers | Examined through stakeholder mapping and impact adjustments | Examined through indirect effects and externalities |
| Discounting | Follows the chosen guidance | Usually follows public-appraisal guidance |
| Distributional analysis | Tracks which stakeholders experience outcomes | Examines how gains and losses are distributed |
| Outputs | Adjusted social-value ratio and narrative | Net present value (NPV), benefit-cost ratio, and qualitative findings |
| Evidence requirements | Outcome data, proxy evidence, and impact assumptions | Causal evidence and valuation assumptions |
The biggest differences start with which outcomes count and how they are priced.
Selecting Outcomes and Assigning Monetary Values
Each dollar value needs a clear meaning: does it reflect stakeholder-perceived value or societal opportunity cost? Keep an outcome register that links each affected group to its indicator, evidence, valuation source, and timing.
Avoided spending is not total social value. Counting that spending alongside the outcome it replaces inflates the estimate.[15][16]
| Valuation issue | SROI emphasis | CBA emphasis |
|---|---|---|
| Value sources | Preference evidence, comparable transactions, and cost-based proxies | Adjusted market prices, revealed or stated preferences, and shadow prices |
| Main limitations | Proxies may not closely match the outcome or population | Prices and preference estimates may miss externalities, equity, or nonuse value |
Discount Rates, Time Horizons, and Price Assumptions
Match real dollars with a real discount rate and nominal dollars with a nominal rate. For U.S. public appraisal, use the agency guidance in force for the study - not a generic federal rate.
Show undiscounted annual flows, then test justified alternative rates and benefit durations. This matters especially for long-lived environmental outcomes.[13][14][19]
| Assumption | What either method should disclose |
|---|---|
| Rate selection | Rate, real or nominal basis, and applicable agency or framework guidance |
| Analysis period | Start and end dates, including construction, operating, and post-program periods |
| Benefit persistence | Outcome duration, supporting evidence, and annual drop-off |
| Price assumptions | Valuation date, price year, and constant versus current dollars |
| Timing and sensitivity | When flows occur, treatment of partial years, and results under alternative rates, durations, and values |
Scope also determines whose gains and losses enter the analysis, including those beyond direct participants.
Effects Beyond Participants: Who Gains and Loses
Both methods can assess effects beyond participants, but neither does so automatically. Spillovers count only when the study boundary includes them. Record each effect’s direction, size, timing, and supporting evidence. Keep qualitative findings when monetary valuation cannot be supported.[3][17][18]
| Effect to investigate | Identification and valuation approach | Distribution to report |
|---|---|---|
| Household spillovers | Measure caregiving time and burden; check for overlap | Participants and household members separately |
| Taxpayer and public-service effects | Separate resource savings from transfers and budget effects | Agencies, taxpayers, and service users |
| Ecological externalities | Value emissions, pollution, and habitat changes | Affected places, populations, and ecosystems |
| Community effects | Assess neighborhood and local business changes | Residents and businesses, including nonparticipants |
| Shifted harms | Investigate displaced employment, activity, or pollution | Groups gaining benefits versus those receiving harms |
| Future generations | Track long-term outcomes and uncertainty | Current versus future beneficiaries and cost bearers |
Transfers differ from resource savings. A transfer can help one group and cost another without producing a net societal resource gain. Report these budget and equity effects separately, alongside real changes in labor, services, energy, or environmental damage.
Where data and privacy protections allow, break out gains and losses by income, age, disability, and geography.[16][20] These scope choices also shape what the methods share and whether their results can be compared.
What SROI and CBA Have in Common
Both methods ask the same core questions: What changed, what did the intervention cause, and what is that change worth? SROI’s deadweight and CBA’s incremental analysis serve the same purpose: excluding outcomes that would have happened anyway. Both require transparent assumptions, documented sources, and sensitivity checks. The same intervention can therefore produce different results when study scopes differ.
How Study Scope Changes Results
Once the valuation method is set, scope drives most differences in results. The table below shows how study choices affect each analysis. Broader boundaries can reveal harms, while longer time horizons can add liabilities. Stronger counterfactual evidence may reduce claimed impact while making the findings better supported.
| Study-scope choice | Effect on SROI results | Effect on CBA results |
|---|---|---|
| Stakeholders or affected populations | Including more groups can increase or decrease the ratio | Including more groups can increase or decrease NPV |
| Outcome definitions | Omitted outcomes can understate value; overlapping proxies can inflate it | Omitted benefits or costs can distort option comparisons |
| Baseline and counterfactual | Better-supported deadweight estimates can increase or decrease claimed impact | A stronger without-project case can change net benefits and the preferred alternative |
| Valuation | Different proxy values can materially change the ratio | Different economic values can change NPV |
| Attribution | Greater attribution deductions reduce estimated value | Excluding effects caused by other factors changes incremental benefits |
| Displacement and substitution | Displaced effects can reduce or eliminate claimed value | Substitution costs or lost benefits can lower NPV |
| Geography | Broader boundaries reveal more externalities | Broader boundaries reveal more externalities |
| Time horizon | Longer horizons can add both benefits and liabilities | Longer horizons can add both benefits and liabilities |
| Discount rate | Higher rates reduce the present value of later outcomes | Higher rates reduce the present value of later outcomes |
| Data quality | Weak data can produce unstable or overstated ratios | Weak data can change option rankings and increase NPV uncertainty |
| Distributional weights, where used | Weighting gains and losses across groups can change the ratio | Weighted NPV can differ from unweighted NPV |
Test the largest drivers together and individually: participant numbers, outcome size, deadweight rate, attribution, displacement, proxy values, duration, discount rate, and implementation cost. Report a central estimate alongside plausible lower and upper cases. Switching-value analysis adds a useful decision check: how far must an assumption change before net value reaches zero or BCR equals 1.0?
When SROI and CBA Ratios Can Be Compared
Ratios can be compared only when both studies use the same scope and valuation rules. Check how each ratio is built - not just whether both express value per dollar. If the studies cannot be aligned, present them separately: SROI for stakeholder value and impact management, and CBA for comparing alternatives, NPV, and benefit-cost findings.
| Alignment check | What must match or be reconciled |
|---|---|
| Populations | Participants, nonparticipants, providers, and taxpayers included |
| Boundaries | Geography, sectors, and externalities covered |
| Outcome and benefit definitions | Benefit definitions, proxies, price years, and transfer treatment |
| Counterfactuals | Baseline, attribution, and displacement assumptions |
| Time periods | Project life, outcome duration, and drop-off assumptions |
| Discounting | Rates, real or nominal basis, and present-value timing |
| Numerator | Gross benefits, adjusted outcomes, net benefits, or weighted value |
| Denominator | Full investment, incremental resource costs, or funder contribution only |
Reporting choices can change a ratio without changing net value. Recording a genuine avoided cost as a benefit increases the numerator; recording that same saving as a cost reduction decreases the denominator. These conventions can produce different ratios while leaving the benefits-minus-costs total unchanged. Disclose the convention, count each saving only once, and distinguish resource savings from transfers before comparing results.
Conclusion: Match the Method to the Decision
Choose the method that fits the decision and its scope - not the one that produces the highest ratio. Let that decision guide outcome selection, monetary valuation, discounting, and how you account for effects beyond participants.
When to Use SROI, CBA, or Both
Use this table to match the method to the decision.
| Decision need | Best fit | Best use |
|---|---|---|
| Program learning and impact reporting | SROI | Stakeholder outcomes and accountability |
| Public investment, regulation, or infrastructure choices | CBA | Societal cost-benefit comparison under applicable requirements |
| Stakeholder accountability plus a major resource-allocation decision | Both | Separate questions for different audiences |
Run separate assessments when audiences, required methods, or affected populations differ materially, especially when decisions are costly or irreversible. Before commissioning both, agree on shared inputs and clarify the question each assessment will answer.
Then check whether the scope and assumptions support the findings.
Quality Checks Before Using Results
Before accepting the findings, check that the report includes:
[ ] Purpose and scope: An explicit decision, audience, and perspective, with clear geographic, population, and time boundaries.
[ ] Outcomes and evidence: Outcome changes supported by a counterfactual, with justified monetary valuations.
[ ] Impact adjustments: Treatment of deadweight, attribution, displacement, drop-off, and spillovers.
[ ] Who gains and loses: A separate account of gains and losses across groups, rather than aggregate results alone.
[ ] Time and money: Currency, price year, inflation treatment, nominal or real values, discount rate, timing, and outcome duration.
[ ] Reliability: Conservative, central, and optimistic cases, plus source data, formulas, and a reproducible workbook or code.
Treat the ratio as provisional until these checks are complete. Evidence and tradeoffs matter more than a high ratio. If plausible assumptions change the recommendation, state what would trigger a review.
FAQs
What if important outcomes can’t be valued in dollars?
Outcomes that are hard to price often get left out of standard analysis, hiding effects on social equity or community health. Financial proxies, such as the cost of services no longer needed or willingness-to-pay research, can help assign a dollar value.
When people disagree about assigning dollar values or data is limited, use workshops or focus groups to add context to the numbers. Pairing monetary estimates with qualitative findings shows more of the impact while making the limits of valuation clear.
How can I assess social value with limited data?
Use tools with sensitivity analysis to account for uncertainty. Pair available quantitative metrics with community surveys, interviews, and focus groups to reflect experiences that administrative records may miss. External databases, such as the Global Value Exchange, offer established financial proxies for outcomes without a market price.
Choose metrics that are feasible, actionable, and reliable without stretching resources. Use baseline trends to track progress over time.
What should I do if SROI and CBA suggest different decisions?
Use SROI and CBA together - they answer different questions. Start with CBA to assess fiscal feasibility and efficiency. Then use SROI to evaluate broader social and environmental outcomes [1].
When the results differ, use multi-criteria analysis (MCA) to rank options based on nonmonetary values the models may not fully capture, such as equity, safety, or community access. This helps weigh direct financial returns alongside social impacts [1].




FAQ