
Sep 13, 2026
Regional Supply Chain Finance Cases | Roundup
Sustainability Strategy
In This Article
Regional SCF: anchor buyers, blended capital, digital records, and ESG-linked instruments across food, manufacturing and transport.
Regional Supply Chain Finance Cases | Roundup
Supply chain finance is growing fast, but scale depends on structure, not just volume. In 2023, global SCF volume reached $2.184 trillion, yet the cases in this roundup point to a simpler truth: programs work when repayment is easy to track, risk is shared, and data is good enough for lenders to act.
If I were skimming this for the main takeaway, I’d boil it down to this:
Food chains often rely on buyer contracts, crop-payment deductions, warehouse receipts, and blended capital.
Manufacturing programs usually tie supplier funding costs to ESG scorecards and repeat orders.
Energy and transport deals tend to use bonds, public support, and concession-based funding tied to long-life assets.
The same roles keep showing up: anchor buyers, banks, public agencies, DFIs, and technical support partners.
The main blockers are also consistent: weak traceability, poor supplier onboarding, legal gaps, and unclear role splits.
What stood out to me is that the article is not about generic lending. It is about local supply chain relationships - who buys, who supplies, who lends, and how cash gets paid back in each region. That is why an Indonesia farm model looks different from a Hong Kong rail bond or a Brazil supplier-finance program, even when the goal is similar.
The short answer: regional SCF scales when five things are in place - anchor demand, shared risk, simple metrics, digital records, and supplier support.
Area | What drives repayment | Common funding setup | Main scale issue |
|---|---|---|---|
Food | Off-take contracts, crop proceeds, warehouse receipts | Blended funds, bank lines, DFI loans | Traceability and farmer data |
Manufacturing | Purchase orders, supplier scorecards | Bank-led SCF, sometimes with DFI support | Supplier drop-off and metric clarity |
Energy/Transport | Project cash flow, subsidies, concession terms | Green bonds, PPPs, concessional loans | Multi-party complexity and long timelines |
For a U.S. executive, the value here is plain: the tool should match the supply chain logic of the region, not the other way around.
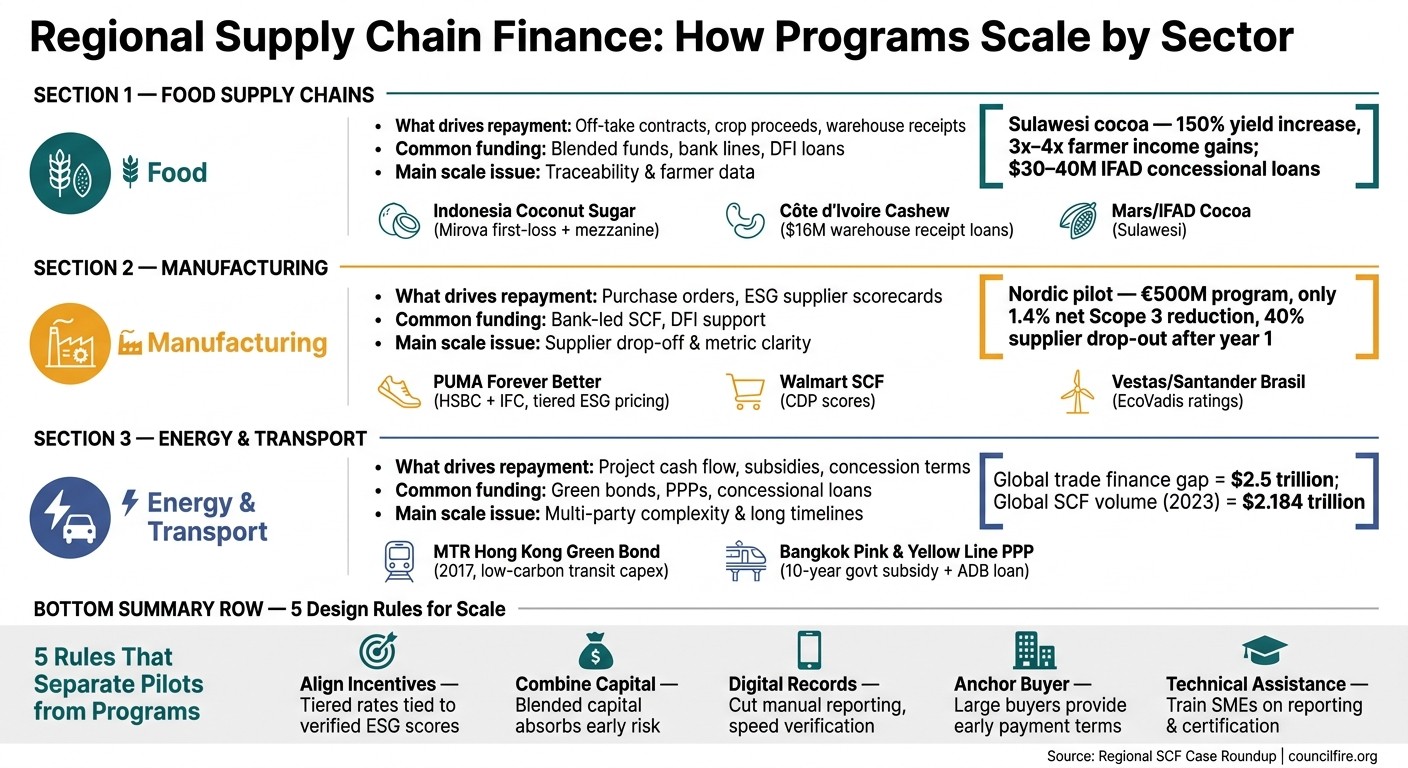
Regional Supply Chain Finance: Sectors, Instruments & Scale Factors
Supply Chain Finance
Food Supply Chains: Blended Finance and Smallholder Inclusion
These cases show how blended capital, contract-backed lending, and technical assistance can turn fragmented farm networks into financeable supply chains. The strongest models use buyer-backed supplier finance, warehouse receipts, and contract-based lending to turn crop sales into steady repayment streams.
Indonesia and West Africa Cases: Coconut, Cashew, and Supplier Finance
Indonesia's coconut sugar value chain shows how layered capital can make a fragmented smallholder network financeable. The Mirova Sustainable Land Fund 2 provided junior and first-loss capital at the fund level, paired with a mezzanine loan and targeted technical assistance (TA) to Big Tree Farms, an exporter sourcing coconut sugar from smallholder producers across rural Indonesia.[3][1][5] The structure worked because losses were stacked in a way that gave lenders more comfort. Repayment was built into the sourcing relationship, with loan installments deducted from crop proceeds before farmers received their net payments.
Côte d'Ivoire's cashew sector shows a different but related model. The country became the first francophone African country to adopt a warehouse receipts law, which allowed cashew stocks to serve as collateral and unlocked about $16 million in loans to processors and traders.[7] Processors drew on senior working capital lines backed by export contracts, while impact investors and development finance institutions (DFIs) supplied longer-tenor loans for plant upgrades and certification. A pilot tool called "Cash-flow let cashew flow" was developed to help lenders understand processor cash cycles and unlock more debt finance.[4] Large buyers anchored the structure through off-take agreements, and smallholders were included through cooperatives that handled input credit, quality training, and crop collection.
A coordinated program in Sulawesi, Indonesia's cocoa sector adds a third example. The structure combined government infrastructure investment, technology and price guarantees from Mars Inc., and concessional loans of $30 million to $40 million from IFAD.[6] The payoff was striking: yields increased by roughly 150%, and smallholders reported income gains of 3x to 4x. That happened because public, corporate, and multilateral capital were aligned around the same delivery model.
Lessons from the Food Cases on Scaling
Across these cases, a few patterns stand out. Contract-backed sourcing is the base layer. When a credible buyer commits to long-term off-take agreements and minimum price commitments, lenders have something concrete to underwrite.
First-loss capital works best when it is tightly aimed. It should cover the riskiest segments, such as new cooperatives and climate-vulnerable regions, while more established parts of the chain move toward commercial terms over time.
Technical assistance is part of the structure, not an add-on. Embedded TA in agronomy, financial management, and traceability helps programs hold quality as they expand. Without it, growth tends to get messy fast.
What changes by region is the enforcement tool. In Indonesia, it is off-take contracts. In Côte d'Ivoire, it is warehouse receipts. In Sulawesi, it is price guarantees.
Case | Commodity & Region | Capital Sources | Finance Instrument | Farmer Inclusion Mechanism | TA Intensity |
|---|---|---|---|---|---|
Big Tree Farms / Mirova | Coconut sugar, Indonesia | Blended first-loss + mezzanine facility | Cooperative sourcing, deduction-at-source repayment | High | |
Côte d'Ivoire Cashew | Cashew, West Africa | Local banks, DFIs, impact investors [7] | Working capital + warehouse receipt loans | Cooperative aggregation, input credit, price commitments | Medium |
Mars / IFAD Cocoa | Cocoa, Sulawesi, Indonesia | Government, Mars Inc., IFAD concessional loans ($30–$40M) [6] | Concessional loan + corporate price guarantee | Direct sourcing contracts, smallholder aggregation | High |
The common thread is not the commodity. It is the local structure that makes repayment visible. That is what gives lenders enough line of sight to fund supply chains that might otherwise look too fragmented or too risky.
The main scale constraint is traceability data. Digital farmer registries, mobile procurement tools, and geo-referenced farm mapping help lenders monitor exposure, measure impact, and repeat these programs across regions. Weak data systems slow underwriting and make replication harder. Put the data infrastructure in place early, and a pilot has a much better shot at growing into a larger program.
The same regional logic shows up in manufacturing, energy, and transport, where ESG data, sponsor strength, and public guarantees shape the financing structure.
Manufacturing, Energy, and Transport Cases: Sustainability-Linked Credit, Green Bonds, and PPP Structures
In manufacturing, energy, and transport, the anchor structure changes - ESG pricing grids, bond frameworks, or PPP concession agreements - but the job stays the same: cut lender uncertainty and line up incentives across the people involved. While the food cases leaned on off-take contracts and blended capital, these sectors depend more on ESG-linked pricing, bond rules, and public guarantees.
Manufacturing Cases: Supplier Finance Tied to ESG Performance
In manufacturing, repayment visibility usually comes from supplier scores and repeat purchase orders. That’s why sustainability-linked supply chain finance (SSCF) shows up so often. Buyers and banks cut supplier borrowing costs when verified ESG or emissions scores improve. Suppliers join a digital SCF platform, complete an independent ESG review such as EcoVadis or CDP, and get a lower rate if their score goes up.[8][11][2][12][13]
PUMA's Forever Better Vendor Financing Program, launched in 2016, is one of the clearest cases. PUMA, HSBC, and the IFC set up tiered pricing so suppliers with stronger environmental, health and safety, and social ratings pay lower interest rates on short-term working capital.[2] The IFC’s role also brought development finance into what would otherwise be a standard commercial trade finance product.
Other companies have followed a similar path. Vestas and Santander Brasil launched a sustainability-linked SCF program in August 2024 that uses EcoVadis ratings to set supplier credit terms, with a stated focus on local economic development in Ceará, Brazil.[11][18] Walmart's program with HSBC and CDP ties supplier rates to climate performance through CDP scores and progress toward science-based targets.[16]
Not every program works as planned. A Nordic industrial consortium ran a €500 million sustainability-linked SCF pilot aimed at 25% Scope 3 reductions by 2026 across 850 tier-1 suppliers. After 18 months, the result was only a 1.4% net reduction, and 40% of participating suppliers dropped out after the first year.[15] That gap says a lot. Lower pricing helps, but it doesn’t shift supplier behavior on its own. Clear onboarding and score transparency matter just as much.
Energy and Transport Cases: Green Bond and Climate Finance Packages
In energy and transport, repayment visibility comes less from receivables and more from assets, subsidies, and concession terms. These are long-life projects, so the funding tends to be bigger, slower-moving, and much more public-facing. The main tools are green bonds, concessional loans, and PPPs.[9][10][14]
The MTR Corporation in Hong Kong issued a green bond in 2017 and ring-fenced the proceeds for capital spending on low-carbon transport projects, including the Kwun Tong Line Extension.[17] That use-of-proceeds model keeps the money tied to clearly defined transit upgrades and makes project-level reporting easier.
The Bangkok Pink and Yellow Line monorail PPP shows where development finance fills a gap that green bonds alone can’t cover: demand uncertainty. The project included a 10-year government subsidy and an ADB loan with a longer-tenor tranche to bridge the period before ridership stabilized.[19] In plain terms, the financing structure gave the project time to grow into its demand profile.
In logistics, Ball Corporation and Coca-Cola Europacific Partners tested HVO-powered vehicles in UK logistics. That pilot produced emissions data that can help support lower-carbon freight finance.
Cross-Sector Comparison: Industrial, Energy, and Transport Programs
The main variable across these cases is the financing problem each tool is built to solve.
Case | Sector | Instrument | Stakeholder Structure | Capital Source | Sustainability Metric | Scaling Potential |
|---|---|---|---|---|---|---|
PUMA Forever Better Vendor Financing | Manufacturing | Sustainability-linked SCF | PUMA, HSBC, IFC, suppliers | Commercial bank + IFC | Environmental, health and safety, and social scores [2] | High - replicable across supplier bases |
Walmart Sustainable SCF | Manufacturing | Sustainability-linked SCF | Walmart, HSBC, CDP, suppliers | Commercial bank | CDP score, science-based targets [16] | High - standardized metrics enable scale |
Vestas / Santander Brasil SCF | Manufacturing | Sustainability-linked SCF | Vestas, Santander, suppliers | Commercial bank | Medium - regional rollout underway | |
MTR Hong Kong Green Bond | Transport | Green bond | MTR Corporation, institutional investors | Capital markets | Low-carbon transport capex [17] | Medium - depends on issuer access to capital markets |
Bangkok Pink & Yellow Line PPP | Transport | PPP + ADB concessional loan | Thai government, ADB, private operators | Public budget + multilateral | Ridership, modal shift [19] | Medium - complex multi-party structure |
Ball Corp / CCEP HVO Logistics | Transport | Corporate pilot | Ball Corp, Coca-Cola EP, logistics providers | Corporate funding | CO₂ reduction vs. diesel | Medium - pilot data supports scale |
Across these examples, the pattern is pretty clear. In manufacturing, the structure pushes suppliers through pricing and scorecards. In transport and energy, the structure backs long-lived assets through ring-fenced proceeds, subsidies, and risk-sharing. Those differences shape the design rules that determine whether a regional program stays a pilot or moves into broader deployment.
What Regional Programs Need to Scale
Across sectors, the same five design choices kept showing up. They were the difference between a pilot that looked good on paper and a program that could keep growing across a region.
5 Practical Design Rules
Across the cases, five design choices shaped whether regional programs could scale.
Design Rule | Practical Application | Scale Effect |
|---|---|---|
Align Incentives | Tiered rates tied to verified ESG scores | Decarbonization & Inclusion |
Combine Capital | Blended capital that absorbs early risk and unlocks private lending | Supplier Inclusion |
Digital Records | Digital records cut manual reporting and speed verification | Resilience & Decarbonization |
Anchor-Buyer | Large buyers providing early payment terms | Resilience & Inclusion |
Technical Assistance | Training SMEs on reporting and certification requirements | Inclusion & Decarbonization |
These rules sound simple, but putting them to work takes more than a checklist. Programs need the right capital structure, data systems that people will use, and clear agreement on who does what. That's where many pilots stall. The idea is solid, but the operating model never quite comes together.
Where Council Fire Fits
Council Fire works with governments, foundations, NGOs, and companies to turn sustainability goals into capital design, stakeholder roles, and implementation plans. For groups building or expanding regional supply chain finance programs, that kind of systems-level support can help move a strong pilot into a program built for scale.
Conclusion: Common Patterns Across Regional Supply Chain Finance Cases
Taken together, these cases show a shared operating model across regions. No matter the sector, the same deal types keep showing up: anchor-backed SCF, blended finance, sustainability-linked credit, green bonds, and PPPs.
But the structure alone doesn't make these programs work. The roles matter just as much, and they look strikingly similar from one market to the next. Anchor companies act as the commercial backbone through purchase commitments, off-take agreements, or early payment terms that give lenders confidence in future cash flows. Public institutions and development partners take on early-stage risk through guarantees, concessional tranches, technical assistance, and standard-setting. Local banks or partner financial institutions then originate and service the loans. That split of responsibilities is what makes regional programs bankable. ADB's Trade and Supply Chain Finance Program shows how this model can scale through partner financial institutions.[22][23]
One pattern stands out: the programs that can be repeated in new markets usually start with legal reform, stakeholder alignment, and a clear operating model, not with the loan itself.
Pricing can also shape behavior. Tiered pricing linked to verified performance can push suppliers to improve, but only if the metrics are simple, verifiable, and meaningful to suppliers.[8][24]
The scale of the opening is hard to ignore. The global trade finance gap is estimated at $2.5 trillion,[20][21] which helps explain why well-designed regional programs matter so much. The real test of scale is straightforward: programs grow when financial design, stakeholder roles, and measurable sustainability outcomes work together.
FAQs
What makes regional SCF scalable?
Regional SCF grows when the data backbone is solid, partners stay aligned, and financing can flex as the program matures. The shift from manual workflows to automated, data-led systems sharpens risk assessment and gives investors more confidence in what they’re funding.
Most programs begin with a pilot. That early phase gives teams room to test the model, work through reporting gaps, and sort out how each partner will share data and make decisions. From there, growth usually depends on a few core pieces: shared resources, standard governance, and blended finance tools that can support projects at different stages.
Council Fire helps shape these agreements so sustainability goals aren’t treated like side notes. They’re built into the long-term financial model from the start, where they can guide funding terms, partner roles, and program growth over time.
Why do SCF structures differ by sector?
SCF structures differ by sector because each industry runs on its own mix of cash flow needs, risk, and capital pressure. A manufacturer doesn’t face the same financing puzzle as a circular business or an energy developer, so the funding setup can’t be one-size-fits-all.
In manufacturing and agriculture, the focus often lands on supplier liquidity. These sectors commonly use reverse factoring to help suppliers get paid sooner without putting extra strain on the buyer’s working capital. It’s a practical fix when supply chains are tight and timing matters.
Circular models bring a different challenge. Financing has to deal with variable usage, refurbishment cycles, and assets that stay in use much longer than in linear models. That means the structure must make room for shifting revenue patterns and more careful asset tracking and valuation.
Energy projects tend to rely on blended finance because upfront costs are high and payback periods are longer. In those cases, mixing sources of capital can help spread risk and make projects easier to fund.
These structures also change based on how mature the partnership is, what kind of asset valuation is needed, and the local rules in play. In plain terms, the finance model has to fit the operating reality on the ground.
What usually blocks supplier participation?
Supplier participation often stalls for a simple reason: the work can feel too heavy. Administrative and technical burdens - especially collecting, formatting, and reporting detailed sustainability data - can turn a good idea into one more task suppliers have to squeeze into an already packed day. For small and medium-sized enterprises, that strain is even sharper. Many just don’t have the tools, staff time, or in-house know-how to handle these demands with ease.
Participation also tends to fall when the payoff isn’t clear. If suppliers see a pile of extra work but no plain operational gain or cost savings, interest fades fast. The same thing happens when a program asks them to learn unfamiliar systems instead of working through the platforms they already use. And when mandates take the place of a clear business case, suppliers are far less likely to stay engaged.
Related Blog Posts
Latest Articles
©2025

Narrative Change and Power Building: The Missing Half of Advocacy
Narrative change is the process of disrupting dominant narratives that normalize inequity and advancing new narratives from historically marginalized communities.

Funding Resilience Without Federal Grants
BRIC is unreliable and FEMA is shrinking. Here's how cities fund climate resilience with dedicated revenue, blended finance, and a coordinating authority.

The ESG Blind Spot: How AI Is Finding Risks in Companies Nobody Else Is Watching
Norway's sovereign wealth fund uses AI to screen 7,200 portfolio companies for forced labor and corruption within 24 hours. The real story is the emerging-market coverage gap that traditional ESG data vendors miss — and what it means for any company with a global supply chain.
Narrative Change and Power Building: The Missing Half of Advocacy
Narrative change is the process of disrupting dominant narratives that normalize inequity and advancing new narratives from historically marginalized communities.
Funding Resilience Without Federal Grants
BRIC is unreliable and FEMA is shrinking. Here's how cities fund climate resilience with dedicated revenue, blended finance, and a coordinating authority.
The ESG Blind Spot: How AI Is Finding Risks in Companies Nobody Else Is Watching
Norway's sovereign wealth fund uses AI to screen 7,200 portfolio companies for forced labor and corruption within 24 hours. The real story is the emerging-market coverage gap that traditional ESG data vendors miss — and what it means for any company with a global supply chain.
FAQ
01
What does it really mean to “redefine profit”?
02
What makes Council Fire different?
03
Who does Council Fire work with?
04
What does working with Council Fire actually look like?
05
How does Council Fire help organizations turn big goals into action?
06
How does Council Fire define and measure success?
Sep 13, 2026
Regional Supply Chain Finance Cases | Roundup
Sustainability Strategy
In This Article
Regional SCF: anchor buyers, blended capital, digital records, and ESG-linked instruments across food, manufacturing and transport.
Regional Supply Chain Finance Cases | Roundup
Supply chain finance is growing fast, but scale depends on structure, not just volume. In 2023, global SCF volume reached $2.184 trillion, yet the cases in this roundup point to a simpler truth: programs work when repayment is easy to track, risk is shared, and data is good enough for lenders to act.
If I were skimming this for the main takeaway, I’d boil it down to this:
Food chains often rely on buyer contracts, crop-payment deductions, warehouse receipts, and blended capital.
Manufacturing programs usually tie supplier funding costs to ESG scorecards and repeat orders.
Energy and transport deals tend to use bonds, public support, and concession-based funding tied to long-life assets.
The same roles keep showing up: anchor buyers, banks, public agencies, DFIs, and technical support partners.
The main blockers are also consistent: weak traceability, poor supplier onboarding, legal gaps, and unclear role splits.
What stood out to me is that the article is not about generic lending. It is about local supply chain relationships - who buys, who supplies, who lends, and how cash gets paid back in each region. That is why an Indonesia farm model looks different from a Hong Kong rail bond or a Brazil supplier-finance program, even when the goal is similar.
The short answer: regional SCF scales when five things are in place - anchor demand, shared risk, simple metrics, digital records, and supplier support.
Area | What drives repayment | Common funding setup | Main scale issue |
|---|---|---|---|
Food | Off-take contracts, crop proceeds, warehouse receipts | Blended funds, bank lines, DFI loans | Traceability and farmer data |
Manufacturing | Purchase orders, supplier scorecards | Bank-led SCF, sometimes with DFI support | Supplier drop-off and metric clarity |
Energy/Transport | Project cash flow, subsidies, concession terms | Green bonds, PPPs, concessional loans | Multi-party complexity and long timelines |
For a U.S. executive, the value here is plain: the tool should match the supply chain logic of the region, not the other way around.
Regional Supply Chain Finance: Sectors, Instruments & Scale Factors
Supply Chain Finance
Food Supply Chains: Blended Finance and Smallholder Inclusion
These cases show how blended capital, contract-backed lending, and technical assistance can turn fragmented farm networks into financeable supply chains. The strongest models use buyer-backed supplier finance, warehouse receipts, and contract-based lending to turn crop sales into steady repayment streams.
Indonesia and West Africa Cases: Coconut, Cashew, and Supplier Finance
Indonesia's coconut sugar value chain shows how layered capital can make a fragmented smallholder network financeable. The Mirova Sustainable Land Fund 2 provided junior and first-loss capital at the fund level, paired with a mezzanine loan and targeted technical assistance (TA) to Big Tree Farms, an exporter sourcing coconut sugar from smallholder producers across rural Indonesia.[3][1][5] The structure worked because losses were stacked in a way that gave lenders more comfort. Repayment was built into the sourcing relationship, with loan installments deducted from crop proceeds before farmers received their net payments.
Côte d'Ivoire's cashew sector shows a different but related model. The country became the first francophone African country to adopt a warehouse receipts law, which allowed cashew stocks to serve as collateral and unlocked about $16 million in loans to processors and traders.[7] Processors drew on senior working capital lines backed by export contracts, while impact investors and development finance institutions (DFIs) supplied longer-tenor loans for plant upgrades and certification. A pilot tool called "Cash-flow let cashew flow" was developed to help lenders understand processor cash cycles and unlock more debt finance.[4] Large buyers anchored the structure through off-take agreements, and smallholders were included through cooperatives that handled input credit, quality training, and crop collection.
A coordinated program in Sulawesi, Indonesia's cocoa sector adds a third example. The structure combined government infrastructure investment, technology and price guarantees from Mars Inc., and concessional loans of $30 million to $40 million from IFAD.[6] The payoff was striking: yields increased by roughly 150%, and smallholders reported income gains of 3x to 4x. That happened because public, corporate, and multilateral capital were aligned around the same delivery model.
Lessons from the Food Cases on Scaling
Across these cases, a few patterns stand out. Contract-backed sourcing is the base layer. When a credible buyer commits to long-term off-take agreements and minimum price commitments, lenders have something concrete to underwrite.
First-loss capital works best when it is tightly aimed. It should cover the riskiest segments, such as new cooperatives and climate-vulnerable regions, while more established parts of the chain move toward commercial terms over time.
Technical assistance is part of the structure, not an add-on. Embedded TA in agronomy, financial management, and traceability helps programs hold quality as they expand. Without it, growth tends to get messy fast.
What changes by region is the enforcement tool. In Indonesia, it is off-take contracts. In Côte d'Ivoire, it is warehouse receipts. In Sulawesi, it is price guarantees.
Case | Commodity & Region | Capital Sources | Finance Instrument | Farmer Inclusion Mechanism | TA Intensity |
|---|---|---|---|---|---|
Big Tree Farms / Mirova | Coconut sugar, Indonesia | Blended first-loss + mezzanine facility | Cooperative sourcing, deduction-at-source repayment | High | |
Côte d'Ivoire Cashew | Cashew, West Africa | Local banks, DFIs, impact investors [7] | Working capital + warehouse receipt loans | Cooperative aggregation, input credit, price commitments | Medium |
Mars / IFAD Cocoa | Cocoa, Sulawesi, Indonesia | Government, Mars Inc., IFAD concessional loans ($30–$40M) [6] | Concessional loan + corporate price guarantee | Direct sourcing contracts, smallholder aggregation | High |
The common thread is not the commodity. It is the local structure that makes repayment visible. That is what gives lenders enough line of sight to fund supply chains that might otherwise look too fragmented or too risky.
The main scale constraint is traceability data. Digital farmer registries, mobile procurement tools, and geo-referenced farm mapping help lenders monitor exposure, measure impact, and repeat these programs across regions. Weak data systems slow underwriting and make replication harder. Put the data infrastructure in place early, and a pilot has a much better shot at growing into a larger program.
The same regional logic shows up in manufacturing, energy, and transport, where ESG data, sponsor strength, and public guarantees shape the financing structure.
Manufacturing, Energy, and Transport Cases: Sustainability-Linked Credit, Green Bonds, and PPP Structures
In manufacturing, energy, and transport, the anchor structure changes - ESG pricing grids, bond frameworks, or PPP concession agreements - but the job stays the same: cut lender uncertainty and line up incentives across the people involved. While the food cases leaned on off-take contracts and blended capital, these sectors depend more on ESG-linked pricing, bond rules, and public guarantees.
Manufacturing Cases: Supplier Finance Tied to ESG Performance
In manufacturing, repayment visibility usually comes from supplier scores and repeat purchase orders. That’s why sustainability-linked supply chain finance (SSCF) shows up so often. Buyers and banks cut supplier borrowing costs when verified ESG or emissions scores improve. Suppliers join a digital SCF platform, complete an independent ESG review such as EcoVadis or CDP, and get a lower rate if their score goes up.[8][11][2][12][13]
PUMA's Forever Better Vendor Financing Program, launched in 2016, is one of the clearest cases. PUMA, HSBC, and the IFC set up tiered pricing so suppliers with stronger environmental, health and safety, and social ratings pay lower interest rates on short-term working capital.[2] The IFC’s role also brought development finance into what would otherwise be a standard commercial trade finance product.
Other companies have followed a similar path. Vestas and Santander Brasil launched a sustainability-linked SCF program in August 2024 that uses EcoVadis ratings to set supplier credit terms, with a stated focus on local economic development in Ceará, Brazil.[11][18] Walmart's program with HSBC and CDP ties supplier rates to climate performance through CDP scores and progress toward science-based targets.[16]
Not every program works as planned. A Nordic industrial consortium ran a €500 million sustainability-linked SCF pilot aimed at 25% Scope 3 reductions by 2026 across 850 tier-1 suppliers. After 18 months, the result was only a 1.4% net reduction, and 40% of participating suppliers dropped out after the first year.[15] That gap says a lot. Lower pricing helps, but it doesn’t shift supplier behavior on its own. Clear onboarding and score transparency matter just as much.
Energy and Transport Cases: Green Bond and Climate Finance Packages
In energy and transport, repayment visibility comes less from receivables and more from assets, subsidies, and concession terms. These are long-life projects, so the funding tends to be bigger, slower-moving, and much more public-facing. The main tools are green bonds, concessional loans, and PPPs.[9][10][14]
The MTR Corporation in Hong Kong issued a green bond in 2017 and ring-fenced the proceeds for capital spending on low-carbon transport projects, including the Kwun Tong Line Extension.[17] That use-of-proceeds model keeps the money tied to clearly defined transit upgrades and makes project-level reporting easier.
The Bangkok Pink and Yellow Line monorail PPP shows where development finance fills a gap that green bonds alone can’t cover: demand uncertainty. The project included a 10-year government subsidy and an ADB loan with a longer-tenor tranche to bridge the period before ridership stabilized.[19] In plain terms, the financing structure gave the project time to grow into its demand profile.
In logistics, Ball Corporation and Coca-Cola Europacific Partners tested HVO-powered vehicles in UK logistics. That pilot produced emissions data that can help support lower-carbon freight finance.
Cross-Sector Comparison: Industrial, Energy, and Transport Programs
The main variable across these cases is the financing problem each tool is built to solve.
Case | Sector | Instrument | Stakeholder Structure | Capital Source | Sustainability Metric | Scaling Potential |
|---|---|---|---|---|---|---|
PUMA Forever Better Vendor Financing | Manufacturing | Sustainability-linked SCF | PUMA, HSBC, IFC, suppliers | Commercial bank + IFC | Environmental, health and safety, and social scores [2] | High - replicable across supplier bases |
Walmart Sustainable SCF | Manufacturing | Sustainability-linked SCF | Walmart, HSBC, CDP, suppliers | Commercial bank | CDP score, science-based targets [16] | High - standardized metrics enable scale |
Vestas / Santander Brasil SCF | Manufacturing | Sustainability-linked SCF | Vestas, Santander, suppliers | Commercial bank | Medium - regional rollout underway | |
MTR Hong Kong Green Bond | Transport | Green bond | MTR Corporation, institutional investors | Capital markets | Low-carbon transport capex [17] | Medium - depends on issuer access to capital markets |
Bangkok Pink & Yellow Line PPP | Transport | PPP + ADB concessional loan | Thai government, ADB, private operators | Public budget + multilateral | Ridership, modal shift [19] | Medium - complex multi-party structure |
Ball Corp / CCEP HVO Logistics | Transport | Corporate pilot | Ball Corp, Coca-Cola EP, logistics providers | Corporate funding | CO₂ reduction vs. diesel | Medium - pilot data supports scale |
Across these examples, the pattern is pretty clear. In manufacturing, the structure pushes suppliers through pricing and scorecards. In transport and energy, the structure backs long-lived assets through ring-fenced proceeds, subsidies, and risk-sharing. Those differences shape the design rules that determine whether a regional program stays a pilot or moves into broader deployment.
What Regional Programs Need to Scale
Across sectors, the same five design choices kept showing up. They were the difference between a pilot that looked good on paper and a program that could keep growing across a region.
5 Practical Design Rules
Across the cases, five design choices shaped whether regional programs could scale.
Design Rule | Practical Application | Scale Effect |
|---|---|---|
Align Incentives | Tiered rates tied to verified ESG scores | Decarbonization & Inclusion |
Combine Capital | Blended capital that absorbs early risk and unlocks private lending | Supplier Inclusion |
Digital Records | Digital records cut manual reporting and speed verification | Resilience & Decarbonization |
Anchor-Buyer | Large buyers providing early payment terms | Resilience & Inclusion |
Technical Assistance | Training SMEs on reporting and certification requirements | Inclusion & Decarbonization |
These rules sound simple, but putting them to work takes more than a checklist. Programs need the right capital structure, data systems that people will use, and clear agreement on who does what. That's where many pilots stall. The idea is solid, but the operating model never quite comes together.
Where Council Fire Fits
Council Fire works with governments, foundations, NGOs, and companies to turn sustainability goals into capital design, stakeholder roles, and implementation plans. For groups building or expanding regional supply chain finance programs, that kind of systems-level support can help move a strong pilot into a program built for scale.
Conclusion: Common Patterns Across Regional Supply Chain Finance Cases
Taken together, these cases show a shared operating model across regions. No matter the sector, the same deal types keep showing up: anchor-backed SCF, blended finance, sustainability-linked credit, green bonds, and PPPs.
But the structure alone doesn't make these programs work. The roles matter just as much, and they look strikingly similar from one market to the next. Anchor companies act as the commercial backbone through purchase commitments, off-take agreements, or early payment terms that give lenders confidence in future cash flows. Public institutions and development partners take on early-stage risk through guarantees, concessional tranches, technical assistance, and standard-setting. Local banks or partner financial institutions then originate and service the loans. That split of responsibilities is what makes regional programs bankable. ADB's Trade and Supply Chain Finance Program shows how this model can scale through partner financial institutions.[22][23]
One pattern stands out: the programs that can be repeated in new markets usually start with legal reform, stakeholder alignment, and a clear operating model, not with the loan itself.
Pricing can also shape behavior. Tiered pricing linked to verified performance can push suppliers to improve, but only if the metrics are simple, verifiable, and meaningful to suppliers.[8][24]
The scale of the opening is hard to ignore. The global trade finance gap is estimated at $2.5 trillion,[20][21] which helps explain why well-designed regional programs matter so much. The real test of scale is straightforward: programs grow when financial design, stakeholder roles, and measurable sustainability outcomes work together.
FAQs
What makes regional SCF scalable?
Regional SCF grows when the data backbone is solid, partners stay aligned, and financing can flex as the program matures. The shift from manual workflows to automated, data-led systems sharpens risk assessment and gives investors more confidence in what they’re funding.
Most programs begin with a pilot. That early phase gives teams room to test the model, work through reporting gaps, and sort out how each partner will share data and make decisions. From there, growth usually depends on a few core pieces: shared resources, standard governance, and blended finance tools that can support projects at different stages.
Council Fire helps shape these agreements so sustainability goals aren’t treated like side notes. They’re built into the long-term financial model from the start, where they can guide funding terms, partner roles, and program growth over time.
Why do SCF structures differ by sector?
SCF structures differ by sector because each industry runs on its own mix of cash flow needs, risk, and capital pressure. A manufacturer doesn’t face the same financing puzzle as a circular business or an energy developer, so the funding setup can’t be one-size-fits-all.
In manufacturing and agriculture, the focus often lands on supplier liquidity. These sectors commonly use reverse factoring to help suppliers get paid sooner without putting extra strain on the buyer’s working capital. It’s a practical fix when supply chains are tight and timing matters.
Circular models bring a different challenge. Financing has to deal with variable usage, refurbishment cycles, and assets that stay in use much longer than in linear models. That means the structure must make room for shifting revenue patterns and more careful asset tracking and valuation.
Energy projects tend to rely on blended finance because upfront costs are high and payback periods are longer. In those cases, mixing sources of capital can help spread risk and make projects easier to fund.
These structures also change based on how mature the partnership is, what kind of asset valuation is needed, and the local rules in play. In plain terms, the finance model has to fit the operating reality on the ground.
What usually blocks supplier participation?
Supplier participation often stalls for a simple reason: the work can feel too heavy. Administrative and technical burdens - especially collecting, formatting, and reporting detailed sustainability data - can turn a good idea into one more task suppliers have to squeeze into an already packed day. For small and medium-sized enterprises, that strain is even sharper. Many just don’t have the tools, staff time, or in-house know-how to handle these demands with ease.
Participation also tends to fall when the payoff isn’t clear. If suppliers see a pile of extra work but no plain operational gain or cost savings, interest fades fast. The same thing happens when a program asks them to learn unfamiliar systems instead of working through the platforms they already use. And when mandates take the place of a clear business case, suppliers are far less likely to stay engaged.
Related Blog Posts
Latest Articles
©2025
Narrative Change and Power Building: The Missing Half of Advocacy
Narrative change is the process of disrupting dominant narratives that normalize inequity and advancing new narratives from historically marginalized communities.
Funding Resilience Without Federal Grants
BRIC is unreliable and FEMA is shrinking. Here's how cities fund climate resilience with dedicated revenue, blended finance, and a coordinating authority.
The ESG Blind Spot: How AI Is Finding Risks in Companies Nobody Else Is Watching
Norway's sovereign wealth fund uses AI to screen 7,200 portfolio companies for forced labor and corruption within 24 hours. The real story is the emerging-market coverage gap that traditional ESG data vendors miss — and what it means for any company with a global supply chain.
FAQ
01
What does it really mean to “redefine profit”?
02
What makes Council Fire different?
03
Who does Council Fire work with?
04
What does working with Council Fire actually look like?
05
How does Council Fire help organizations turn big goals into action?
06
How does Council Fire define and measure success?
Sep 13, 2026
Regional Supply Chain Finance Cases | Roundup
Sustainability Strategy
In This Article
Regional SCF: anchor buyers, blended capital, digital records, and ESG-linked instruments across food, manufacturing and transport.
Regional Supply Chain Finance Cases | Roundup
Supply chain finance is growing fast, but scale depends on structure, not just volume. In 2023, global SCF volume reached $2.184 trillion, yet the cases in this roundup point to a simpler truth: programs work when repayment is easy to track, risk is shared, and data is good enough for lenders to act.
If I were skimming this for the main takeaway, I’d boil it down to this:
Food chains often rely on buyer contracts, crop-payment deductions, warehouse receipts, and blended capital.
Manufacturing programs usually tie supplier funding costs to ESG scorecards and repeat orders.
Energy and transport deals tend to use bonds, public support, and concession-based funding tied to long-life assets.
The same roles keep showing up: anchor buyers, banks, public agencies, DFIs, and technical support partners.
The main blockers are also consistent: weak traceability, poor supplier onboarding, legal gaps, and unclear role splits.
What stood out to me is that the article is not about generic lending. It is about local supply chain relationships - who buys, who supplies, who lends, and how cash gets paid back in each region. That is why an Indonesia farm model looks different from a Hong Kong rail bond or a Brazil supplier-finance program, even when the goal is similar.
The short answer: regional SCF scales when five things are in place - anchor demand, shared risk, simple metrics, digital records, and supplier support.
Area | What drives repayment | Common funding setup | Main scale issue |
|---|---|---|---|
Food | Off-take contracts, crop proceeds, warehouse receipts | Blended funds, bank lines, DFI loans | Traceability and farmer data |
Manufacturing | Purchase orders, supplier scorecards | Bank-led SCF, sometimes with DFI support | Supplier drop-off and metric clarity |
Energy/Transport | Project cash flow, subsidies, concession terms | Green bonds, PPPs, concessional loans | Multi-party complexity and long timelines |
For a U.S. executive, the value here is plain: the tool should match the supply chain logic of the region, not the other way around.
Regional Supply Chain Finance: Sectors, Instruments & Scale Factors
Supply Chain Finance
Food Supply Chains: Blended Finance and Smallholder Inclusion
These cases show how blended capital, contract-backed lending, and technical assistance can turn fragmented farm networks into financeable supply chains. The strongest models use buyer-backed supplier finance, warehouse receipts, and contract-based lending to turn crop sales into steady repayment streams.
Indonesia and West Africa Cases: Coconut, Cashew, and Supplier Finance
Indonesia's coconut sugar value chain shows how layered capital can make a fragmented smallholder network financeable. The Mirova Sustainable Land Fund 2 provided junior and first-loss capital at the fund level, paired with a mezzanine loan and targeted technical assistance (TA) to Big Tree Farms, an exporter sourcing coconut sugar from smallholder producers across rural Indonesia.[3][1][5] The structure worked because losses were stacked in a way that gave lenders more comfort. Repayment was built into the sourcing relationship, with loan installments deducted from crop proceeds before farmers received their net payments.
Côte d'Ivoire's cashew sector shows a different but related model. The country became the first francophone African country to adopt a warehouse receipts law, which allowed cashew stocks to serve as collateral and unlocked about $16 million in loans to processors and traders.[7] Processors drew on senior working capital lines backed by export contracts, while impact investors and development finance institutions (DFIs) supplied longer-tenor loans for plant upgrades and certification. A pilot tool called "Cash-flow let cashew flow" was developed to help lenders understand processor cash cycles and unlock more debt finance.[4] Large buyers anchored the structure through off-take agreements, and smallholders were included through cooperatives that handled input credit, quality training, and crop collection.
A coordinated program in Sulawesi, Indonesia's cocoa sector adds a third example. The structure combined government infrastructure investment, technology and price guarantees from Mars Inc., and concessional loans of $30 million to $40 million from IFAD.[6] The payoff was striking: yields increased by roughly 150%, and smallholders reported income gains of 3x to 4x. That happened because public, corporate, and multilateral capital were aligned around the same delivery model.
Lessons from the Food Cases on Scaling
Across these cases, a few patterns stand out. Contract-backed sourcing is the base layer. When a credible buyer commits to long-term off-take agreements and minimum price commitments, lenders have something concrete to underwrite.
First-loss capital works best when it is tightly aimed. It should cover the riskiest segments, such as new cooperatives and climate-vulnerable regions, while more established parts of the chain move toward commercial terms over time.
Technical assistance is part of the structure, not an add-on. Embedded TA in agronomy, financial management, and traceability helps programs hold quality as they expand. Without it, growth tends to get messy fast.
What changes by region is the enforcement tool. In Indonesia, it is off-take contracts. In Côte d'Ivoire, it is warehouse receipts. In Sulawesi, it is price guarantees.
Case | Commodity & Region | Capital Sources | Finance Instrument | Farmer Inclusion Mechanism | TA Intensity |
|---|---|---|---|---|---|
Big Tree Farms / Mirova | Coconut sugar, Indonesia | Blended first-loss + mezzanine facility | Cooperative sourcing, deduction-at-source repayment | High | |
Côte d'Ivoire Cashew | Cashew, West Africa | Local banks, DFIs, impact investors [7] | Working capital + warehouse receipt loans | Cooperative aggregation, input credit, price commitments | Medium |
Mars / IFAD Cocoa | Cocoa, Sulawesi, Indonesia | Government, Mars Inc., IFAD concessional loans ($30–$40M) [6] | Concessional loan + corporate price guarantee | Direct sourcing contracts, smallholder aggregation | High |
The common thread is not the commodity. It is the local structure that makes repayment visible. That is what gives lenders enough line of sight to fund supply chains that might otherwise look too fragmented or too risky.
The main scale constraint is traceability data. Digital farmer registries, mobile procurement tools, and geo-referenced farm mapping help lenders monitor exposure, measure impact, and repeat these programs across regions. Weak data systems slow underwriting and make replication harder. Put the data infrastructure in place early, and a pilot has a much better shot at growing into a larger program.
The same regional logic shows up in manufacturing, energy, and transport, where ESG data, sponsor strength, and public guarantees shape the financing structure.
Manufacturing, Energy, and Transport Cases: Sustainability-Linked Credit, Green Bonds, and PPP Structures
In manufacturing, energy, and transport, the anchor structure changes - ESG pricing grids, bond frameworks, or PPP concession agreements - but the job stays the same: cut lender uncertainty and line up incentives across the people involved. While the food cases leaned on off-take contracts and blended capital, these sectors depend more on ESG-linked pricing, bond rules, and public guarantees.
Manufacturing Cases: Supplier Finance Tied to ESG Performance
In manufacturing, repayment visibility usually comes from supplier scores and repeat purchase orders. That’s why sustainability-linked supply chain finance (SSCF) shows up so often. Buyers and banks cut supplier borrowing costs when verified ESG or emissions scores improve. Suppliers join a digital SCF platform, complete an independent ESG review such as EcoVadis or CDP, and get a lower rate if their score goes up.[8][11][2][12][13]
PUMA's Forever Better Vendor Financing Program, launched in 2016, is one of the clearest cases. PUMA, HSBC, and the IFC set up tiered pricing so suppliers with stronger environmental, health and safety, and social ratings pay lower interest rates on short-term working capital.[2] The IFC’s role also brought development finance into what would otherwise be a standard commercial trade finance product.
Other companies have followed a similar path. Vestas and Santander Brasil launched a sustainability-linked SCF program in August 2024 that uses EcoVadis ratings to set supplier credit terms, with a stated focus on local economic development in Ceará, Brazil.[11][18] Walmart's program with HSBC and CDP ties supplier rates to climate performance through CDP scores and progress toward science-based targets.[16]
Not every program works as planned. A Nordic industrial consortium ran a €500 million sustainability-linked SCF pilot aimed at 25% Scope 3 reductions by 2026 across 850 tier-1 suppliers. After 18 months, the result was only a 1.4% net reduction, and 40% of participating suppliers dropped out after the first year.[15] That gap says a lot. Lower pricing helps, but it doesn’t shift supplier behavior on its own. Clear onboarding and score transparency matter just as much.
Energy and Transport Cases: Green Bond and Climate Finance Packages
In energy and transport, repayment visibility comes less from receivables and more from assets, subsidies, and concession terms. These are long-life projects, so the funding tends to be bigger, slower-moving, and much more public-facing. The main tools are green bonds, concessional loans, and PPPs.[9][10][14]
The MTR Corporation in Hong Kong issued a green bond in 2017 and ring-fenced the proceeds for capital spending on low-carbon transport projects, including the Kwun Tong Line Extension.[17] That use-of-proceeds model keeps the money tied to clearly defined transit upgrades and makes project-level reporting easier.
The Bangkok Pink and Yellow Line monorail PPP shows where development finance fills a gap that green bonds alone can’t cover: demand uncertainty. The project included a 10-year government subsidy and an ADB loan with a longer-tenor tranche to bridge the period before ridership stabilized.[19] In plain terms, the financing structure gave the project time to grow into its demand profile.
In logistics, Ball Corporation and Coca-Cola Europacific Partners tested HVO-powered vehicles in UK logistics. That pilot produced emissions data that can help support lower-carbon freight finance.
Cross-Sector Comparison: Industrial, Energy, and Transport Programs
The main variable across these cases is the financing problem each tool is built to solve.
Case | Sector | Instrument | Stakeholder Structure | Capital Source | Sustainability Metric | Scaling Potential |
|---|---|---|---|---|---|---|
PUMA Forever Better Vendor Financing | Manufacturing | Sustainability-linked SCF | PUMA, HSBC, IFC, suppliers | Commercial bank + IFC | Environmental, health and safety, and social scores [2] | High - replicable across supplier bases |
Walmart Sustainable SCF | Manufacturing | Sustainability-linked SCF | Walmart, HSBC, CDP, suppliers | Commercial bank | CDP score, science-based targets [16] | High - standardized metrics enable scale |
Vestas / Santander Brasil SCF | Manufacturing | Sustainability-linked SCF | Vestas, Santander, suppliers | Commercial bank | Medium - regional rollout underway | |
MTR Hong Kong Green Bond | Transport | Green bond | MTR Corporation, institutional investors | Capital markets | Low-carbon transport capex [17] | Medium - depends on issuer access to capital markets |
Bangkok Pink & Yellow Line PPP | Transport | PPP + ADB concessional loan | Thai government, ADB, private operators | Public budget + multilateral | Ridership, modal shift [19] | Medium - complex multi-party structure |
Ball Corp / CCEP HVO Logistics | Transport | Corporate pilot | Ball Corp, Coca-Cola EP, logistics providers | Corporate funding | CO₂ reduction vs. diesel | Medium - pilot data supports scale |
Across these examples, the pattern is pretty clear. In manufacturing, the structure pushes suppliers through pricing and scorecards. In transport and energy, the structure backs long-lived assets through ring-fenced proceeds, subsidies, and risk-sharing. Those differences shape the design rules that determine whether a regional program stays a pilot or moves into broader deployment.
What Regional Programs Need to Scale
Across sectors, the same five design choices kept showing up. They were the difference between a pilot that looked good on paper and a program that could keep growing across a region.
5 Practical Design Rules
Across the cases, five design choices shaped whether regional programs could scale.
Design Rule | Practical Application | Scale Effect |
|---|---|---|
Align Incentives | Tiered rates tied to verified ESG scores | Decarbonization & Inclusion |
Combine Capital | Blended capital that absorbs early risk and unlocks private lending | Supplier Inclusion |
Digital Records | Digital records cut manual reporting and speed verification | Resilience & Decarbonization |
Anchor-Buyer | Large buyers providing early payment terms | Resilience & Inclusion |
Technical Assistance | Training SMEs on reporting and certification requirements | Inclusion & Decarbonization |
These rules sound simple, but putting them to work takes more than a checklist. Programs need the right capital structure, data systems that people will use, and clear agreement on who does what. That's where many pilots stall. The idea is solid, but the operating model never quite comes together.
Where Council Fire Fits
Council Fire works with governments, foundations, NGOs, and companies to turn sustainability goals into capital design, stakeholder roles, and implementation plans. For groups building or expanding regional supply chain finance programs, that kind of systems-level support can help move a strong pilot into a program built for scale.
Conclusion: Common Patterns Across Regional Supply Chain Finance Cases
Taken together, these cases show a shared operating model across regions. No matter the sector, the same deal types keep showing up: anchor-backed SCF, blended finance, sustainability-linked credit, green bonds, and PPPs.
But the structure alone doesn't make these programs work. The roles matter just as much, and they look strikingly similar from one market to the next. Anchor companies act as the commercial backbone through purchase commitments, off-take agreements, or early payment terms that give lenders confidence in future cash flows. Public institutions and development partners take on early-stage risk through guarantees, concessional tranches, technical assistance, and standard-setting. Local banks or partner financial institutions then originate and service the loans. That split of responsibilities is what makes regional programs bankable. ADB's Trade and Supply Chain Finance Program shows how this model can scale through partner financial institutions.[22][23]
One pattern stands out: the programs that can be repeated in new markets usually start with legal reform, stakeholder alignment, and a clear operating model, not with the loan itself.
Pricing can also shape behavior. Tiered pricing linked to verified performance can push suppliers to improve, but only if the metrics are simple, verifiable, and meaningful to suppliers.[8][24]
The scale of the opening is hard to ignore. The global trade finance gap is estimated at $2.5 trillion,[20][21] which helps explain why well-designed regional programs matter so much. The real test of scale is straightforward: programs grow when financial design, stakeholder roles, and measurable sustainability outcomes work together.
FAQs
What makes regional SCF scalable?
Regional SCF grows when the data backbone is solid, partners stay aligned, and financing can flex as the program matures. The shift from manual workflows to automated, data-led systems sharpens risk assessment and gives investors more confidence in what they’re funding.
Most programs begin with a pilot. That early phase gives teams room to test the model, work through reporting gaps, and sort out how each partner will share data and make decisions. From there, growth usually depends on a few core pieces: shared resources, standard governance, and blended finance tools that can support projects at different stages.
Council Fire helps shape these agreements so sustainability goals aren’t treated like side notes. They’re built into the long-term financial model from the start, where they can guide funding terms, partner roles, and program growth over time.
Why do SCF structures differ by sector?
SCF structures differ by sector because each industry runs on its own mix of cash flow needs, risk, and capital pressure. A manufacturer doesn’t face the same financing puzzle as a circular business or an energy developer, so the funding setup can’t be one-size-fits-all.
In manufacturing and agriculture, the focus often lands on supplier liquidity. These sectors commonly use reverse factoring to help suppliers get paid sooner without putting extra strain on the buyer’s working capital. It’s a practical fix when supply chains are tight and timing matters.
Circular models bring a different challenge. Financing has to deal with variable usage, refurbishment cycles, and assets that stay in use much longer than in linear models. That means the structure must make room for shifting revenue patterns and more careful asset tracking and valuation.
Energy projects tend to rely on blended finance because upfront costs are high and payback periods are longer. In those cases, mixing sources of capital can help spread risk and make projects easier to fund.
These structures also change based on how mature the partnership is, what kind of asset valuation is needed, and the local rules in play. In plain terms, the finance model has to fit the operating reality on the ground.
What usually blocks supplier participation?
Supplier participation often stalls for a simple reason: the work can feel too heavy. Administrative and technical burdens - especially collecting, formatting, and reporting detailed sustainability data - can turn a good idea into one more task suppliers have to squeeze into an already packed day. For small and medium-sized enterprises, that strain is even sharper. Many just don’t have the tools, staff time, or in-house know-how to handle these demands with ease.
Participation also tends to fall when the payoff isn’t clear. If suppliers see a pile of extra work but no plain operational gain or cost savings, interest fades fast. The same thing happens when a program asks them to learn unfamiliar systems instead of working through the platforms they already use. And when mandates take the place of a clear business case, suppliers are far less likely to stay engaged.
Related Blog Posts
Latest Articles
©2025
Narrative Change and Power Building: The Missing Half of Advocacy
Narrative change is the process of disrupting dominant narratives that normalize inequity and advancing new narratives from historically marginalized communities.
Funding Resilience Without Federal Grants
BRIC is unreliable and FEMA is shrinking. Here's how cities fund climate resilience with dedicated revenue, blended finance, and a coordinating authority.
The ESG Blind Spot: How AI Is Finding Risks in Companies Nobody Else Is Watching
Norway's sovereign wealth fund uses AI to screen 7,200 portfolio companies for forced labor and corruption within 24 hours. The real story is the emerging-market coverage gap that traditional ESG data vendors miss — and what it means for any company with a global supply chain.
FAQ
What does it really mean to “redefine profit”?
What makes Council Fire different?
Who does Council Fire work with?
What does working with Council Fire actually look like?
How does Council Fire help organizations turn big goals into action?
How does Council Fire define and measure success?