Oct 6, 2026 · 15 min read
Sustainability Strategy
In This Article
Measure energy use, cut demand, then apply efficiency, electrification, low‑carbon fuels, heat recovery and CCS to reduce industrial CO₂.
On this page
- Pathways to Commercial Liftoff: Industrial Decarbonization Preliminary Perspectives
- Measure Facility Energy Use and Emissions
- 1. Reduce Energy Demand and Improve Processes
- 2. Electrify Suitable Industrial Processes
- 3. Use Low-Carbon Fuels and Feedstocks
- 4. Recover and Reuse Industrial Heat
- 5. Address Remaining Emissions with Carbon Capture and Storage
- Compare Pathways and Plan Facility Projects
- Conclusion: Combine Pathways and Track Results
- FAQs
5 Pathways for Industrial Energy Decarbonization
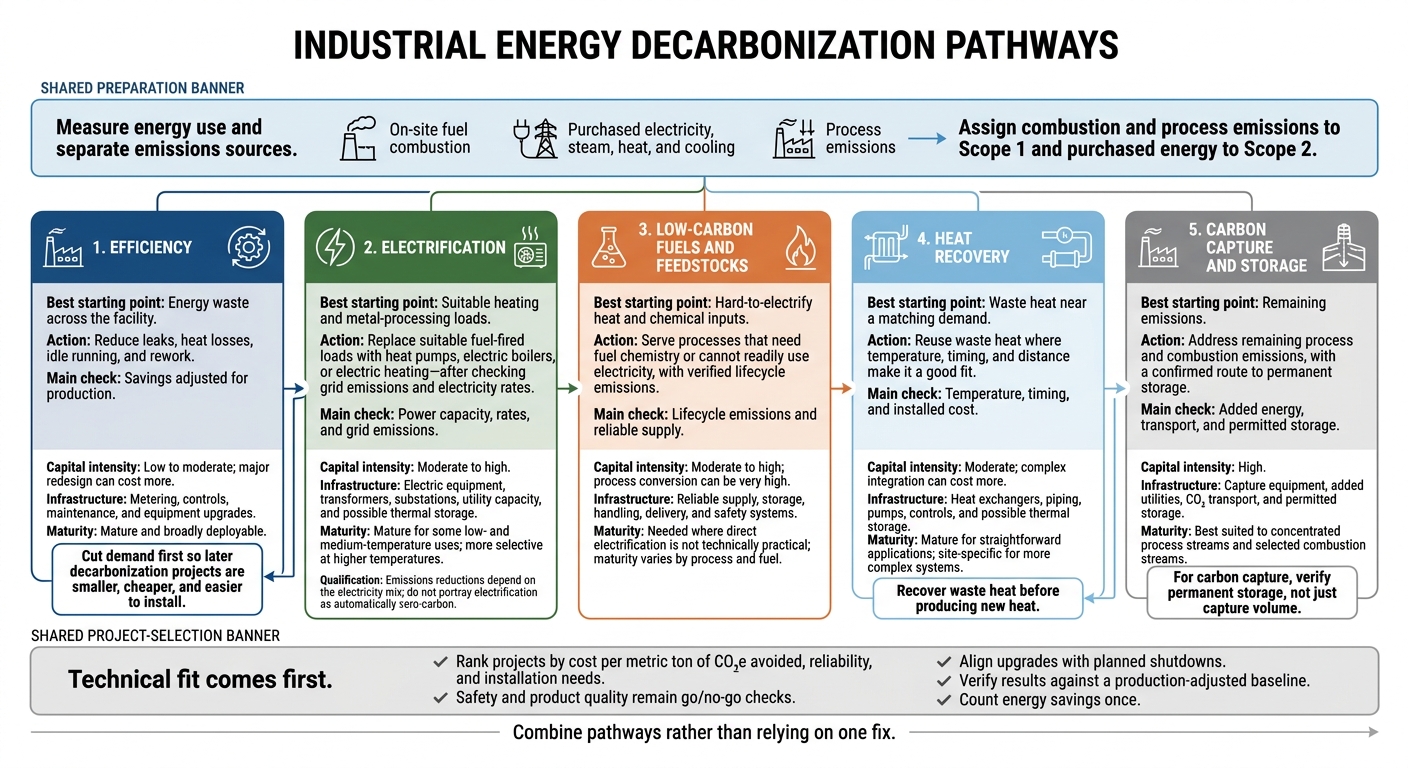
We can cut industrial emissions by reducing energy demand first, then matching each process to the right mix of five pathways. Industry produces about 25% of global energy-related CO₂ emissions.[8] Before choosing equipment, we need to measure energy use, separate emissions sources, and check power capacity, costs, and replacement schedules.
Here’s how we approach the five pathways:
Efficiency: Reduce leaks, heat losses, idle running, and rework.
Electrification: Replace suitable fuel-fired loads with heat pumps, electric boilers, or electric heating - after checking grid emissions and electricity rates.
Low-carbon fuels and feedstocks: Serve processes that need fuel chemistry or cannot readily use electricity, with verified lifecycle emissions.
Heat recovery: Reuse waste heat where temperature, timing, and distance make it a good fit.
Carbon capture and storage: Address remaining process and combustion emissions, with a confirmed route to permanent storage.
Quick Comparison
| Pathway | Best starting point | Main check |
|---|---|---|
| Efficiency | Energy waste across the facility | Savings adjusted for production |
| Electrification | Suitable heating and metal-processing loads | Power capacity, rates, and grid emissions |
| Low-carbon fuels and feedstocks | Hard-to-electrify heat and chemical inputs | Lifecycle emissions and reliable supply |
| Heat recovery | Waste heat near a matching demand | Temperature, timing, and installed cost |
| Carbon capture and storage | Remaining emissions | Added energy, transport, and permitted storage |
We rank projects by cost per metric ton of CO₂e avoided, reliability, and installation needs. <u>Safety and product quality remain go/no-go checks.</u> Then we align upgrades with planned shutdowns and verify results against a production-adjusted baseline - without counting the same savings twice.
5 Industrial Energy Decarbonization Pathways
Pathways to Commercial Liftoff: Industrial Decarbonization Preliminary Perspectives
sbb-itb-8baf5f1
Measure Facility Energy Use and Emissions
Start by defining the facility boundary and reporting year. Separate on-site fuel combustion, purchased electricity, steam, heat, and cooling, and process emissions. Assign combustion and process emissions to Scope 1 and purchased energy to Scope 2. Calculate combustion emissions using fuel records and emission factors, purchased-energy emissions using utility data, and process emissions using direct measurements or material balances.[10][11][12][13] Report CO₂ in metric tons (1,000 kilograms), and use CO₂-equivalent (CO₂e) when combining greenhouse gases.
Build the audit around utility bills, equipment inventories, operating data, production records, and field measurements. Collect monthly electricity data, plus hourly or 15-minute readings for major loads. Submeter compressors, dryers, furnaces, boilers, and other major loads, then reconcile their readings with facility totals. Set a baseline in MWh per unit produced or MMBtu per short ton, adjusted for product mix, operating hours, and weather. A drop in annual consumption alone does not prove better efficiency.
Prepare a heat balance that tracks inputs, useful heat, and losses to identify waste heat available for recovery projects. Record process temperatures, flow rates, and operating schedules. Match each recoverable heat stream to one demand so it is not counted twice. Document equipment replacement dates, downtime limits, quality constraints, and backup needs. Before sizing electric equipment, check transformer, switchgear, feeder, and utility service capacity.
Compare projects using marginal-abatement-cost analysis:
(Annualized capital cost + incremental operating cost − annual savings) / annual metric tons of CO₂e avoided
Record capital costs in U.S. dollars and electricity prices in $/MWh, including demand charges and delivery fees. Account for maintenance, installation downtime, project life, and utility upgrades. Rank projects by cost and implementation risk. Evaluate interacting measures together to avoid counting savings twice, and use the ranking to decide which pathway comes first.
Keep an audit trail of meter IDs, calibration records, emission-factor sources, assumptions, and calculation owners. Have operations, maintenance, finance, and environmental staff review it before approving investment. Verify incentive, reporting, and permitting assumptions against applicable federal, state, local, utility, and air-quality-agency sources as of October 6, 2026. Leave unverified benefits out of the base-case economics. Use this baseline to rank the five pathways that follow.
1. Reduce Energy Demand and Improve Processes
Process and Emissions Fit
Cut demand first so later decarbonization projects are smaller, cheaper, and easier to install. Start with shutdown schedules, control settings, compressed-air leak repairs, and scheduling changes that cut scrap, rework, and unnecessary heating or drying.
Using less fuel cuts Scope 1 emissions; using less purchased electricity cuts Scope 2 emissions. Measure savings against a production-adjusted baseline so a drop in output does not get mistaken for better efficiency.
Equipment and Running Costs
Tuning controls and fixing leaks generally cost less upfront than replacing equipment. Insulation reduces persistent heat losses. Replacement tackles equipment that is inefficient, oversized, or unreliable. Weigh avoided energy and maintenance costs against installation, commissioning, and recurring maintenance costs.
In 2003, Raytheon Integrated Defense Systems upgraded compressed air at its Integrated Air Defense Center in Andover, Massachusetts. Compressor and dryer replacement, networked controls, and leak detection and repair saved 1,559,000 kWh annually and $141,500 per year in combined energy and maintenance costs.[14]
Infrastructure and Installation Needs
Control changes require instrumentation, operator training, and short production trials. Insulation and piping work may need scaffolding, permits, and access during planned shutdowns. Equipment replacement may also require foundations, electrical work, or crane access.
Schedule work during planned outages to avoid delaying production or later decarbonization projects. Reject changes that compromise safety or product quality. Give maintenance and operations teams responsibility for recurring leak checks, sensor calibration, and approved setpoints. The reduced load also cuts the size and cost of later electrification and fuel-switching projects.
Sector Uses and Maturity and Fit
These measures are mature and used across many sites, though process changes still require site-specific testing. Efficiency reduces the energy base before electrification, fuel switching, heat recovery, or carbon capture.
In steel, tune furnace loading and reheating schedules; in chemicals, improve batch sequencing and distillation controls; in cement, reduce air infiltration and optimize grinding; in pulp and paper, improve moisture control, drying systems, and vacuum systems.
2. Electrify Suitable Industrial Processes
Process and Emissions Fit
Start with low- and medium-temperature heat that does not require combustion chemistry. Heat pumps upgrade waste or ambient heat for applications up to about 302°F (150°C).[21] Electric boilers produce steam, resistance heaters heat ovens and process fluids, infrared heats surfaces, and induction heats conductive metals.[15][17]
The right choice depends on temperature, chemistry, and reliability. Compare avoided Scope 1 emissions with added Scope 2 emissions using the utility’s marginal or forecast grid mix - not an assumption of zero-carbon electricity.[19] Processes above this temperature range or those that need combustion chemistry should move to another pathway.
Equipment and Running Costs
Calculate electricity costs for each operating scenario. Account for demand charges, time-of-use rates, maintenance, and electrical upgrades. Heat pumps generally use less electricity than electric boilers to deliver the same heat output, though their upfront costs can be higher.[18][22]
In the United States, a standalone electric boiler can cost about four times as much to run as a natural-gas boiler. Tariffs and operating schedules can narrow that gap.[22] Test thermal storage and off-peak operation before committing to equipment.[18]
Infrastructure and Installation Needs
Get a utility load-impact assessment before ordering equipment. Use interval load data to check peak demand and equipment constraints. Large induction and arc furnaces may need harmonic filters and voltage regulation to address power-quality problems.
Plan for cooling, water treatment, commissioning, and operator training. Define how much downtime the process can tolerate, budget for backup heat or power, and include planned outages in the installation schedule.[16][20]
Sector Uses and Technology Readiness
Food and beverage plants can target washing, pasteurization, and hot water; paper and coatings facilities can assess electric drying and curing; metal processors can use induction for melting and heat treatment.[15][17]
Electric arc furnaces are mature for scrap-based steelmaking, but they are not universal replacements. Their fit depends on scrap quality, direct-reduced-iron supply, electricity reliability, and product specifications. When fuel also serves as a chemical reactant, switching to electricity may require process redesign. Pilot sensitive applications and verify product quality before full deployment.[20]
Use these tests to identify which loads can electrify now. Loads limited by product-quality requirements or heat intensity need another decarbonization pathway.
3. Use Low-Carbon Fuels and Feedstocks
Use this pathway when process heat, chemistry, or reliability makes electrification impractical.
Process and Emissions Fit
Start with the function: heat, feedstock, or reductant. Hydrogen can serve all three, so switching fuels alone may leave feedstock emissions unchanged. Screen by function rather than fuel type, checking temperature, flame behavior, residence time, atmosphere, pressure, product chemistry, and impurity tolerance. DOE identifies hydrogen, biogas, and other low-carbon energy sources as important for high-temperature and process-chemistry uses.[7]
Require verified lifecycle emissions - not marketing claims. Obtain a third-party verified lifecycle assessment that covers production, transport, leakage, and use, backed by chain-of-custody records.
For hydrogen, verify electricity source, methane leakage, and compression or liquefaction energy. For biogas and biomass, verify feedstock source, transport distance, land-use effects, methane handling, and competing uses. For ammonia, include hydrogen-production emissions, conversion energy, transport, and combustion nitrogen oxides (NOx).
Set carbon-intensity limits in contracts, expressed as kg CO₂e/kg hydrogen or kg CO₂e/MMBtu.
Equipment and Running Costs
Compare costs per unit of delivered energy. Include commodity cost, transport, storage, conversion, maintenance, and losses. The IEA’s 2024 review found that renewable hydrogen generally cost 1.5 to 6 times as much as unabated fossil-based hydrogen.[24] Even a promising fuel needs reliable supply, acceptable purity, and price risk the business can handle.
Infrastructure and Installation Needs
Plan for hydrogen-compatible burners and materials, leak detection, and ventilation. Biogas needs cleaning to remove moisture, hydrogen sulfide, and siloxanes. Biomass requires storage, dust protection, and ash handling. Renewable liquid fuels need tank, seal, and fuel-quality checks.
Ammonia is not a drop-in fuel: it requires specialized storage, toxic-release controls, burner design, and nitrogen-oxide controls. Map delivery routes, storage, backup supply, permitting, and outage windows before approval.
Sector Uses and Technology Readiness
Match the fuel to the process, then test it in the sector context. Readiness depends on the application.
Steel plants can assess hydrogen as a direct-reduced-iron reductant, subject to substantial hydrogen supply and suitable downstream equipment. Chemical plants can replace fossil-derived hydrogen in ammonia and methanol production, subject to supply and purity requirements. Refineries can target hydrotreating and hydrocracking but must still manage the fossil carbon in their products. Ceramics plants can trial hydrogen, cleaned biogas, or renewable liquid fuels in kilns, checking flame stability and product quality. Readiness varies by application; cleaned biogas is more mature than ammonia combustion.[5][23]
4. Recover and Reuse Industrial Heat
Process and Emissions Fit
Once you’ve cut demand, electrified where possible, and switched fuels where needed, recover the remaining heat. Recover waste heat before producing new heat. Use it to preheat boiler feedwater, combustion air, or incoming raw materials. Industrial heat pumps can lift low-grade heat to useful temperatures, while thermal storage bridges gaps between supply and demand. Export only the surplus left after onsite needs are met.
Match heat sources and users by temperature, flow, schedule, cleanliness, pressure, and distance.[28] DOE reports that about 60% of industrial waste heat is at or below 437°F (225°C).[26]
Equipment and Running Costs
Use heat exchangers for direct transfer and economizers for boiler exhaust. In steam systems, recover condensate, flash steam, and heat from blowdown.[29] Heat pump costs depend on temperature lift, electricity rates, and utilization.[30]
Price the full installed system, not just the main equipment. Include piping, fans, pumps, cleaning, controls, and production downtime. Calculate savings from displaced fuel, then subtract added electricity and maintenance costs.[25]
Infrastructure and Installation Needs
Short pipe runs and aligned operating hours improve feasibility. Size hot-water tanks or steam accumulators using hourly supply-and-demand profiles rather than annual averages.
Test exhaust for dust, sulfur compounds, chlorides, and moisture. Condensing service requires corrosion-resistant materials, drainage, and access for cleaning. Before installing piping between nearby facilities, secure an offtake agreement that covers temperature, availability, backup supply, metering, and ownership.[28][32]
Sector Uses
Food and beverage plants can reuse condenser heat for wash water; chemical plants can use pinch analysis to match hot streams with feed-preheating needs; steel, glass, and ceramics plants can recover furnace exhaust for combustion air.[29]
Conventional exchangers and economizers are established options. Heat pumps delivering roughly 320–392°F (160–200°C) require site-specific temperature and operating checks.[27][30][31] After commissioning, meter recovered heat, displaced fuel, and added electricity to verify net emissions cuts. Use carbon capture for emissions this pathway cannot remove.
5. Address Remaining Emissions with Carbon Capture and Storage
Use carbon capture and storage (CCS) to address emissions that remain after the first four pathways.
Process and Emissions Fit
Separate process, combustion, and purchased-energy emissions before choosing a capture source.
In cement, about two-thirds of emissions come from limestone-related chemical reactions, with no proven production route that fully avoids them, making capture and permanent storage a leading option.[41][33][36]
Stream concentration matters: concentrated streams need less separation energy than dilute exhaust with high nitrogen content.
Equipment and Running Costs
Capture requires energy for separation, solvent regeneration, conditioning, and compression.
The IEA estimates capture costs at about $15–$25 per metric ton of CO₂ for concentrated industrial streams, versus about $40–$120 for dilute streams.[41]
Build the full cost estimate around added steam and electricity, transport and storage, monitoring, permitting, maintenance, and outage time. Compare options by cost per verified metric ton of CO₂e avoided.[38]
Infrastructure and Installation Needs
Secure the storage route before committing to capture equipment. Confirm transport capacity, CO₂ quality, injection capacity, and who bears liability for interruptions and long-term care.
In the United States, geological CO₂ injection requires a Class VI well permit from EPA or a state, Tribe, or territory with primacy.[37] Budget for site selection, well construction, monitoring, testing, reporting, financial responsibility, closure, post-injection care, corrective action, and well-integrity checks.[39][40]
Keep utilization separate from storage. Credit it as durable abatement only when evidence verifies that stored carbon remains in place.[35][38]
Sector Uses and Technology Readiness
Commercial separation experience exists in natural-gas processing, hydrogen, methanol, and ethanol production. Prioritize concentrated ammonia and chemical streams; evaluate refineries unit by unit. Cement and lime remain candidates, but kiln integration, contaminants, large gas volumes, and additional energy demand complicate retrofits. Some cement capture technologies remain at the demonstration stage, so require site operating data before investment.[34][36]
Rank CCS against the other remaining options using these checks.
Compare Pathways and Plan Facility Projects
After screening each pathway, use the measured baseline and the matrix below to rank options for a single facility. Technical fit comes first: required temperature, pressure, product quality, load profile, and available power determine which options can work. Capital intensity is relative. Actual costs depend on facility size, operating hours, retrofit complexity, permitting, incentives, and electricity carbon intensity. Each category is process-specific.[7][42][43]
| Pathway | Temperature applicability | Emissions addressed | Capital intensity | Infrastructure needs | Operating-cost exposure | Implementation maturity | Sector uses |
|---|---|---|---|---|---|---|---|
| Efficiency | All temperature ranges; particularly useful before major equipment replacement | Scope 1 combustion, Scope 2 electricity, and some process emissions through material efficiency | Low to moderate; major redesign can cost more | Metering, controls, maintenance, and equipment upgrades | Usually favorable because fuel and electricity use decline | Mature and broadly deployable | Food and beverage, pulp and paper, chemicals, metals, and refining |
| Electrification | Low- and medium-temperature loads are often the easiest fit; higher-temperature uses depend more on the process | Mainly Scope 1 combustion; emissions reductions depend on the electricity mix and grid capacity | Moderate to high | Electric equipment, transformers, substations, utility capacity, and possible thermal storage | Exposed to electricity prices and demand charges | Mature for some low- and medium-temperature uses; more selective at higher temperatures | Food and beverage hot water, washing, steam, and drying; pulp and paper evaporation and drying; selected steel reheating and melting applications |
| Low-carbon fuels and feedstocks | Particularly relevant for high-temperature or chemically intensive processes | Scope 1 combustion and feedstock-related emissions; upstream impacts also need assessment | Moderate to high; process conversion can be very high | Reliable supply, storage, handling, delivery, and safety systems | Highly sensitive to delivered fuel or feedstock cost and availability | Needed where direct electrification is not technically practical; maturity varies by process and fuel | Steel reduction, chemicals and refining, cement fuels, and other hard-to-electrify industrial processes |
| Heat recovery | Depends on source and sink temperatures, timing, and contamination - not a fixed temperature band | Avoided combustion and purchased-energy emissions | Moderate; complex integration can cost more | Heat exchangers, piping, pumps, controls, and possible thermal storage | Often lowers operating costs when source and sink are well matched | Mature for straightforward applications; site-specific for more complex systems | Food processing, pulp and paper, chemicals, and refining |
| Carbon capture and storage | Determined by the emissions stream, not process temperature alone | Remaining process and combustion emissions | High | Capture equipment, added utilities, CO₂ transport, and permitted storage | High; costs vary widely by CO₂ concentration and project design | Best suited to concentrated process streams and selected combustion streams | Cement, lime, chemicals, refining, and other residual-emissions sources |
Use the ranking to sequence projects by cost, risk, and shutdown timing. Count energy savings once. A single integrated energy balance should account for heat recovery and heat pumps together, rather than crediting each measure separately. Where loads fluctuate, use a process-integration model or hourly energy balance to compare the combined system.
Compare installed cost, annual operating cost, peak electric demand, downtime, and cost per metric ton of CO₂e avoided. Test how results change with electricity prices and demand charges, delivered fuel prices, incentives, and supply interruptions. Apply the same electricity emissions factor across options. Safety, product quality, reliability, and supply availability remain go/no-go conditions, even when the financial case looks strong.
Sequence projects while running feasibility studies in parallel. Let the facility baseline and constraints guide which projects go first. Efficiency upgrades, utility studies, fuel contracting, and storage assessments can move forward together if their designs remain compatible. Align construction with asset replacement cycles and shutdowns, and confirm technology maturity, workforce training, vendor capacity, and supply limits before committing capital.
Conclusion: Combine Pathways and Track Results
Turn the ranked options from the previous section into a phased decarbonization plan. Combine pathways rather than relying on one fix. Efficiency and heat recovery cut demand. Electrification replaces suitable combustion loads, while low-carbon fuels and feedstocks support processes that are hard to electrify. Carbon capture and storage addresses the emissions that remain.[6][9] No single pathway reaches net-zero alone.
Sector context changes the mix: steel often combines efficiency, electrification, and clean power; cement still needs carbon management for calcination; chemicals and refining depend on hydrogen, feedstocks, and heat integration.[6][5]
Rank projects by lifecycle emissions, cost, reliability, and infrastructure readiness, not just onsite reductions.
Check the combined pathways against the same metrics used in the baseline analysis, with results measured against a documented baseline year. Report annual CO₂e, energy intensity, and output. Verify progress with calibrated meters, utility bills, fuel invoices, and production records.[44] For carbon capture, verify permanent storage, not just capture volume. Lower output does not mean lower emissions intensity.
FAQs
How can I decarbonize with a limited budget?
Start with an emissions inventory to pinpoint your largest sources, then focus on energy efficiency. LED lighting, HVAC optimization, and process improvements can cut utility bills and emissions, often paying for themselves within 1 to 5 years.
A marginal abatement cost curve helps rank projects by cost per metric ton of CO2 avoided. Put low-cost, high-impact projects first, and consider sustainability-linked loans to help fund your transition.
Should I electrify now or wait for cleaner power?
You don’t have to wait for a fully clean grid to start electrifying. The benefits grow as the grid gets cleaner, while waiting can lock in fossil fuel dependence for years [1][2].
Start with energy efficiency to cut demand, then electrify where it makes the most sense [1][3]. Pair electrification with renewable energy purchases, such as power purchase agreements, to further cut grid-related emissions and power your operations with clean energy [4][2].
How can I avoid locking in the wrong technology?
Time investments to match normal equipment replacement cycles rather than upgrading equipment early [1]. Use marginal abatement cost curves to rank options, weighing materiality, feasibility, and value to long-term business goals [2]. Apply scenario analysis to account for when technologies will mature and how carbon price assumptions may affect decisions [3].
Start with energy efficiency to reduce system requirements before investing in large-scale supply-side solutions. Work with utility planners early to align grid capacity with your long-term electrification roadmap [1][4].
FAQ