In This Article
Measure hotel waste per guest-night — not annual tonnage — to separate occupancy effects from true waste performance.
On this page
- 1. Waste per Guest-Night
- 2. Waste per Occupied Room-Night
- 3. Waste per Meal Served
- 4. Waste per Square Foot
- 5. Waste Diversion Rate
- 6. Total Annual Waste
- How to Calculate Waste per Guest-Night
- Account for Shared Facilities and Nonresident Diners
- Choose Comparable Hotels
- Explain Occupancy Effects and Metric Differences
- Conclusion: Build a Consistent Waste Scorecard
- FAQs
Guest-Night Metrics Help Hotels Benchmark Waste
I start hotel waste comparisons with waste per guest-night - not annual tonnage alone. Divide total included waste by overnight guest stays for the same period: 120,000 kilograms ÷ 80,000 guest-nights equals 1.5 kilograms, or about 3.3 pounds, per guest-night.
I use six measures to separate waste efficiency from business volume:
Waste per guest-night: Waste relative to overnight guest stays.
Waste per occupied room-night: Waste relative to rooms used, with guest density in view.
Waste per meal served: Food waste relative to actual meals served.
Waste per square foot: Waste relative to the floor area covered.
Diversion rate: The percentage kept out of disposal - not a measure of waste prevention.
Total annual waste: The property’s full waste burden over 12 months.
Quick Comparison
| Measure | What I check before comparing |
|---|---|
| Per guest-night | Overnight guest counts, occupancy, and lodging-only versus hotel-wide waste |
| Per occupied room-night | Guests per room and matching waste coverage |
| Per meal | Actual covers, food-only versus total outlet waste, and service format |
| Per square foot | Matching floor-area definitions and space use |
| Diversion rate | Treatment definitions and access to recycling and composting |
| Annual total | Property size, service level, dining volume, and reporting coverage |
My rule is simple: <u>match what is counted before judging performance</u>. I separate restaurant, banquet, and shared-facility waste where possible, compare similar hotels over the same reporting period, and read ratios alongside occupancy and total weight. A lower ratio can reflect more guests - not less waste - so I use the results to set department-level targets with named owners.
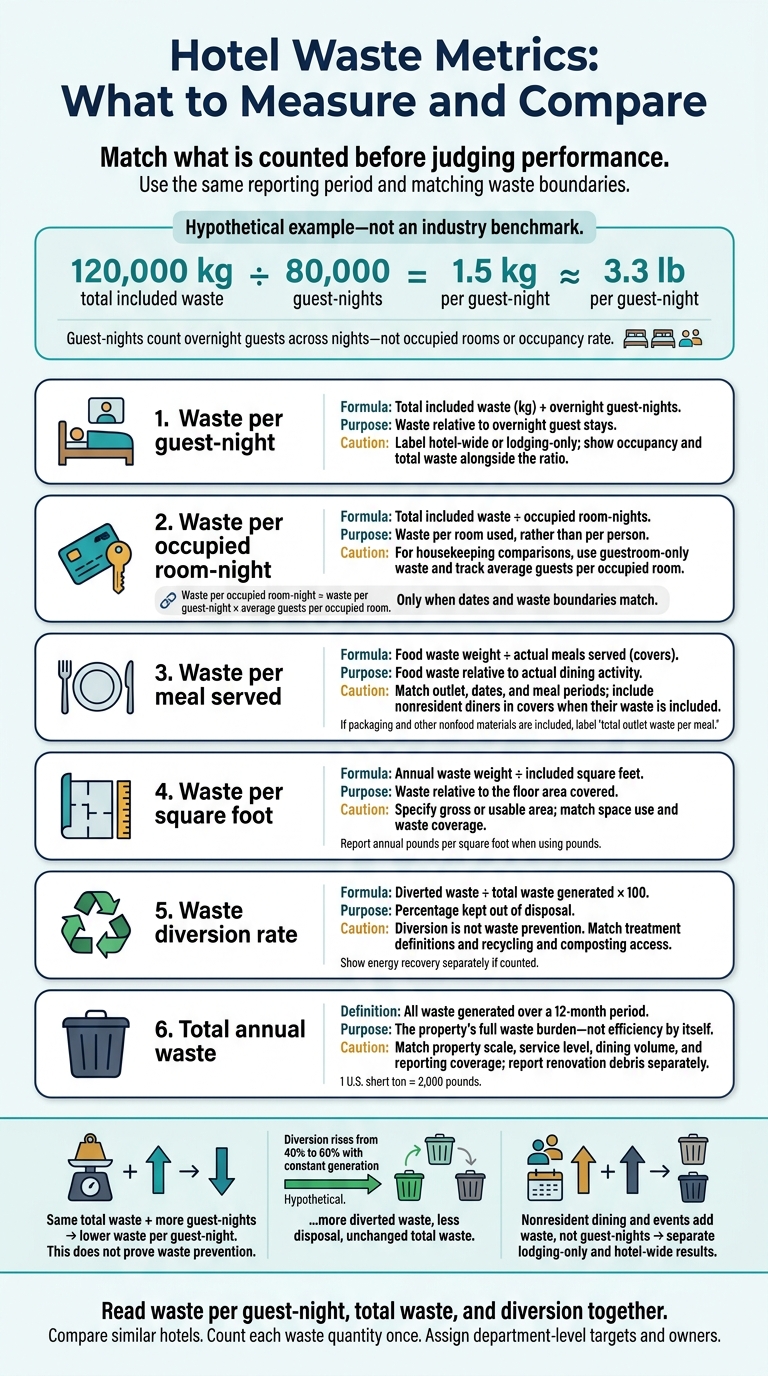
Hotel Waste Metrics: What to Measure and Compare
1. Waste per Guest-Night
Formula and Waste Boundary
Calculate waste per guest-night as total included waste (kg) ÷ overnight guest-nights for the same period. Get guest counts from the property-management system and check them against room-night records.[2][4] Convert pounds to kilograms before doing the calculation.[5]
Include landfill, recycling, composting, and other measured waste streams in the numerator, counting each only once. Label the benchmark hotel-wide or lodging-only,[2] and keep that boundary unchanged as occupancy shifts.
Occupancy Effects
Fixed waste does not decrease when occupancy drops. At higher occupancy, that waste is spread across more guest-nights. The ratio falls, even if total waste stays the same.
Show occupancy, guest-nights, and total waste weight alongside the result so readers can tell better utilization apart from waste prevention.[4] Once the ratio is set, compare only hotels with similar operating models.
Peer Comparisons
Match properties by room count, service level, hotel type, occupancy, dining outlets, banquet capacity, seasonality, and reporting boundaries. Room count alone does not make hotels comparable.[4][6]
sbb-itb-8baf5f1
2. Waste per Occupied Room-Night
Measurement Basis
Use occupied room-nights to compare housekeeping waste per room used rather than per person.
Waste per occupied room-night = total included waste ÷ occupied room-nights, measured over the same period. Count each occupied room-night once, regardless of how many guests share the room. Pull the count from the property-management or front-office system - not from available rooms.
This metric helps show how guest density, rather than room count alone, affects waste results.
Waste Boundary
For housekeeping comparisons, use a guestroom-only boundary covering waste from guest rooms and associated housekeeping areas. Keep restaurant and banquet waste separate: those streams reflect dining and events, not room use.
Occupancy Effects
Track average guests per occupied room alongside this metric. When dates and waste boundaries match:
Waste per occupied room-night = waste per guest-night × average guests per occupied room.
More guests sharing a room can increase waste per occupied room-night even when waste per person stays the same.
Peer Comparisons
Add guest density to the peer-selection criteria above. Family-oriented properties and hotels serving mostly solo travelers may have different room-night results even when their per-person results are similar.
Report both metrics when guest mix differs. Do not convert a guest-night benchmark into a room-night benchmark without matching guest-density data.
3. Waste per Meal Served
Use a meal-based denominator when food service, rather than lodging, drives the waste stream.
Measurement Basis
Food waste per meal = food waste weight ÷ actual meals served (covers). Report kilograms per meal, using the same outlet, dates, and meal periods for both figures. Base the meal count on point-of-sale covers or actual banquet attendance - not reservations or meals prepared. If waste from nonresident diners is included, include those diners in the meal count too.[7][9]
Waste Boundary
Count food waste only: preparation scraps, spoilage, service waste, and plate waste. If the weight includes packaging, napkins, containers, or similar materials, label the metric total outlet waste per meal instead. Weigh preparation, service, and plate waste separately to spot purchasing, production, or portion issues.[8][9]
Allocate shared-kitchen waste consistently using production volumes, recipe quantities, covers, or batch records. Document the allocation rule, and count each waste stream only once when combining restaurant, room-service, and banquet results.
Occupancy Effects
Occupancy affects meal demand, not the denominator. Low breakfast traffic or weak banquet attendance can increase waste per meal, especially when buffet production stays fixed. Track breakfast participation, event attendance, occupancy, and resident and nonresident covers to help explain unusual results.
Peer Comparisons
Compare properties with similar service formats, meal volumes, menu complexity, and mixes of resident and nonresident diners. Report total food waste alongside the per-meal metric.
If building size drives waste more than dining volume, use waste per square foot next.
4. Waste per Square Foot
Measurement Basis
Annual waste per square foot = waste weight ÷ included square feet. Use measured weights in pounds whenever possible and report a full year. Keep monthly data to track seasonal changes. This facilities metric supports - not replaces - guest-night metrics. Specify whether you use gross or usable square footage, and use that basis consistently.[11][12]
Waste Boundary
Set the floor-area boundary before calculating the metric, then apply it consistently. A lodging-only calculation might include guest rooms, corridors, the lobby, back-of-house areas, kitchens, laundry, offices, and meeting rooms. Exclude leased retail, separately managed restaurants, parking garages, and adjacent facilities unless you also include their waste.
Identify the waste streams counted, distinguish total waste from landfill-only waste, and disclose any exclusions for renovation debris.[12][13] These choices determine whether the metric covers the whole property or lodging operations alone.
Occupancy Effects
Unlike guest-night metrics, square footage stays fixed as occupancy changes. Higher occupancy, dining volume, and event activity can increase waste per square foot even when waste controls improve. Low occupancy can make this ratio look better while waste per guest gets worse. Read both metrics alongside occupancy and event activity.
Peer Comparisons
Compare properties by how they use space, not footprint alone. Distinguish lodging-only, full-service, and event-heavy operations. Match reporting periods and floor-area boundaries, accounting for shared-facility allocations and laundry arrangements. Keep large meeting rooms, exhibition areas, and other shared event spaces within the floor-area boundary when they are part of hotel operations.
5. Waste Diversion Rate
Measurement Basis
Diversion rate measures how much waste avoids disposal - not how little a hotel generates. Use it alongside waste intensity.
Waste diversion rate = diverted waste ÷ total waste generated × 100, based on weight records such as hauler invoices, scale tickets, transfer-station records, receipts, vendor reports, and internal weights.[14][16]
Report recycling, composting, anaerobic digestion, reuse, donation, and energy recovery separately. If you count energy recovery, show it as a separate category because some frameworks treat it differently from recycling and composting.[17] When direct weighing isn’t available, document the estimation method and use it consistently.
Waste Boundary
As with intensity metrics, the waste boundary must match the operations being compared. Include both diverted and disposed waste within that boundary.
If the hotel manages shared restaurant and banquet waste, track those streams separately when possible. Don’t attribute waste from nonresident diners, conference attendees, or event guests solely to overnight guests. Disclose any exclusions and explain how waste is allocated.
Occupancy Effects
Occupancy changes the diversion rate only when diverted and disposed waste change at different rates. The percentage can rise or fall independently of total waste.
Peer Comparisons
Compare diversion rates only when hotels have equal access to recycling and composting systems and measure them on the same basis. Match hotels by operating model, then account for local recycling and composting access.
Before ranking hotels, align reporting periods, definitions of diverted waste, waste boundaries, and the share of weights measured versus estimated. Read diversion rates alongside total waste and waste per guest-night: the highest percentage doesn’t prove the lowest waste burden.
6. Total Annual Waste
Diversion rate shows how a hotel manages waste. Total annual waste shows how much it generates.
Measurement Basis
Total annual waste is all waste generated over a 12-month period. It puts diversion percentages in context and supports planning for hauling contracts, storage, and waste reduction targets. Report the total in pounds or U.S. short tons - 1 short ton = 2,000 pounds. Reconcile records for all 12 months, remove duplicates, and label estimates.[2][3]
Waste Boundary
State which operations the total covers, including leased tenant spaces and shared facilities. Report renovation debris separately from routine operating waste to avoid skewing year-over-year comparisons. If nonresident dining and events account for a large share of waste, publish both the hotel-wide annual total and a lodging-only result, with subtotals for restaurants, banquets, and other major operations.[18]
Occupancy Effects
Pair each year’s total with guest-nights, occupied room-nights, meals served, and occupancy. Review monthly records alongside these figures to distinguish changes in business activity from reductions in waste per guest-night. This separates the effects of business volume from waste efficiency.[2]
Peer Comparisons
Compare annual tonnage only among hotels with similar room counts, service levels, occupancy patterns, dining operations, and reporting boundaries. Annual totals show scale; guest-night intensity helps assess efficiency.
A large resort can generate more waste overall while producing less per overnight guest than a smaller hotel.[1][2]
How to Calculate Waste per Guest-Night
To compare hotels on the same basis, use a fixed waste boundary and count guest-nights for the same reporting period.
Count Overnight Guests, Not Rooms
Waste per guest-night = total included hotel waste generated (kg) ÷ total guest-nights. Count all included waste before final treatment - not just waste sent for disposal.[19][20] To calculate guest-nights, add the number of overnight guests for each night. Or multiply the guests in each stay by the nights they stayed, then add those totals.
Guest-nights are not room-nights or occupancy rate. Exclude nonresident diners, day visitors, and event attendees from the guest-night count, even when their waste falls within the hotel’s waste boundary.
Example: 1.5 kg per Guest-Night
Hypothetical calculation: For the same complete reporting year and hotel boundary, 120,000 kg of total included waste ÷ 80,000 guest-nights = 1.5 kg per guest-night. That equals approximately 3.3 lb per guest-night, using 1 kg ≈ 2.20 lb.[21]
Report kilograms for comparison and pounds for U.S. readers. The result depends on what you count and where you draw the boundary.
Define Waste Coverage and Data Sources
Coverage: Document which areas you include: guestrooms, housekeeping, food service, offices, maintenance, and outdoor areas.
Records: Prioritize contractor invoices, transfer-station or landfill records, recycling and composting weight tickets, on-site scale readings, and container weights.
Estimates: When weighing isn’t available, use representative audits or documented estimates. Record sampling dates, container volumes, assumed material densities, and data gaps.
Reporting period: Use annual data for benchmarking to account for seasonality, holidays, occupancy changes, and event cycles.
Classification: Track material types separately from destinations: disposal, recycling, composting, and other recovery routes.
Duplicate records: Count each quantity once. Don’t double count material recorded both on-site and by haulers.
Exclusions: Disclose hazardous-waste coverage, renovation waste, unweighed collections, and any other exclusions.
Rounding: Keep unrounded values in the calculation file. Round only the published result.
Account for Shared Facilities and Nonresident Diners
Nonresident diners, banquet attendees, and shared-facility users generate waste but don’t add guest-nights. Including their waste in hotel-wide totals can make lodging waste look higher than it is. Separate these streams before assessing accommodation performance.
This matters most at full-service, resort, and event-heavy hotels, where dining and shared spaces can account for much of the waste. Hotels with similar room counts and occupancy may still have very different service levels, dining volumes, and event loads. Use the same guest-night denominator only after identifying which waste streams belong to lodging.
| Area | Waste sources | Count basis | Allocation options | Required disclosures |
|---|---|---|---|---|
| Lodging areas | Guestroom and housekeeping waste, room-service packaging, guest-floor recycling | Guest-nights, occupied room-nights, rooms serviced | Assign separately collected waste directly; allocate shared housekeeping waste by rooms serviced or labor records | Guest-night definition, room-service treatment, included departments and waste categories |
| Restaurants serving nonresident diners | Preparation waste, spoilage, buffet leftovers, plate waste, containers and packaging | Meals served; resident and nonresident covers where feasible | Assign outlet waste directly; allocate shared kitchen waste by covers, production volume, or menu mix | Food waste only or total outlet waste; resident/nonresident cover counts |
| Banquets and events | Preparation and plate waste, overproduction, serviceware, packaging | Attendees, meals served, event covers, event-days | Assign waste by event; allocate shared preparation waste by meals or production quantities | Attendance method, event type, catered meals, setup/teardown coverage, unusual events |
| Other shared facilities | Loading docks, retail, fitness and spa areas, staff dining, conference spaces, shared kitchens and compactors | Transactions, visits, employee meals, square feet, service volumes, properties served | Weigh separately where possible; otherwise allocate by documented activity | Facilities and departments covered, allocation formula, assumptions, uncertainty, method changes |
Measure Restaurant and Banquet Waste Separately
Track outlet waste separately from lodging waste, distinguishing resident and nonresident diners when records allow. Define each outlet’s reporting period and state whether its numerator covers food waste alone or all outlet waste. Match inventory, preparation, service, and plate waste to the meals they support - even if preparation takes place the day before.
Keep banquet attendance and meal counts separate from guest-nights. Maintain event-level records rather than treating a one-off wedding or conference as typical. Tracking waste by stage also helps show whether the problem starts with purchasing, overproduction, or portions left uneaten.[22][10]
Document Shared-Waste Allocation
Weigh first, assign directly next, and estimate only what remains. For shared kitchens, use production quantities or comparable meal counts. For loading docks, use records linked to the departments or tenants served. Don’t assume revenue or floor area reflects how much waste each generates.
Maintain an allocation register showing measured weight, assigned amounts, any unallocated balance, the formula used, and the estimated share. Disclose uncertainty and method changes, and check that assigned quantities reconcile with the measured total.[12]
Once shared waste is separated, combine the results into a comparable hotel-wide benchmark.
Report Hotel-Wide and Lodging-Only Results
Show how restaurant, banquet, and shared-facility waste accounts for the difference between lodging-only and hotel-wide results, without double counting. State whether lodging includes room service and allocated support activities.
Use the same guest-night denominator for both figures so readers can see how much comes from lodging alone. Compare hotels only when their reporting boundaries and allocation methods match.[12]
Choose Comparable Hotels
Once you’ve set the waste metric, compare results only with hotels that operate under similar conditions.
Match Property Size, Service Level, and Hotel Type
Start with the basics: room count, floor area, dining load, and occupancy patterns. Match operating conditions before comparing results.
Keep economy, limited-service, select-service, full-service, upscale, and luxury properties separate when their waste streams differ. Apply the same approach to resort, convention, extended-stay, and all-inclusive hotels. Match properties by the services they provide - not their labels alone.[23][24]
| Factor | What to record | Use in comparison |
|---|---|---|
| Property size | Rooms and relevant facility square footage | Match scale; use the waste-specific denominator |
| Service level | Dining, housekeeping, room service, and amenities | Match actual services |
| Operating model | Limited-service, full-service, resort, convention, extended-stay, all-inclusive | Match activity patterns |
| Food-and-beverage activity | Meals served, banquet covers, nonresident dining share | Match dining and event intensity |
| Occupancy patterns | Occupancy rate, guests per occupied room, length of stay | Account for differences in guest density and room use |
| Seasonality | Monthly patterns and peak/off-season periods | Match reporting seasons |
| Geography | Climate, regulations, supply conditions, collection services | Account for local operating differences |
| Recycling access | Accepted materials, composting access, treatment destinations | Compare diversion separately from prevention |
Compare Dining, Events, and Local Conditions
Use meal and event counts rather than restaurant capacity alone. Where possible, measure restaurant and banquet waste separately, and distinguish resident demand from nonresident demand. Outside diners and event attendees generate waste without adding guest-nights. Check whether shared amenities also serve outside visitors.
Compare seasonal properties over matching demand periods, and document local recycling and composting access. Higher diversion does not necessarily mean less waste. Treatment pathways can increase diversion without reducing total waste, so assess recycling and composting access separately from waste prevention.
Matching hotels is only part of the job. Their records must also support a sound comparison.
Align Reporting Periods, Definitions, and Data Quality
Use the same complete calendar or fiscal year, with consistent waste boundaries, treatment definitions, and allocation rules. Define total waste separately from landfill waste. Agree on how to account for construction waste, outsourced operations, and tenant outlets.
Disclose measurement methods, the percentage of waste estimated, months covered, and any missing facilities or vendors. Where possible, compare measured-weight records with similar coverage. When comparing weighed data with volume estimates, explain the limits.
Normalization cannot repair missing coverage or incompatible definitions. Present unmatched results as context, not rankings.
Explain Occupancy Effects and Metric Differences
Once waste streams are separated, the next step is to understand how occupancy and service mix affect the numbers.
Check Fixed Waste and Guests per Room
Some waste from hotel operations persists even when occupancy drops. That can make a hotel look less efficient even though its waste practices haven’t changed. Use actual guest-night counts to distinguish occupancy effects from changes in waste, and track guests per occupied room.
These hypothetical scenarios show how activity levels and metric denominators affect the results.
Hypothetical scenario Metric effects Why they change Evidence needed Lower occupancy with 1,000 pounds of monthly waste Total waste stays constant; waste per guest-night and occupied room-night rises Fewer guests and occupied rooms share the same fixed waste Waste weights, guest-nights, occupied room-nights Guests per occupied room rise from two to three Waste per room-night may rise while waste per guest-night stays stable or falls More guests share each room Guest counts, room-nights, waste weights Nonresident dining and banquet activity increases Hotel-wide waste rises without changing overnight guest-nights; lodging-only intensity may stay stable More diners add waste outside the lodging denominator Covers, attendance, separately measured outlet waste Diversion rises from 40% to 60% with constant generation Diverted weight rises; disposal falls; total waste stays constant Waste changes destination, not generation Stream weights, destination records, consistent diversion rules
Compare Monthly Trends with Annual Results
Seasonal patterns can also skew month-to-month comparisons. Use a consistent 12-month baseline and calculate annual intensity from annual totals - not an average of monthly ratios. Compare seasonally matched months to diagnose changes, rather than rank performance. [5]
Read Waste Intensity, Totals, and Diversion Together
Ratios need the context of actual waste tonnage. Read guest-night intensity alongside total waste, disposal tonnage, and diversion rate. Intensity can fall while total waste rises if guest volume grows faster than waste generation. [15][14]
Before crediting an intervention, check guest counts, dining activity, operating hours, and any measurement changes. Reconcile scale tickets with outlet logs and vendor records. Treat ratio changes as signals, not proof of waste reduction, and compare hotels only when their reporting boundaries and activity measures are consistent.
Conclusion: Build a Consistent Waste Scorecard
Build your scorecard around waste per guest-night, adding other metrics only when they provide context. Include total waste and diversion rate. Keep lodging-only results separate from hotel-wide results when shared facilities generate waste beyond overnight stays.
Use the baseline benchmark to pinpoint waste by department and stream, including buffet overproduction, banquet waste, purchasing losses, packaging, and recycling contamination.
Turn each finding into a departmental action, and assign an owner to every target. Kitchens can tackle buffet waste, procurement can cut packaging, and facilities can manage contamination and collection records. Track the baseline, current result, target, owner, and next action. Repeat measurements using the same rules, and put source reduction ahead of diversion.
FAQs
How can I tell if lower waste per guest-night reflects real progress?
Compare waste per guest-night with a consistent base year. Use periods of normal activity to account for renovations or occupancy changes exceeding 20%. Benchmark against properties with similar size, service levels, and occupancy.
Break down waste by source to separate day-to-day inefficiencies from the effects of shared facilities or nonresident diners. Before identifying trends or gaps, have at least two people check the data for accuracy.
How do I benchmark waste when no hotels closely match mine?
Focus on normalizing your data, not finding a perfect match. Compare properties of different sizes and service levels using waste per guest-night, then adjust for production volume, operating hours, and seasonal changes.
Use occupancy ratios to allocate waste proportionally across shared spaces or account for nonresident diners. Track results against your own historical baseline to measure efficiency gains, even when close peer benchmarks aren’t available.
How can I allocate shared dining waste without separate scales?
When you can’t measure shared dining waste directly, estimate its volume using data such as meals served or occupancy. Record the share of meals served to hotel guests versus nonresident diners so you can separate guest-related waste.
To compare figures on a consistent basis, use ratios such as waste per meal served or waste per guest-night. Apply the same calculation formulas across reports.




FAQ