In This Article
Covers annual vs hourly clean-energy matching, storage and firm supply, verification, costs, and how to report local coverage gaps.
Global Firms Match Renewable Power Use Hour by Hour
Matching 100% of annual electricity use does not mean matching every hour with clean power. I’d start by checking each facility’s hourly demand, local supply, and unmatched consumption - not just its yearly purchases. Google’s 2024 results show the gap: 100% annual renewable matching, but 66% hourly matching with local carbon-free power.
I compare three approaches:
Annual renewable matching: Balances yearly electricity use with renewable purchases or certificates, but leaves timing gaps.
Hourly carbon-free matching: Matches use and eligible clean supply within the same hour and grid region. Unlike renewable-only claims, it can include nuclear power.
Hourly matching with storage or firm clean power: Uses stored energy or sources such as geothermal and nuclear to fill gaps, with added costs and tracking needs.
Across all three, I focus on timing, location, supply, audit records, costs, and remaining gaps. <u>Contractual matching does not prove physical delivery or emissions cuts.</u> For your own reporting, keep matching results separate from Scope 2 emissions, account for storage losses, and show local shortfalls before combining global totals.
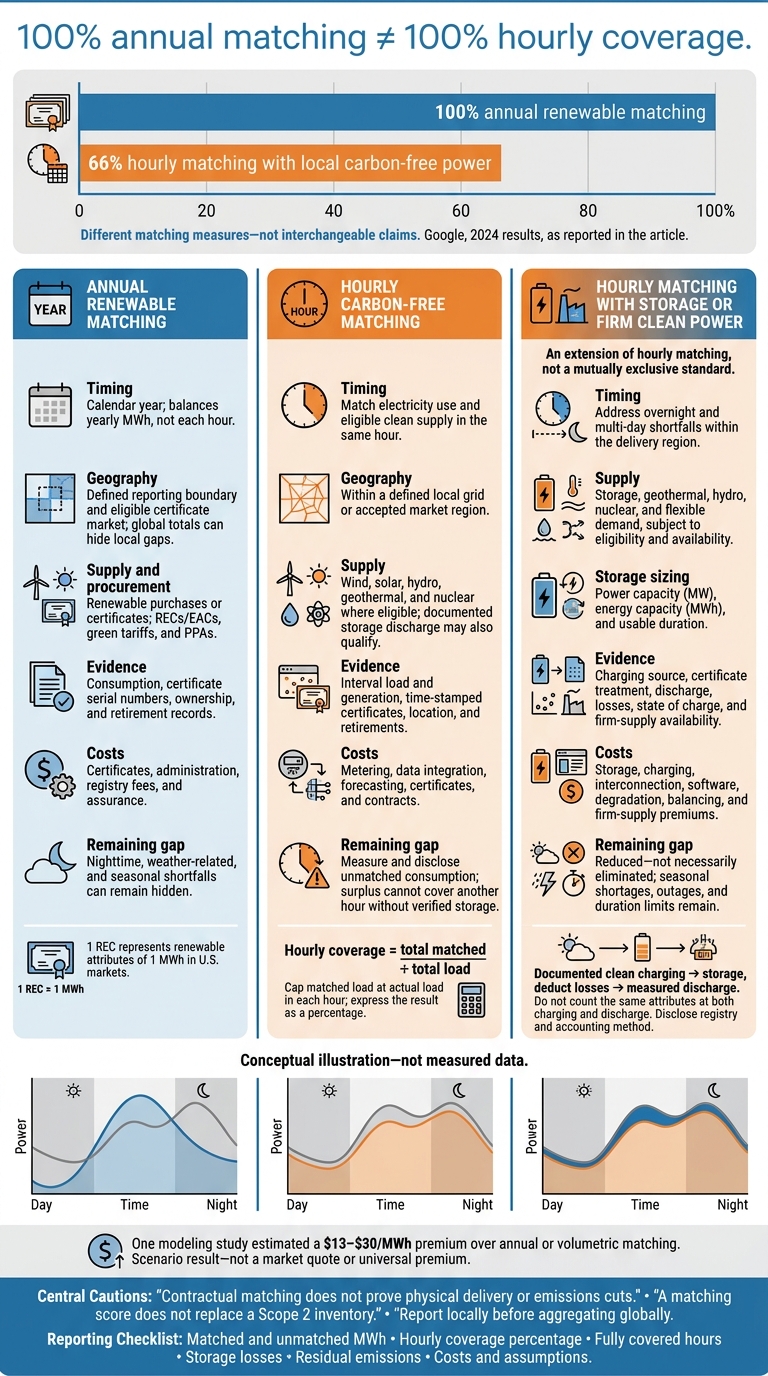
Annual vs. Hourly Clean Electricity Matching
1. Annual Renewable-Energy Matching
Time and Geographic Coverage
Set the reporting boundary first - facility, country, utility territory, regional grid, or global portfolio - and match certificates to it.[12][15] Annual matching counts yearly MWh; it does not track hourly timing. In U.S. markets, 1 REC represents the renewable attributes of 1 MWh of renewable electricity.[6][9] A global REC total may match worldwide consumption without showing that supply and use align locally.
Supply and Flexibility
Unbundled RECs are purchased separately from electricity delivery. Physical PPAs buy power and RECs from a named project. Virtual PPAs settle financially and transfer the project’s RECs without delivering electricity to the buyer’s site.[7][9][10] All three can support annual matching, though seasonal output and project delays can leave fewer certificates available in a given year.
Merck KGaA’s renewable-electricity toolkit describes a 10-year agreement covering 300,000 MWh in China, equivalent to 80% of its electricity consumption there. Its U.S. project began operating in May 2022 and was projected to generate about 258 GWh annually, matching nearly 100% of its U.S. Life Science electricity use. These are country-specific coverage figures, not evidence of hourly coverage.[14]
Data and Emissions Verification
Track monthly metered consumption, generation, certificates, and shortfalls. Keep certificate serial numbers, ownership records, and registry retirement confirmations. Paying for electricity alone does not establish ownership of its renewable attributes.[8][11] Reconcile MWh, not dollars. Certificate purchases support market-based claims, not direct emissions cuts.[11]
Cost and Complexity
Unbundled RECs generally simplify purchasing and offer flexibility to cover remaining annual load. Physical PPAs add delivery and balancing costs; virtual PPAs add financial settlement exposure. Model low-, expected-, and high-price cases for RECs, PPAs, fees, credit requirements, and audit costs.[7][10] Annual flexibility reduces procurement constraints but leaves gaps between when electricity is generated and when it is used.
sbb-itb-8baf5f1
24/7 carbon-free electricity: what, why and how?
2. Hourly Carbon-Free-Energy Matching
Hourly matching closes the timing gap left by annual procurement, but only within a defined local grid. Annual totals can balance supply across time; hourly coverage cannot.
Time and Geographic Coverage
Match electricity use with clean supply each hour within one grid region, such as a balancing authority area or bidding zone. Eligible generation and time-stamped certificates must meet the load’s timing and geographic rules. Surplus generation cannot count toward another hour without verified storage. EnergyTag principles stress both temporal coincidence and geographic deliverability.[16][5] For multinational portfolios, this geographic boundary becomes the main constraint.
Hourly matching shows when clean supply falls short - even when annual procurement covers total consumption.
Supply and Flexibility
Define eligible resources and storage rules in the contract before procurement begins. Supply may include wind, solar, hydropower, geothermal, nuclear power, and storage discharge with a documented charging source. Distinguish contracted resources from resources available on the grid, then fill the remaining hourly gaps through load shifting or additional supply.[2][4]
Data and Emissions Verification
Match interval load data with time-stamped generation, location, and certificate records. Calculate coverage as matched load divided by total load, capping the matched amount each hour at actual load.[2][19] Report fully covered hours separately and disclose unmatched consumption. Where hourly data is unavailable, clearly separate measured results from estimates.[17][18]
Cost and Complexity
More time-specific coverage brings higher data and settlement costs. Budget for meter integration, forecasting, certificate tracking, and legal review - not just electricity.
One modeling study estimated a $13–$30/MWh premium over annual or volumetric matching; this is a scenario result, not a market quote.[20]
Compare options using cost per additional percentage point of hourly coverage and cost per metric ton avoided. Pay close attention to the expense of closing the last coverage gap.[4]
3. Hourly Matching With Storage or Firm Clean Power
When hourly matching leaves gaps, storage or firm clean power can cover the remaining load. This addresses supply mismatches that annual matching hides.
Time and Geographic Coverage
Size storage for overnight and multi-day shortfalls within the delivery region. Batteries can bridge shorter gaps. Longer shortages may call for long-duration storage or firm clean resources such as geothermal, hydropower, or nuclear power. Check hourly dispatch limits: hydrology, outages, and contract rights can restrict how much firm power is available.[3][5]
Supply and Flexibility
Start with loads that can shift, such as HVAC, refrigeration, and EV charging. Set maximum delays and operating limits, then size storage for the remaining gap in each delivery region. Specify battery power capacity (MW), energy capacity (MWh), and usable duration, accounting for degradation and discharge limits.[1][21][22]
Data and Emissions Verification
Storage needs its own audit trail and a chain of custody that can be checked. Retire hourly certificates when clean electricity enters storage, track those attributes while the energy is stored, and limit clean-energy claims to measured discharge. Deduct losses and reconcile charging, discharging, and state-of-charge records to prevent double counting. Disclose the registry and accounting method, since storage standards are still developing.[5][21]
Cost and Complexity
Compare storage costs across annual, partial hourly, and near-100% hourly matching. Look beyond battery prices: include charging costs, transmission and interconnection, software and metering, certificate-management fees, degradation, and remaining grid purchases. Assess storage by duration and use case, then test whether demand flexibility or firm supply can close the remaining gap at a lower total cost.[1][23]
The next section breaks down the supply options, market boundaries, and remaining gaps.
Supply Options and Coverage Gaps
The table compares how three approaches match electricity purchases with actual use - and where timing, location, and supply gaps remain.
| Approach | Matching interval | Generation locations | Eligible market boundary | Procurement instruments | Storage or firm supply | Unmatched hours |
|---|---|---|---|---|---|---|
| Annual matching | Calendar year | Often regional or remote wind and solar projects | Utility, national, or approved certificate market | RECs, equivalent energy attribute certificates (EACs), green tariffs, PPAs | Not required | Hourly gaps stay hidden in annual totals. |
| Hourly CFE matching | Hourly; sometimes subhourly | Preferably within the same grid or balancing region as the load | Defined market or grid region accepted by the accounting framework | Time-stamped EACs, utility products, PPAs, direct procurement | May use flexible demand or short-duration storage | Measured for every unmatched interval |
| Hourly matching with storage or firm clean power | Hourly or subhourly, including charging and discharge accounting | Local or deliverable renewable resources plus storage or firm clean resources | Grid-connected region with documented delivery and attribute rules | PPAs, tolling agreements, capacity contracts, firm clean-power contracts, storage agreements | Batteries, pumped storage, hydro, geothermal, nuclear, demand response, or complementary generation | Reduced but not always eliminated; duration, fuel, outages, and seasonal limits remain |
The subsections below explain where each approach falls short.
Matching Intervals and Market Boundaries
Match purchases to use at each interval to reveal gaps that annual totals hide. Report the percentage of load matched in each interval: 100% annual coverage can still leave large nighttime, weather-related, and seasonal shortfalls.[12][13]
For each facility, map electricity use to the relevant balancing authority, bidding zone, utility service territory, or national electricity market. A project can share the same grid region yet fall outside the claim boundary. Transmission congestion can also limit delivery.[13][26]
Local Generation and Procurement Contracts
Compare local or nearby grid-connected solar and wind with eligible hydro, geothermal, or nuclear supply where market rules allow. Carbon-free power includes nonrenewable clean sources such as nuclear. Contracts should spell out location, commercial-operation date (COD), expected hourly output, delivery point, curtailment rules, negative-price treatment, certificate ownership, retirement rules, outage obligations, and settlement.[24][26]
Annual purchases can finance projects and still leave hourly gaps. Purchases alone do not prove new capacity, physical delivery, or avoided emissions. Buyers seeking new capacity should ask whether the contract enabled construction, whether the project needed the agreement, and whether financing evidence and a clear baseline support the claim. Assess avoided emissions against an explicit baseline; purchased megawatt-hours do not automatically equal emissions reductions.[13][25][26]
Storage, Load Shifting, and Supply Shortfalls
Compare batteries, pumped storage, firm clean power, and flexible demand against the same interval load record. Load shifting can move flexible computing, industrial processes, or vehicle charging into cleaner hours. But it cannot remove inflexible demand or guarantee coverage through long periods of low wind or solar output.
Count only discharge backed by charged energy, after losses. Do not count the same attributes at both charging and discharge.
Seasonal shortages can outlast storage, and outages can restrict firm supply. Report unmatched hours and MWh by season and cause: the number of hours alone can hide large load shortfalls. These remaining gaps drive the verification and cost issues in the next section.
Verification, Costs, and Claims
A matching score does not replace a Scope 2 inventory. Report procurement results separately from location-based and market-based Scope 2 emissions, following the accounting rules for the reporting year. Proposed hourly rules must not be presented as adopted standards.[12][27][28] For multinational portfolios, the reporting boundary defines both the claim and its audit trail.
Each matching method differs in what it can prove, how auditors can check it, and what it costs across markets.
| Approach | Advantage and limit | Data and audit evidence | Main cost drivers | Supported claim |
|---|---|---|---|---|
| Annual renewable matching | Simpler claim verification; certificate eligibility still matters | Annual consumption, certificate vintages, serial numbers, ownership, and retirements | Certificates, administration, registry fees, and assurance | Annual renewable or EAC matching claim |
| Hourly carbon-free-energy matching | Shows coverage gaps; requires granular evidence | Interval load and generation, time-stamped certificates, market eligibility, and retirements | Metering, data, forecasting, certificates, and contracts | Measured hourly CFE coverage, with unmatched MWh disclosed |
| Hourly matching with storage or firm clean power | Helps cover difficult hours | Hourly records, charging attributes, discharge, losses, and firm-supply availability | Storage, replacement power, balancing, and firm-supply premiums | Verified hourly coverage, with storage and firm-supply assumptions disclosed |
The following subsections address audit evidence, residual emissions, and cost limits separately.
Metering, Certificates, and Audit Controls
Keep a central register that links facility meters, generation assets, contract rights, certificate serial numbers, and retirements. Align timestamps to Coordinated Universal Time (UTC), while retaining local time zones and daylight-saving flags.
Reconcile meter and certificate intervals with utility bills, and flag missing, estimated, or corrected records. Independent reviewers should test retirement records and check for duplicate attribute claims.
Residual Emissions and Claim Limits
Report matched and unmatched MWh, hourly coverage percentage, and fully covered hours as separate measures. Location-based Scope 2 uses grid emission factors. Market-based Scope 2 uses eligible contractual instruments and the residual mix.
Residual mix accounting covers load left unmatched within the market boundary. It reflects the attributes remaining after recognized allocations - not an hourly matching score. Disclose emission factors and methods, and never assume uncovered consumption has zero emissions.[12][29]
Keep surplus generation, curtailment, outages, forecast errors, and storage losses visible in the reconciliation. Surplus attributes do not automatically cancel another hour’s deficit. Avoided-emissions estimates require their own baseline and dispatch assumptions; do not deduct them from the Scope 2 inventory.[27][28][29]
Procurement Costs and the Last Coverage Gap
Costs climb fastest as matching shifts from average load to scarce hourly supply. Do not state a universal $/MWh premium for 95% hourly coverage. Compare annual administration costs with the costs of hourly data, scheduling, storage, balancing, and firm supply.
For every price presented, state the location, price year, nominal or real basis, and currency conversion basis. Specify whether the price covers generation alone or delivered and verified supply. Models must disclose load shape, resource mix, storage duration and efficiency, transmission limits, and financing assumptions.
The last few percentage points are expensive because they rely on scarce local supply and tighter verification. Assess the incremental cost of closing that gap rather than applying an average procurement price.
Conclusion: Report Coverage, Gaps, and Costs
These methods answer different questions about annual volume, hourly coverage, and remaining gaps. Use them together, not interchangeably: annual procurement sets the baseline, hourly matching shows timing gaps, and storage and firm clean power help narrow those gaps. Keep renewable and carbon-free claims separate.[28][30][31]
Start reporting locally, then aggregate globally. For each facility and country or grid region, report electricity use, annual purchases or retired certificates, hourly coverage, gaps, storage treatment, residual emissions, and costs. Include methods, boundaries, assumptions, and data limits. Global totals must not hide weak local coverage. Use these figures to guide procurement and siting decisions.
Use hourly load data to guide siting, load shifting, and procurement. Shift flexible demand, buy supply that fits the load profile, and size storage or firm clean power to close the remaining gap. Coordinate with utility and transmission planners. Engage regulators and affected communities early on land use, water, labor, reliability, affordability, and local benefits.
FAQs
How can we prioritize sites for hourly clean-power matching?
Begin with energy audits to pinpoint peak demand and steady, around-the-clock loads. Prioritize anchor loads, such as data centers or major distribution hubs, that fit hourly matching and power purchase agreements.
Check local renewable resources and grid capacity so procurement matches where and when electricity is used. Favor sites that support new-build projects to ensure additionality: adding renewable generation rather than relying on existing renewable certificates.
How do we choose between storage and load shifting?
Start with an energy audit to pinpoint peak demand and electricity use patterns. Steady, around-the-clock demand may favor baseload solutions. Variable demand may be better served by battery storage and demand response, including load shifting.
Battery storage can reduce demand charges, which can account for 30%–50% of electricity bills. Choose an approach that fits how your business runs, weighing costs, grid reliability, and your ability to manage intermittent energy flows.
How can we verify that procurement reduces emissions?
Check whether electricity purchases lead to physical change through additionality: funding new renewable capacity that would not otherwise be built. Compare location-based emissions, which reflect the physical grid mix, with market-based figures to see where actual electricity supply differs from contractual claims.
Match electricity use with generation in the same hour and region. Track consumption, and report annually on installed capacity and actual emissions reductions - not just contractual purchases.




FAQ