
Sep 13, 2026
Cradle-to-Cradle Business Model Tools: Roundup
Sustainability Strategy
In This Article
Cradle-to-cradle success depends on sequencing mapping, measurement, and decision tools—not a single silver bullet.
Cradle-to-Cradle Business Model Tools: Roundup
Only 7.2% of 100.6 billion metric tons of materials used in 2024 went back into use. If I need to build a cradle-to-cradle model, I would use three tool groups in this order: map flows, measure results, then rank options.
Here’s the short version:
Value chain mapping tools show where materials, parts, and partners enter and leave the system.
Lifecycle and circularity tools test impact, recovery rates, and product-loop performance.
Decision tools help me choose between repair, reuse, remanufacturing, recycling, or service models.
This matters because cradle-to-cradle work is not just about design. It is about cost, recovery value, partner roles, reverse logistics, and end-of-life choices. The article’s main point is simple: no single tool does the whole job. I get better results when I treat the toolset as a sequence:
Map the chain and the missing links
Measure impact and circular performance
Decide which model or recovery path makes the most sense
Refine with pilot data and new constraints
A few points stand out:
Tools like Circular Canvas, CBMC, Value Chain Canvas, and Partner Map help me see leak points and partner gaps.
Tools like openLCA, SimaPro, GaBi, Brightway2, MCI, Circulytics, CircularTracker, and CELAVI help me test product loops with data.
Methods like AHP, TOPSIS, VIKOR, PROMETHEE-II, MIVES, and PR-MCDT help turn analysis into a board-level choice.
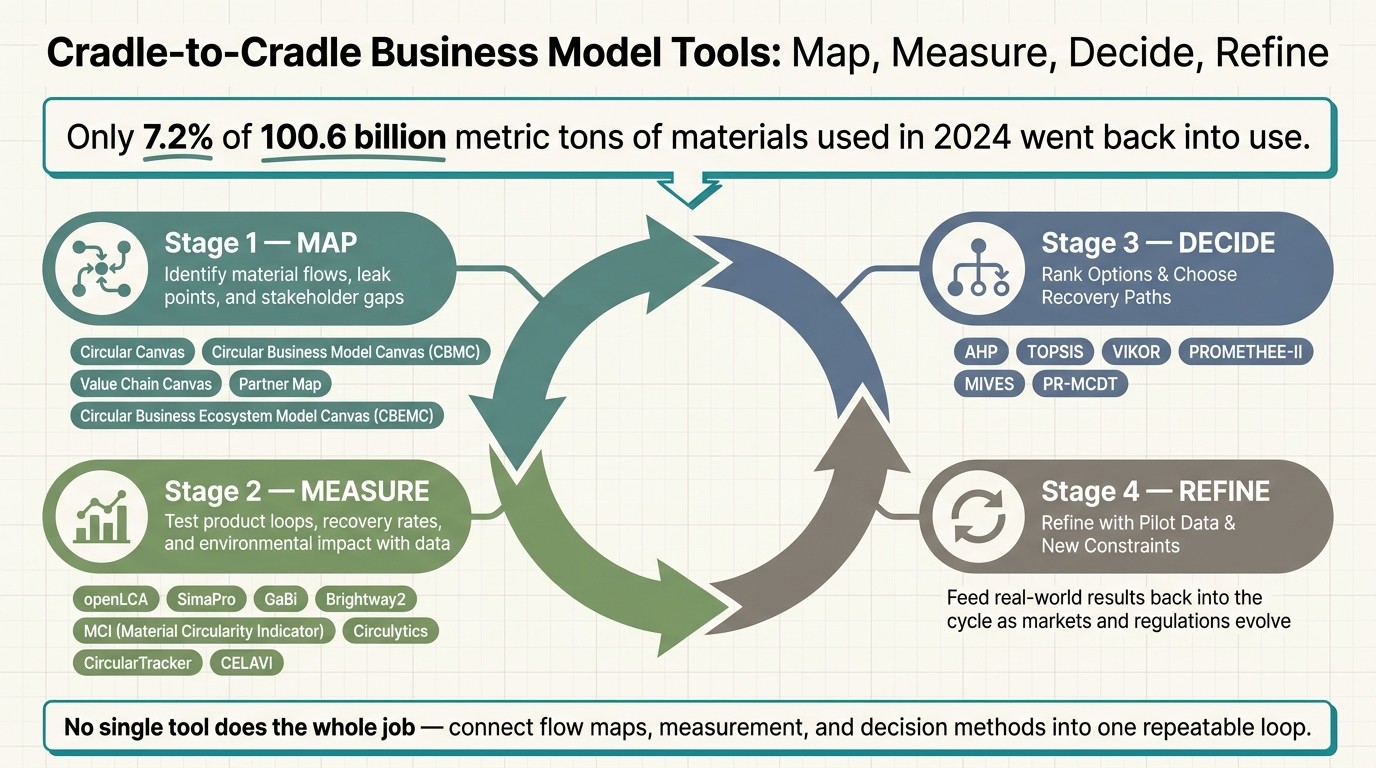
Cradle-to-Cradle Business Model Tools: Map, Measure, Decide, Refine
Cradle to Cradle Certification deep dive
Quick Comparison
Tool group | What I use it for | Best at | Main limit |
|---|---|---|---|
Value chain mapping | Seeing flows, actors, and leak points | Early design and partner planning | Does not prove impact on its own |
Lifecycle and circularity data | Testing product loops and recovery paths | Comparing scenarios with numbers | Data needs can be high |
Decision support | Ranking options across cost, carbon, and feasibility | Turning analysis into a clear choice | Output depends on criteria and weights |
If I had to boil the full article down to one line, it would be this: cradle-to-cradle planning works best when I connect flow maps, measurement, and decision methods into one repeatable loop.
Value chain mapping tools for cradle-to-cradle business model design
Value chain mapping tools show how materials move through design, sourcing, manufacturing, use, repair, collection, and recovery. That sounds simple, but it changes the conversation fast. Instead of talking about circularity in broad terms, teams can see where handoffs happen, where materials leak out of the system, and where reuse, repair, remanufacturing, or recycling can happen in practice. They also make stakeholder roles plain, expose reverse logistics gaps, and set up the questions that later lifecycle and financial models need to test.
The main tools approach that map in different ways.
Circular Canvas and Circular Business Model Canvas
The Circular Canvas maps material, energy, and information flows across the lifecycle on a single page, with attention on losses and recovery points. Teams can mark current loops and sketch new ones, including take-back, maintenance, refurbishment, and remanufacturing.[2][3][5]
If the Circular Canvas lays out the flows, the CBMC turns those flows into business-model choices.
The Circular Business Model Canvas keeps the nine blocks and adds prompts around reuse, recovery, and impact. It ties material loops to revenue, reverse logistics, and recovery channels, so teams can see what changes when a company moves from selling units to offering outcomes. That shift can change partner roles, service needs, and end-of-life collection. A useful way to work is to build the current and proposed canvases side by side, then use the gaps to spot the partners, infrastructure, and design shifts the new model will need.[4][7]
Value Chain Canvas, Partner Map, and value mapping frameworks
The Value Chain Canvas breaks the system into stages such as design, sourcing, manufacturing, distribution, use, repair/maintenance, collection, and next use. At each stage, it records key activities, stakeholders, inputs, outputs, and waste. This is often where the weak points become hard to ignore: a repair system that depends on spare parts no one stocks, components thrown away at end-of-life even though they still hold remanufacturing value, or incentives that push replacement instead of longer product life.[3][6]
The Partner Map adds the people and institutions around that chain. It identifies actors at each stage, including suppliers, logistics providers, certified repair shops, recyclers, municipalities, NGOs, and regulators, then looks at their interests and level of engagement. In plain terms, it shows who is missing. If refurbishers, logistics providers, or recyclers are not in place, take-back may stall unless new partnerships or new infrastructure are built.[5][6]
These tools vary in scope, but they all support the same design job: making the system visible enough to change.
Tool | Primary Purpose | Lifecycle Coverage | Typical Use Case | Data Requirements |
|---|---|---|---|---|
Circular Canvas | Map material, energy, and information flows and identify circular opportunities | Full lifecycle | Redesigning a business model around circular loops | Flow types, stakeholder roles, lifecycle impacts |
Circular Business Model Canvas | Redesign core business elements for circular flows | Full lifecycle | Strategic planning for take-back and service models | Value propositions, revenue streams, key partners, recovery channels |
Value Chain Canvas | Break the value chain into stages and identify waste and missed value | Sourcing through next use | Operational mapping of circular stages and dependencies | Process inputs, outputs, waste volumes, partner roles |
Partner Map | Identify and assess stakeholder roles and engagement | Collaboration and recovery stages | Building reverse logistics networks and regional partnerships | Partner capabilities, interests, logistics infrastructure |
Collaborative mapping in multi-stakeholder settings
Circular systems rarely stay inside one company's walls. Regional material recovery, shared reverse logistics, and coordinated take-back programs depend on governments, nonprofits, foundations, and private firms agreeing on roles. Multi-stakeholder mapping helps these groups see who must act together before any circular model can grow. That matters, because it gives them a shared picture to work from instead of asking them to negotiate in the abstract.[3][8][1]
Academic work on the Circular Business Ecosystem Model Canvas (CBEMC) shows that circular value chains often need multiple connected business models across a network of actors. Mapping those models in sequence helps teams spot where shared value propositions and coordination mechanisms are absent.[1] Templates hosted on collaborative whiteboard platforms like Miro can also make these sessions workable across organizations and geographies, especially when teams are remote.
Once the map is clear, teams can quantify impact and recovery with lifecycle data.
Lifecycle data and circularity assessment tools
Once value chain mapping is done, the next step is measuring performance. Lifecycle data and circularity assessment tools usually fall into three buckets: LCA platforms for environmental impact, circularity indicators for circular performance, and hybrid tools for transition scenarios. The goal is bigger than measurement for its own sake. Teams use these tools to choose loops, contracts, and recovery channels that can actually run in day-to-day operations. In that sense, the metrics turn a circular map into evidence for business model decisions.
LCA platforms for modeling environmental impact
openLCA, SimaPro, GaBi, and Brightway2 are the main platforms for full lifecycle environmental modeling. They follow ISO 14040/14044 standards and measure climate, water, resource, and toxicity impacts across the full life cycle.[10][13][14][17]
For cradle-to-cradle work, scenario comparison is where these tools earn their keep. A team can model recycled-content, take-back, remanufacturing, and disposal paths by changing reuse cycles, recycling rates, energy source, and transport mode.[10][12][16] That makes it much easier to compare, say, a repair loop against a one-way disposal path instead of relying on gut instinct.
These platforms depend on background databases such as ecoinvent for life cycle inventory data. Many ecoinvent datasets use European or global averages, so North American-specific datasets are a better fit when they are available.[10][13][16] Cost matters too. ecoinvent licenses run about CHF 1,650 per year, and commercial suites can climb into the five figures for a single professional license.[16][19]
One caution here: different platforms can produce different results even when the inputs are the same. That is why teams should validate outputs before using them for investment cases or public reporting.[10]
Circularity indicators for products and organizations
Circularity indicators measure how circular a product or organization is, not its full environmental impact. Most use a 0-to-1 scale or a percentage, based on inputs such as recycled content share, recovery rate, number of use cycles, and design attributes.[9][11][15]
The Material Circularity Indicator (MCI) pulls virgin input, unrecoverable waste, and product utility into one score. It aligns with ISO 59020, which makes it a useful reference point for standardized circularity reporting.[25][26][29]
Circulytics looks at organizations across material flows, business model innovation, water, energy, finance, and assets.[27][28][30] It fits executive benchmarking and disclosure better than product-level analysis.
At the product level, tools such as CCET, CEIP, CET, and CPI use structured questionnaires and design-attribute reviews to rate circularity potential early in the design process.[9][11][15][18] The CCET, for example, can show how well a concept lines up with circular principles before detailed engineering starts. That is handy when a team is weighing a modular, repairable product against a sealed unit built for replacement. In practice, these tools work well for screening and design choices, while LCA is the check on whether the option also cuts environmental impact.[9][11][15]
That distinction matters. A circularity score can go up while total impacts also go up, which is why indicators are best for screening and LCA is best for validation.[9][10][11][15]
Hybrid and visualization tools for transition planning
Sometimes teams do not just need a score; they need to test a path forward. That is where hybrid tools come in. These tools add scenario depth by modeling transition pathways across value chains and regional systems.
CELAVI combines simulation, material flow analysis, LCA, and network analysis in one framework.[20][22][24] Its outputs include material and energy flow rates for all modeled circular strategies, input and output circularity percentages, and environmental impacts calculated with the TRACI method. It also produces time-series data, which lets teams track how impacts change as a supply chain shifts from linear to circular.[22][24]
CircularTracker takes ISO-compliant Product Circularity Data Sheets (PCDS) as inputs and turns them into standardized circularity reports on material recovery, product longevity, reuse potential, and end-of-life strategies.[21][23] For business teams that need structured assessments without building custom LCA models, it is a more practical entry point.
The table below shows how these tool categories compare across the dimensions that matter most in cradle-to-cradle work:
Tool | Scope | Key Metrics | Data Intensity |
|---|---|---|---|
openLCA | Full lifecycle, process-level | GHG emissions, energy use, water use, toxicity | High |
SimaPro / GaBi | Full lifecycle, corporate and portfolio analysis | GHG, resource depletion, acidification, eutrophication | High |
Brightway2 | Full lifecycle, large-scale or research | Full impact categories; uncertainty analysis | Very high |
MCI | Product-level circularity | Virgin material input, unrecoverable waste, utility factor | Low–Medium |
Circulytics | Organization-level circularity | Material flows, business model, water and energy, finance, assets | Medium |
CCET / CEIP / CET / CPI | Product concept–level | Circularity potential, design attributes | Low |
CircularTracker | Product-level, standardized | Material recovery, product longevity, reuse potential, end-of-life strategy | Low–Medium |
CELAVI | System/regional, time-series | Material flows, circularity percentages, TRACI impacts | High |
Taken together, these metrics help narrow the set of strategy choices that decision-support tools still need to sort out.
Decision-support tools that turn analysis into business model choices
Once mapping and lifecycle analysis lay out the tradeoffs, decision-support tools help teams make a call. Lifecycle data and circularity scores show what each path gives up or gains. The next step is simpler to say than to do: compare cost, carbon, feasibility, and stakeholder priorities in one decision frame.
Multi-criteria decision methods for circular strategy selection
When a leadership team is choosing between repair, reuse, remanufacturing, recycling, or a product-as-a-service model, one metric rarely settles it. Each option looks different depending on how the team weighs capital cost, greenhouse gas reduction, reverse-logistics feasibility, and customer experience. That’s the kind of knot multi-criteria decision-making, or MCDM, methods are built to untie.
AHP (Analytic Hierarchy Process) is often the best place to start. It breaks the decision into a hierarchy: goal, criteria, sub-criteria, and alternatives. Then it uses pairwise comparisons to assign weights. In cross-functional workshops, that structure works well because it forces people to agree on what matters most before anyone starts ranking options. Pairing AHP with lifecycle data helps keep those weights tied to evidence rather than opinion alone. [40][36]
TOPSIS and VIKOR work a bit differently. Both rank options based on how close each one comes to the best-case outcome. VIKOR leans harder into finding the best compromise when criteria pull in opposite directions. If a team already has solid quantitative inputs from LCA or circularity indicators, either method can produce a clear rank order without much hand-waving. PROMETHEE-II fits better when some options must clear minimum recyclability levels or meet regulatory thresholds, since its outranking logic can account for those cutoffs. [36][41][40]
MIVES (Modelo Integrado de Valor para una Evaluación Sostenible) blends AHP-based weighting with value functions to roll up economic, environmental, and social indicators into one sustainability index. [31][32][33][37]
The main point is easy to miss: criteria selection is a governance choice, not just an analysis step. The criteria you include, and the weight you give each one, shape which circular strategy rises to the top. That’s why executives need to be involved when the criteria framework is set, not only when the final ranking lands on a slide.
Use the table below to match each method to the decision it supports.
Tool or Method | Primary Application | Criteria Domains | Integration with Lifecycle Data | Typical Decision Context |
|---|---|---|---|---|
AHP | Criteria weighting and strategy structuring | Financial, environmental, technical, social | Moderate - weights lifecycle inputs but requires manual integration | Circular strategy workshops; early-stage option screening |
TOPSIS | Ranking alternatives against an ideal solution | Financial, environmental, technical, social | High - accepts quantitative LCA and circularity outputs directly | Comparing repair vs. remanufacturing vs. recycling with clear data |
VIKOR | Compromise solution under conflicting objectives | Financial, environmental, operational | High - uses quantitative criteria; handles trade-off minimization | Capital allocation when no option dominates across all criteria |
PROMETHEE-II | Outranking with preference thresholds | Financial, environmental, social, regulatory | Moderate - integrates lifecycle data and qualitative preferences | Strategy selection where regulatory floors or minimum standards apply |
MIVES | Sustainability index across economic, environmental, and social pillars | Economic, environmental, social | High - designed to integrate lifecycle-based indicators into value functions | Infrastructure, product design, and circular model evaluation |
PR-MCDT | End-of-life and product recovery routing | Technical, economic, environmental, business, societal | Moderate - uses product condition and recovery-yield data | Take-back program design; returned-product routing decisions |
Product recovery and end-of-life decision tools
When the question changes from Which circular model should we back? to What should we do with this returned product?, general MCDM methods are less suited to the job. PR-MCDT (Product Recovery Multi-Criteria Decision Tool) was built for that routing decision. [34][35][38][39]
PR-MCDT scores reuse, repair, refurbishment, remanufacturing, recycling, and disposal against technical, economic, environmental, legal, and market criteria. [35][38] That matters in the real world because the same returned product can have more than one workable recovery route. Its condition, residual value, and market demand for recovered materials can shift the answer fast.
How consulting teams integrate decision support into implementation
A ranking on its own doesn’t change much. It has to turn into a roadmap, a capital plan, and an operating model.
Council Fire turns lifecycle evidence and stakeholder priorities into criteria, then into phased investment, operating changes, and metrics - so the circular strategy choice becomes a practical pathway with owners, timelines, and performance targets.
Conclusion: How to choose the right tool set for cradle-to-cradle work
Taken together, the tools in this roundup work best as a workflow, not a checklist. No single tool covers the full cradle-to-cradle process. Value chain mapping, lifecycle and circularity data, and decision-support methods each do a different job.
A simple sequence helps keep the work grounded:
Map value chains and partners
Measure lifecycle and circularity performance
Rank options with decision-support methods such as PR-MCDT or fuzzy TOPSIS
Once that sequence is in place, the next step is choosing the right fit.
Match the tool to the decision in front of you. Use workshop-friendly canvases during early design work. Use standardized indicators when you need comparable metrics across products, sites, or reporting periods. The right choice also depends on the data you have, the purpose of the decision, and how many stakeholders are involved at each stage.
The strongest approach brings all three layers together. Mapping sets the scope. Measurement checks the options. Decision tools turn those findings into a choice that has a clear rationale.
It also helps to treat the toolkit as a feedback loop. Pilots produce data, markets shift, and regulations change. Organizations that keep cradle-to-cradle work moving build that loop into day-to-day practice - and repeat it. Progress comes from doing the cycle again: map, measure, decide, refine.
FAQs
Which tool should I start with?
Start with a clear diagnostic base. If you're tracking circularity, Circular Transition Indicators (CTI) help you measure resource efficiency, recycling rates, and material flows.
If the goal is to map material dependencies and waste streams, use Material Flow Analysis (MFA). If you need to look at environmental impacts across a product’s full life, put Life Cycle Assessment (LCA) at the center of your approach. The right tool depends on what you're trying to answer, how complex the product is, the quality of your data, and how much technical skill your team has.
How much data do these tools require?
Data needs change a lot depending on what you’re trying to measure and how complex the product is. Lifecycle assessment tools rely heavily on life cycle inventory data. That usually includes raw materials, energy use, water use, emissions, and waste.
Supplier-specific primary data gives you the closest picture of what’s happening. Still, many tools can fill in missing pieces with secondary industry data, which helps when direct inputs aren’t available. For value chain mapping and circularity tracking, you’ll also need entity details, activity volumes, and sustainability metrics across each supply chain node.
How do I choose between repair, reuse, and recycling?
Follow the value retention hierarchy: pick the path that keeps the most embedded energy, complexity, and value in play.
Put maintenance, repair, and reuse first. Turn to remanufacturing only after those options stop making sense, and use recycling when higher-value routes are no longer practical. Value chain mapping and material flow analysis can help show where products and materials can stay in circulation most effectively.
Related Blog Posts
Latest Articles
©2025

Narrative Change and Power Building: The Missing Half of Advocacy
Narrative change is the process of disrupting dominant narratives that normalize inequity and advancing new narratives from historically marginalized communities.

Funding Resilience Without Federal Grants
BRIC is unreliable and FEMA is shrinking. Here's how cities fund climate resilience with dedicated revenue, blended finance, and a coordinating authority.

The ESG Blind Spot: How AI Is Finding Risks in Companies Nobody Else Is Watching
Norway's sovereign wealth fund uses AI to screen 7,200 portfolio companies for forced labor and corruption within 24 hours. The real story is the emerging-market coverage gap that traditional ESG data vendors miss — and what it means for any company with a global supply chain.
Narrative Change and Power Building: The Missing Half of Advocacy
Narrative change is the process of disrupting dominant narratives that normalize inequity and advancing new narratives from historically marginalized communities.
Funding Resilience Without Federal Grants
BRIC is unreliable and FEMA is shrinking. Here's how cities fund climate resilience with dedicated revenue, blended finance, and a coordinating authority.
The ESG Blind Spot: How AI Is Finding Risks in Companies Nobody Else Is Watching
Norway's sovereign wealth fund uses AI to screen 7,200 portfolio companies for forced labor and corruption within 24 hours. The real story is the emerging-market coverage gap that traditional ESG data vendors miss — and what it means for any company with a global supply chain.
FAQ
01
What does it really mean to “redefine profit”?
02
What makes Council Fire different?
03
Who does Council Fire work with?
04
What does working with Council Fire actually look like?
05
How does Council Fire help organizations turn big goals into action?
06
How does Council Fire define and measure success?
Sep 13, 2026
Cradle-to-Cradle Business Model Tools: Roundup
Sustainability Strategy
In This Article
Cradle-to-cradle success depends on sequencing mapping, measurement, and decision tools—not a single silver bullet.
Cradle-to-Cradle Business Model Tools: Roundup
Only 7.2% of 100.6 billion metric tons of materials used in 2024 went back into use. If I need to build a cradle-to-cradle model, I would use three tool groups in this order: map flows, measure results, then rank options.
Here’s the short version:
Value chain mapping tools show where materials, parts, and partners enter and leave the system.
Lifecycle and circularity tools test impact, recovery rates, and product-loop performance.
Decision tools help me choose between repair, reuse, remanufacturing, recycling, or service models.
This matters because cradle-to-cradle work is not just about design. It is about cost, recovery value, partner roles, reverse logistics, and end-of-life choices. The article’s main point is simple: no single tool does the whole job. I get better results when I treat the toolset as a sequence:
Map the chain and the missing links
Measure impact and circular performance
Decide which model or recovery path makes the most sense
Refine with pilot data and new constraints
A few points stand out:
Tools like Circular Canvas, CBMC, Value Chain Canvas, and Partner Map help me see leak points and partner gaps.
Tools like openLCA, SimaPro, GaBi, Brightway2, MCI, Circulytics, CircularTracker, and CELAVI help me test product loops with data.
Methods like AHP, TOPSIS, VIKOR, PROMETHEE-II, MIVES, and PR-MCDT help turn analysis into a board-level choice.
Cradle-to-Cradle Business Model Tools: Map, Measure, Decide, Refine
Cradle to Cradle Certification deep dive
Quick Comparison
Tool group | What I use it for | Best at | Main limit |
|---|---|---|---|
Value chain mapping | Seeing flows, actors, and leak points | Early design and partner planning | Does not prove impact on its own |
Lifecycle and circularity data | Testing product loops and recovery paths | Comparing scenarios with numbers | Data needs can be high |
Decision support | Ranking options across cost, carbon, and feasibility | Turning analysis into a clear choice | Output depends on criteria and weights |
If I had to boil the full article down to one line, it would be this: cradle-to-cradle planning works best when I connect flow maps, measurement, and decision methods into one repeatable loop.
Value chain mapping tools for cradle-to-cradle business model design
Value chain mapping tools show how materials move through design, sourcing, manufacturing, use, repair, collection, and recovery. That sounds simple, but it changes the conversation fast. Instead of talking about circularity in broad terms, teams can see where handoffs happen, where materials leak out of the system, and where reuse, repair, remanufacturing, or recycling can happen in practice. They also make stakeholder roles plain, expose reverse logistics gaps, and set up the questions that later lifecycle and financial models need to test.
The main tools approach that map in different ways.
Circular Canvas and Circular Business Model Canvas
The Circular Canvas maps material, energy, and information flows across the lifecycle on a single page, with attention on losses and recovery points. Teams can mark current loops and sketch new ones, including take-back, maintenance, refurbishment, and remanufacturing.[2][3][5]
If the Circular Canvas lays out the flows, the CBMC turns those flows into business-model choices.
The Circular Business Model Canvas keeps the nine blocks and adds prompts around reuse, recovery, and impact. It ties material loops to revenue, reverse logistics, and recovery channels, so teams can see what changes when a company moves from selling units to offering outcomes. That shift can change partner roles, service needs, and end-of-life collection. A useful way to work is to build the current and proposed canvases side by side, then use the gaps to spot the partners, infrastructure, and design shifts the new model will need.[4][7]
Value Chain Canvas, Partner Map, and value mapping frameworks
The Value Chain Canvas breaks the system into stages such as design, sourcing, manufacturing, distribution, use, repair/maintenance, collection, and next use. At each stage, it records key activities, stakeholders, inputs, outputs, and waste. This is often where the weak points become hard to ignore: a repair system that depends on spare parts no one stocks, components thrown away at end-of-life even though they still hold remanufacturing value, or incentives that push replacement instead of longer product life.[3][6]
The Partner Map adds the people and institutions around that chain. It identifies actors at each stage, including suppliers, logistics providers, certified repair shops, recyclers, municipalities, NGOs, and regulators, then looks at their interests and level of engagement. In plain terms, it shows who is missing. If refurbishers, logistics providers, or recyclers are not in place, take-back may stall unless new partnerships or new infrastructure are built.[5][6]
These tools vary in scope, but they all support the same design job: making the system visible enough to change.
Tool | Primary Purpose | Lifecycle Coverage | Typical Use Case | Data Requirements |
|---|---|---|---|---|
Circular Canvas | Map material, energy, and information flows and identify circular opportunities | Full lifecycle | Redesigning a business model around circular loops | Flow types, stakeholder roles, lifecycle impacts |
Circular Business Model Canvas | Redesign core business elements for circular flows | Full lifecycle | Strategic planning for take-back and service models | Value propositions, revenue streams, key partners, recovery channels |
Value Chain Canvas | Break the value chain into stages and identify waste and missed value | Sourcing through next use | Operational mapping of circular stages and dependencies | Process inputs, outputs, waste volumes, partner roles |
Partner Map | Identify and assess stakeholder roles and engagement | Collaboration and recovery stages | Building reverse logistics networks and regional partnerships | Partner capabilities, interests, logistics infrastructure |
Collaborative mapping in multi-stakeholder settings
Circular systems rarely stay inside one company's walls. Regional material recovery, shared reverse logistics, and coordinated take-back programs depend on governments, nonprofits, foundations, and private firms agreeing on roles. Multi-stakeholder mapping helps these groups see who must act together before any circular model can grow. That matters, because it gives them a shared picture to work from instead of asking them to negotiate in the abstract.[3][8][1]
Academic work on the Circular Business Ecosystem Model Canvas (CBEMC) shows that circular value chains often need multiple connected business models across a network of actors. Mapping those models in sequence helps teams spot where shared value propositions and coordination mechanisms are absent.[1] Templates hosted on collaborative whiteboard platforms like Miro can also make these sessions workable across organizations and geographies, especially when teams are remote.
Once the map is clear, teams can quantify impact and recovery with lifecycle data.
Lifecycle data and circularity assessment tools
Once value chain mapping is done, the next step is measuring performance. Lifecycle data and circularity assessment tools usually fall into three buckets: LCA platforms for environmental impact, circularity indicators for circular performance, and hybrid tools for transition scenarios. The goal is bigger than measurement for its own sake. Teams use these tools to choose loops, contracts, and recovery channels that can actually run in day-to-day operations. In that sense, the metrics turn a circular map into evidence for business model decisions.
LCA platforms for modeling environmental impact
openLCA, SimaPro, GaBi, and Brightway2 are the main platforms for full lifecycle environmental modeling. They follow ISO 14040/14044 standards and measure climate, water, resource, and toxicity impacts across the full life cycle.[10][13][14][17]
For cradle-to-cradle work, scenario comparison is where these tools earn their keep. A team can model recycled-content, take-back, remanufacturing, and disposal paths by changing reuse cycles, recycling rates, energy source, and transport mode.[10][12][16] That makes it much easier to compare, say, a repair loop against a one-way disposal path instead of relying on gut instinct.
These platforms depend on background databases such as ecoinvent for life cycle inventory data. Many ecoinvent datasets use European or global averages, so North American-specific datasets are a better fit when they are available.[10][13][16] Cost matters too. ecoinvent licenses run about CHF 1,650 per year, and commercial suites can climb into the five figures for a single professional license.[16][19]
One caution here: different platforms can produce different results even when the inputs are the same. That is why teams should validate outputs before using them for investment cases or public reporting.[10]
Circularity indicators for products and organizations
Circularity indicators measure how circular a product or organization is, not its full environmental impact. Most use a 0-to-1 scale or a percentage, based on inputs such as recycled content share, recovery rate, number of use cycles, and design attributes.[9][11][15]
The Material Circularity Indicator (MCI) pulls virgin input, unrecoverable waste, and product utility into one score. It aligns with ISO 59020, which makes it a useful reference point for standardized circularity reporting.[25][26][29]
Circulytics looks at organizations across material flows, business model innovation, water, energy, finance, and assets.[27][28][30] It fits executive benchmarking and disclosure better than product-level analysis.
At the product level, tools such as CCET, CEIP, CET, and CPI use structured questionnaires and design-attribute reviews to rate circularity potential early in the design process.[9][11][15][18] The CCET, for example, can show how well a concept lines up with circular principles before detailed engineering starts. That is handy when a team is weighing a modular, repairable product against a sealed unit built for replacement. In practice, these tools work well for screening and design choices, while LCA is the check on whether the option also cuts environmental impact.[9][11][15]
That distinction matters. A circularity score can go up while total impacts also go up, which is why indicators are best for screening and LCA is best for validation.[9][10][11][15]
Hybrid and visualization tools for transition planning
Sometimes teams do not just need a score; they need to test a path forward. That is where hybrid tools come in. These tools add scenario depth by modeling transition pathways across value chains and regional systems.
CELAVI combines simulation, material flow analysis, LCA, and network analysis in one framework.[20][22][24] Its outputs include material and energy flow rates for all modeled circular strategies, input and output circularity percentages, and environmental impacts calculated with the TRACI method. It also produces time-series data, which lets teams track how impacts change as a supply chain shifts from linear to circular.[22][24]
CircularTracker takes ISO-compliant Product Circularity Data Sheets (PCDS) as inputs and turns them into standardized circularity reports on material recovery, product longevity, reuse potential, and end-of-life strategies.[21][23] For business teams that need structured assessments without building custom LCA models, it is a more practical entry point.
The table below shows how these tool categories compare across the dimensions that matter most in cradle-to-cradle work:
Tool | Scope | Key Metrics | Data Intensity |
|---|---|---|---|
openLCA | Full lifecycle, process-level | GHG emissions, energy use, water use, toxicity | High |
SimaPro / GaBi | Full lifecycle, corporate and portfolio analysis | GHG, resource depletion, acidification, eutrophication | High |
Brightway2 | Full lifecycle, large-scale or research | Full impact categories; uncertainty analysis | Very high |
MCI | Product-level circularity | Virgin material input, unrecoverable waste, utility factor | Low–Medium |
Circulytics | Organization-level circularity | Material flows, business model, water and energy, finance, assets | Medium |
CCET / CEIP / CET / CPI | Product concept–level | Circularity potential, design attributes | Low |
CircularTracker | Product-level, standardized | Material recovery, product longevity, reuse potential, end-of-life strategy | Low–Medium |
CELAVI | System/regional, time-series | Material flows, circularity percentages, TRACI impacts | High |
Taken together, these metrics help narrow the set of strategy choices that decision-support tools still need to sort out.
Decision-support tools that turn analysis into business model choices
Once mapping and lifecycle analysis lay out the tradeoffs, decision-support tools help teams make a call. Lifecycle data and circularity scores show what each path gives up or gains. The next step is simpler to say than to do: compare cost, carbon, feasibility, and stakeholder priorities in one decision frame.
Multi-criteria decision methods for circular strategy selection
When a leadership team is choosing between repair, reuse, remanufacturing, recycling, or a product-as-a-service model, one metric rarely settles it. Each option looks different depending on how the team weighs capital cost, greenhouse gas reduction, reverse-logistics feasibility, and customer experience. That’s the kind of knot multi-criteria decision-making, or MCDM, methods are built to untie.
AHP (Analytic Hierarchy Process) is often the best place to start. It breaks the decision into a hierarchy: goal, criteria, sub-criteria, and alternatives. Then it uses pairwise comparisons to assign weights. In cross-functional workshops, that structure works well because it forces people to agree on what matters most before anyone starts ranking options. Pairing AHP with lifecycle data helps keep those weights tied to evidence rather than opinion alone. [40][36]
TOPSIS and VIKOR work a bit differently. Both rank options based on how close each one comes to the best-case outcome. VIKOR leans harder into finding the best compromise when criteria pull in opposite directions. If a team already has solid quantitative inputs from LCA or circularity indicators, either method can produce a clear rank order without much hand-waving. PROMETHEE-II fits better when some options must clear minimum recyclability levels or meet regulatory thresholds, since its outranking logic can account for those cutoffs. [36][41][40]
MIVES (Modelo Integrado de Valor para una Evaluación Sostenible) blends AHP-based weighting with value functions to roll up economic, environmental, and social indicators into one sustainability index. [31][32][33][37]
The main point is easy to miss: criteria selection is a governance choice, not just an analysis step. The criteria you include, and the weight you give each one, shape which circular strategy rises to the top. That’s why executives need to be involved when the criteria framework is set, not only when the final ranking lands on a slide.
Use the table below to match each method to the decision it supports.
Tool or Method | Primary Application | Criteria Domains | Integration with Lifecycle Data | Typical Decision Context |
|---|---|---|---|---|
AHP | Criteria weighting and strategy structuring | Financial, environmental, technical, social | Moderate - weights lifecycle inputs but requires manual integration | Circular strategy workshops; early-stage option screening |
TOPSIS | Ranking alternatives against an ideal solution | Financial, environmental, technical, social | High - accepts quantitative LCA and circularity outputs directly | Comparing repair vs. remanufacturing vs. recycling with clear data |
VIKOR | Compromise solution under conflicting objectives | Financial, environmental, operational | High - uses quantitative criteria; handles trade-off minimization | Capital allocation when no option dominates across all criteria |
PROMETHEE-II | Outranking with preference thresholds | Financial, environmental, social, regulatory | Moderate - integrates lifecycle data and qualitative preferences | Strategy selection where regulatory floors or minimum standards apply |
MIVES | Sustainability index across economic, environmental, and social pillars | Economic, environmental, social | High - designed to integrate lifecycle-based indicators into value functions | Infrastructure, product design, and circular model evaluation |
PR-MCDT | End-of-life and product recovery routing | Technical, economic, environmental, business, societal | Moderate - uses product condition and recovery-yield data | Take-back program design; returned-product routing decisions |
Product recovery and end-of-life decision tools
When the question changes from Which circular model should we back? to What should we do with this returned product?, general MCDM methods are less suited to the job. PR-MCDT (Product Recovery Multi-Criteria Decision Tool) was built for that routing decision. [34][35][38][39]
PR-MCDT scores reuse, repair, refurbishment, remanufacturing, recycling, and disposal against technical, economic, environmental, legal, and market criteria. [35][38] That matters in the real world because the same returned product can have more than one workable recovery route. Its condition, residual value, and market demand for recovered materials can shift the answer fast.
How consulting teams integrate decision support into implementation
A ranking on its own doesn’t change much. It has to turn into a roadmap, a capital plan, and an operating model.
Council Fire turns lifecycle evidence and stakeholder priorities into criteria, then into phased investment, operating changes, and metrics - so the circular strategy choice becomes a practical pathway with owners, timelines, and performance targets.
Conclusion: How to choose the right tool set for cradle-to-cradle work
Taken together, the tools in this roundup work best as a workflow, not a checklist. No single tool covers the full cradle-to-cradle process. Value chain mapping, lifecycle and circularity data, and decision-support methods each do a different job.
A simple sequence helps keep the work grounded:
Map value chains and partners
Measure lifecycle and circularity performance
Rank options with decision-support methods such as PR-MCDT or fuzzy TOPSIS
Once that sequence is in place, the next step is choosing the right fit.
Match the tool to the decision in front of you. Use workshop-friendly canvases during early design work. Use standardized indicators when you need comparable metrics across products, sites, or reporting periods. The right choice also depends on the data you have, the purpose of the decision, and how many stakeholders are involved at each stage.
The strongest approach brings all three layers together. Mapping sets the scope. Measurement checks the options. Decision tools turn those findings into a choice that has a clear rationale.
It also helps to treat the toolkit as a feedback loop. Pilots produce data, markets shift, and regulations change. Organizations that keep cradle-to-cradle work moving build that loop into day-to-day practice - and repeat it. Progress comes from doing the cycle again: map, measure, decide, refine.
FAQs
Which tool should I start with?
Start with a clear diagnostic base. If you're tracking circularity, Circular Transition Indicators (CTI) help you measure resource efficiency, recycling rates, and material flows.
If the goal is to map material dependencies and waste streams, use Material Flow Analysis (MFA). If you need to look at environmental impacts across a product’s full life, put Life Cycle Assessment (LCA) at the center of your approach. The right tool depends on what you're trying to answer, how complex the product is, the quality of your data, and how much technical skill your team has.
How much data do these tools require?
Data needs change a lot depending on what you’re trying to measure and how complex the product is. Lifecycle assessment tools rely heavily on life cycle inventory data. That usually includes raw materials, energy use, water use, emissions, and waste.
Supplier-specific primary data gives you the closest picture of what’s happening. Still, many tools can fill in missing pieces with secondary industry data, which helps when direct inputs aren’t available. For value chain mapping and circularity tracking, you’ll also need entity details, activity volumes, and sustainability metrics across each supply chain node.
How do I choose between repair, reuse, and recycling?
Follow the value retention hierarchy: pick the path that keeps the most embedded energy, complexity, and value in play.
Put maintenance, repair, and reuse first. Turn to remanufacturing only after those options stop making sense, and use recycling when higher-value routes are no longer practical. Value chain mapping and material flow analysis can help show where products and materials can stay in circulation most effectively.
Related Blog Posts
Latest Articles
©2025
Narrative Change and Power Building: The Missing Half of Advocacy
Narrative change is the process of disrupting dominant narratives that normalize inequity and advancing new narratives from historically marginalized communities.
Funding Resilience Without Federal Grants
BRIC is unreliable and FEMA is shrinking. Here's how cities fund climate resilience with dedicated revenue, blended finance, and a coordinating authority.
The ESG Blind Spot: How AI Is Finding Risks in Companies Nobody Else Is Watching
Norway's sovereign wealth fund uses AI to screen 7,200 portfolio companies for forced labor and corruption within 24 hours. The real story is the emerging-market coverage gap that traditional ESG data vendors miss — and what it means for any company with a global supply chain.
FAQ
01
What does it really mean to “redefine profit”?
02
What makes Council Fire different?
03
Who does Council Fire work with?
04
What does working with Council Fire actually look like?
05
How does Council Fire help organizations turn big goals into action?
06
How does Council Fire define and measure success?
Sep 13, 2026
Cradle-to-Cradle Business Model Tools: Roundup
Sustainability Strategy
In This Article
Cradle-to-cradle success depends on sequencing mapping, measurement, and decision tools—not a single silver bullet.
Cradle-to-Cradle Business Model Tools: Roundup
Only 7.2% of 100.6 billion metric tons of materials used in 2024 went back into use. If I need to build a cradle-to-cradle model, I would use three tool groups in this order: map flows, measure results, then rank options.
Here’s the short version:
Value chain mapping tools show where materials, parts, and partners enter and leave the system.
Lifecycle and circularity tools test impact, recovery rates, and product-loop performance.
Decision tools help me choose between repair, reuse, remanufacturing, recycling, or service models.
This matters because cradle-to-cradle work is not just about design. It is about cost, recovery value, partner roles, reverse logistics, and end-of-life choices. The article’s main point is simple: no single tool does the whole job. I get better results when I treat the toolset as a sequence:
Map the chain and the missing links
Measure impact and circular performance
Decide which model or recovery path makes the most sense
Refine with pilot data and new constraints
A few points stand out:
Tools like Circular Canvas, CBMC, Value Chain Canvas, and Partner Map help me see leak points and partner gaps.
Tools like openLCA, SimaPro, GaBi, Brightway2, MCI, Circulytics, CircularTracker, and CELAVI help me test product loops with data.
Methods like AHP, TOPSIS, VIKOR, PROMETHEE-II, MIVES, and PR-MCDT help turn analysis into a board-level choice.
Cradle-to-Cradle Business Model Tools: Map, Measure, Decide, Refine
Cradle to Cradle Certification deep dive
Quick Comparison
Tool group | What I use it for | Best at | Main limit |
|---|---|---|---|
Value chain mapping | Seeing flows, actors, and leak points | Early design and partner planning | Does not prove impact on its own |
Lifecycle and circularity data | Testing product loops and recovery paths | Comparing scenarios with numbers | Data needs can be high |
Decision support | Ranking options across cost, carbon, and feasibility | Turning analysis into a clear choice | Output depends on criteria and weights |
If I had to boil the full article down to one line, it would be this: cradle-to-cradle planning works best when I connect flow maps, measurement, and decision methods into one repeatable loop.
Value chain mapping tools for cradle-to-cradle business model design
Value chain mapping tools show how materials move through design, sourcing, manufacturing, use, repair, collection, and recovery. That sounds simple, but it changes the conversation fast. Instead of talking about circularity in broad terms, teams can see where handoffs happen, where materials leak out of the system, and where reuse, repair, remanufacturing, or recycling can happen in practice. They also make stakeholder roles plain, expose reverse logistics gaps, and set up the questions that later lifecycle and financial models need to test.
The main tools approach that map in different ways.
Circular Canvas and Circular Business Model Canvas
The Circular Canvas maps material, energy, and information flows across the lifecycle on a single page, with attention on losses and recovery points. Teams can mark current loops and sketch new ones, including take-back, maintenance, refurbishment, and remanufacturing.[2][3][5]
If the Circular Canvas lays out the flows, the CBMC turns those flows into business-model choices.
The Circular Business Model Canvas keeps the nine blocks and adds prompts around reuse, recovery, and impact. It ties material loops to revenue, reverse logistics, and recovery channels, so teams can see what changes when a company moves from selling units to offering outcomes. That shift can change partner roles, service needs, and end-of-life collection. A useful way to work is to build the current and proposed canvases side by side, then use the gaps to spot the partners, infrastructure, and design shifts the new model will need.[4][7]
Value Chain Canvas, Partner Map, and value mapping frameworks
The Value Chain Canvas breaks the system into stages such as design, sourcing, manufacturing, distribution, use, repair/maintenance, collection, and next use. At each stage, it records key activities, stakeholders, inputs, outputs, and waste. This is often where the weak points become hard to ignore: a repair system that depends on spare parts no one stocks, components thrown away at end-of-life even though they still hold remanufacturing value, or incentives that push replacement instead of longer product life.[3][6]
The Partner Map adds the people and institutions around that chain. It identifies actors at each stage, including suppliers, logistics providers, certified repair shops, recyclers, municipalities, NGOs, and regulators, then looks at their interests and level of engagement. In plain terms, it shows who is missing. If refurbishers, logistics providers, or recyclers are not in place, take-back may stall unless new partnerships or new infrastructure are built.[5][6]
These tools vary in scope, but they all support the same design job: making the system visible enough to change.
Tool | Primary Purpose | Lifecycle Coverage | Typical Use Case | Data Requirements |
|---|---|---|---|---|
Circular Canvas | Map material, energy, and information flows and identify circular opportunities | Full lifecycle | Redesigning a business model around circular loops | Flow types, stakeholder roles, lifecycle impacts |
Circular Business Model Canvas | Redesign core business elements for circular flows | Full lifecycle | Strategic planning for take-back and service models | Value propositions, revenue streams, key partners, recovery channels |
Value Chain Canvas | Break the value chain into stages and identify waste and missed value | Sourcing through next use | Operational mapping of circular stages and dependencies | Process inputs, outputs, waste volumes, partner roles |
Partner Map | Identify and assess stakeholder roles and engagement | Collaboration and recovery stages | Building reverse logistics networks and regional partnerships | Partner capabilities, interests, logistics infrastructure |
Collaborative mapping in multi-stakeholder settings
Circular systems rarely stay inside one company's walls. Regional material recovery, shared reverse logistics, and coordinated take-back programs depend on governments, nonprofits, foundations, and private firms agreeing on roles. Multi-stakeholder mapping helps these groups see who must act together before any circular model can grow. That matters, because it gives them a shared picture to work from instead of asking them to negotiate in the abstract.[3][8][1]
Academic work on the Circular Business Ecosystem Model Canvas (CBEMC) shows that circular value chains often need multiple connected business models across a network of actors. Mapping those models in sequence helps teams spot where shared value propositions and coordination mechanisms are absent.[1] Templates hosted on collaborative whiteboard platforms like Miro can also make these sessions workable across organizations and geographies, especially when teams are remote.
Once the map is clear, teams can quantify impact and recovery with lifecycle data.
Lifecycle data and circularity assessment tools
Once value chain mapping is done, the next step is measuring performance. Lifecycle data and circularity assessment tools usually fall into three buckets: LCA platforms for environmental impact, circularity indicators for circular performance, and hybrid tools for transition scenarios. The goal is bigger than measurement for its own sake. Teams use these tools to choose loops, contracts, and recovery channels that can actually run in day-to-day operations. In that sense, the metrics turn a circular map into evidence for business model decisions.
LCA platforms for modeling environmental impact
openLCA, SimaPro, GaBi, and Brightway2 are the main platforms for full lifecycle environmental modeling. They follow ISO 14040/14044 standards and measure climate, water, resource, and toxicity impacts across the full life cycle.[10][13][14][17]
For cradle-to-cradle work, scenario comparison is where these tools earn their keep. A team can model recycled-content, take-back, remanufacturing, and disposal paths by changing reuse cycles, recycling rates, energy source, and transport mode.[10][12][16] That makes it much easier to compare, say, a repair loop against a one-way disposal path instead of relying on gut instinct.
These platforms depend on background databases such as ecoinvent for life cycle inventory data. Many ecoinvent datasets use European or global averages, so North American-specific datasets are a better fit when they are available.[10][13][16] Cost matters too. ecoinvent licenses run about CHF 1,650 per year, and commercial suites can climb into the five figures for a single professional license.[16][19]
One caution here: different platforms can produce different results even when the inputs are the same. That is why teams should validate outputs before using them for investment cases or public reporting.[10]
Circularity indicators for products and organizations
Circularity indicators measure how circular a product or organization is, not its full environmental impact. Most use a 0-to-1 scale or a percentage, based on inputs such as recycled content share, recovery rate, number of use cycles, and design attributes.[9][11][15]
The Material Circularity Indicator (MCI) pulls virgin input, unrecoverable waste, and product utility into one score. It aligns with ISO 59020, which makes it a useful reference point for standardized circularity reporting.[25][26][29]
Circulytics looks at organizations across material flows, business model innovation, water, energy, finance, and assets.[27][28][30] It fits executive benchmarking and disclosure better than product-level analysis.
At the product level, tools such as CCET, CEIP, CET, and CPI use structured questionnaires and design-attribute reviews to rate circularity potential early in the design process.[9][11][15][18] The CCET, for example, can show how well a concept lines up with circular principles before detailed engineering starts. That is handy when a team is weighing a modular, repairable product against a sealed unit built for replacement. In practice, these tools work well for screening and design choices, while LCA is the check on whether the option also cuts environmental impact.[9][11][15]
That distinction matters. A circularity score can go up while total impacts also go up, which is why indicators are best for screening and LCA is best for validation.[9][10][11][15]
Hybrid and visualization tools for transition planning
Sometimes teams do not just need a score; they need to test a path forward. That is where hybrid tools come in. These tools add scenario depth by modeling transition pathways across value chains and regional systems.
CELAVI combines simulation, material flow analysis, LCA, and network analysis in one framework.[20][22][24] Its outputs include material and energy flow rates for all modeled circular strategies, input and output circularity percentages, and environmental impacts calculated with the TRACI method. It also produces time-series data, which lets teams track how impacts change as a supply chain shifts from linear to circular.[22][24]
CircularTracker takes ISO-compliant Product Circularity Data Sheets (PCDS) as inputs and turns them into standardized circularity reports on material recovery, product longevity, reuse potential, and end-of-life strategies.[21][23] For business teams that need structured assessments without building custom LCA models, it is a more practical entry point.
The table below shows how these tool categories compare across the dimensions that matter most in cradle-to-cradle work:
Tool | Scope | Key Metrics | Data Intensity |
|---|---|---|---|
openLCA | Full lifecycle, process-level | GHG emissions, energy use, water use, toxicity | High |
SimaPro / GaBi | Full lifecycle, corporate and portfolio analysis | GHG, resource depletion, acidification, eutrophication | High |
Brightway2 | Full lifecycle, large-scale or research | Full impact categories; uncertainty analysis | Very high |
MCI | Product-level circularity | Virgin material input, unrecoverable waste, utility factor | Low–Medium |
Circulytics | Organization-level circularity | Material flows, business model, water and energy, finance, assets | Medium |
CCET / CEIP / CET / CPI | Product concept–level | Circularity potential, design attributes | Low |
CircularTracker | Product-level, standardized | Material recovery, product longevity, reuse potential, end-of-life strategy | Low–Medium |
CELAVI | System/regional, time-series | Material flows, circularity percentages, TRACI impacts | High |
Taken together, these metrics help narrow the set of strategy choices that decision-support tools still need to sort out.
Decision-support tools that turn analysis into business model choices
Once mapping and lifecycle analysis lay out the tradeoffs, decision-support tools help teams make a call. Lifecycle data and circularity scores show what each path gives up or gains. The next step is simpler to say than to do: compare cost, carbon, feasibility, and stakeholder priorities in one decision frame.
Multi-criteria decision methods for circular strategy selection
When a leadership team is choosing between repair, reuse, remanufacturing, recycling, or a product-as-a-service model, one metric rarely settles it. Each option looks different depending on how the team weighs capital cost, greenhouse gas reduction, reverse-logistics feasibility, and customer experience. That’s the kind of knot multi-criteria decision-making, or MCDM, methods are built to untie.
AHP (Analytic Hierarchy Process) is often the best place to start. It breaks the decision into a hierarchy: goal, criteria, sub-criteria, and alternatives. Then it uses pairwise comparisons to assign weights. In cross-functional workshops, that structure works well because it forces people to agree on what matters most before anyone starts ranking options. Pairing AHP with lifecycle data helps keep those weights tied to evidence rather than opinion alone. [40][36]
TOPSIS and VIKOR work a bit differently. Both rank options based on how close each one comes to the best-case outcome. VIKOR leans harder into finding the best compromise when criteria pull in opposite directions. If a team already has solid quantitative inputs from LCA or circularity indicators, either method can produce a clear rank order without much hand-waving. PROMETHEE-II fits better when some options must clear minimum recyclability levels or meet regulatory thresholds, since its outranking logic can account for those cutoffs. [36][41][40]
MIVES (Modelo Integrado de Valor para una Evaluación Sostenible) blends AHP-based weighting with value functions to roll up economic, environmental, and social indicators into one sustainability index. [31][32][33][37]
The main point is easy to miss: criteria selection is a governance choice, not just an analysis step. The criteria you include, and the weight you give each one, shape which circular strategy rises to the top. That’s why executives need to be involved when the criteria framework is set, not only when the final ranking lands on a slide.
Use the table below to match each method to the decision it supports.
Tool or Method | Primary Application | Criteria Domains | Integration with Lifecycle Data | Typical Decision Context |
|---|---|---|---|---|
AHP | Criteria weighting and strategy structuring | Financial, environmental, technical, social | Moderate - weights lifecycle inputs but requires manual integration | Circular strategy workshops; early-stage option screening |
TOPSIS | Ranking alternatives against an ideal solution | Financial, environmental, technical, social | High - accepts quantitative LCA and circularity outputs directly | Comparing repair vs. remanufacturing vs. recycling with clear data |
VIKOR | Compromise solution under conflicting objectives | Financial, environmental, operational | High - uses quantitative criteria; handles trade-off minimization | Capital allocation when no option dominates across all criteria |
PROMETHEE-II | Outranking with preference thresholds | Financial, environmental, social, regulatory | Moderate - integrates lifecycle data and qualitative preferences | Strategy selection where regulatory floors or minimum standards apply |
MIVES | Sustainability index across economic, environmental, and social pillars | Economic, environmental, social | High - designed to integrate lifecycle-based indicators into value functions | Infrastructure, product design, and circular model evaluation |
PR-MCDT | End-of-life and product recovery routing | Technical, economic, environmental, business, societal | Moderate - uses product condition and recovery-yield data | Take-back program design; returned-product routing decisions |
Product recovery and end-of-life decision tools
When the question changes from Which circular model should we back? to What should we do with this returned product?, general MCDM methods are less suited to the job. PR-MCDT (Product Recovery Multi-Criteria Decision Tool) was built for that routing decision. [34][35][38][39]
PR-MCDT scores reuse, repair, refurbishment, remanufacturing, recycling, and disposal against technical, economic, environmental, legal, and market criteria. [35][38] That matters in the real world because the same returned product can have more than one workable recovery route. Its condition, residual value, and market demand for recovered materials can shift the answer fast.
How consulting teams integrate decision support into implementation
A ranking on its own doesn’t change much. It has to turn into a roadmap, a capital plan, and an operating model.
Council Fire turns lifecycle evidence and stakeholder priorities into criteria, then into phased investment, operating changes, and metrics - so the circular strategy choice becomes a practical pathway with owners, timelines, and performance targets.
Conclusion: How to choose the right tool set for cradle-to-cradle work
Taken together, the tools in this roundup work best as a workflow, not a checklist. No single tool covers the full cradle-to-cradle process. Value chain mapping, lifecycle and circularity data, and decision-support methods each do a different job.
A simple sequence helps keep the work grounded:
Map value chains and partners
Measure lifecycle and circularity performance
Rank options with decision-support methods such as PR-MCDT or fuzzy TOPSIS
Once that sequence is in place, the next step is choosing the right fit.
Match the tool to the decision in front of you. Use workshop-friendly canvases during early design work. Use standardized indicators when you need comparable metrics across products, sites, or reporting periods. The right choice also depends on the data you have, the purpose of the decision, and how many stakeholders are involved at each stage.
The strongest approach brings all three layers together. Mapping sets the scope. Measurement checks the options. Decision tools turn those findings into a choice that has a clear rationale.
It also helps to treat the toolkit as a feedback loop. Pilots produce data, markets shift, and regulations change. Organizations that keep cradle-to-cradle work moving build that loop into day-to-day practice - and repeat it. Progress comes from doing the cycle again: map, measure, decide, refine.
FAQs
Which tool should I start with?
Start with a clear diagnostic base. If you're tracking circularity, Circular Transition Indicators (CTI) help you measure resource efficiency, recycling rates, and material flows.
If the goal is to map material dependencies and waste streams, use Material Flow Analysis (MFA). If you need to look at environmental impacts across a product’s full life, put Life Cycle Assessment (LCA) at the center of your approach. The right tool depends on what you're trying to answer, how complex the product is, the quality of your data, and how much technical skill your team has.
How much data do these tools require?
Data needs change a lot depending on what you’re trying to measure and how complex the product is. Lifecycle assessment tools rely heavily on life cycle inventory data. That usually includes raw materials, energy use, water use, emissions, and waste.
Supplier-specific primary data gives you the closest picture of what’s happening. Still, many tools can fill in missing pieces with secondary industry data, which helps when direct inputs aren’t available. For value chain mapping and circularity tracking, you’ll also need entity details, activity volumes, and sustainability metrics across each supply chain node.
How do I choose between repair, reuse, and recycling?
Follow the value retention hierarchy: pick the path that keeps the most embedded energy, complexity, and value in play.
Put maintenance, repair, and reuse first. Turn to remanufacturing only after those options stop making sense, and use recycling when higher-value routes are no longer practical. Value chain mapping and material flow analysis can help show where products and materials can stay in circulation most effectively.
Related Blog Posts
Latest Articles
©2025
Narrative Change and Power Building: The Missing Half of Advocacy
Narrative change is the process of disrupting dominant narratives that normalize inequity and advancing new narratives from historically marginalized communities.
Funding Resilience Without Federal Grants
BRIC is unreliable and FEMA is shrinking. Here's how cities fund climate resilience with dedicated revenue, blended finance, and a coordinating authority.
The ESG Blind Spot: How AI Is Finding Risks in Companies Nobody Else Is Watching
Norway's sovereign wealth fund uses AI to screen 7,200 portfolio companies for forced labor and corruption within 24 hours. The real story is the emerging-market coverage gap that traditional ESG data vendors miss — and what it means for any company with a global supply chain.
FAQ
What does it really mean to “redefine profit”?
What makes Council Fire different?
Who does Council Fire work with?
What does working with Council Fire actually look like?
How does Council Fire help organizations turn big goals into action?
How does Council Fire define and measure success?