Oct 9, 2026 · 11 min read
Sustainability Strategy
In This Article
Measure circular supply chains by what stays in use—practical KPIs from inputs to outcomes with a 12‑month pilot approach.
Circular Economy Indicators for Supply Chains
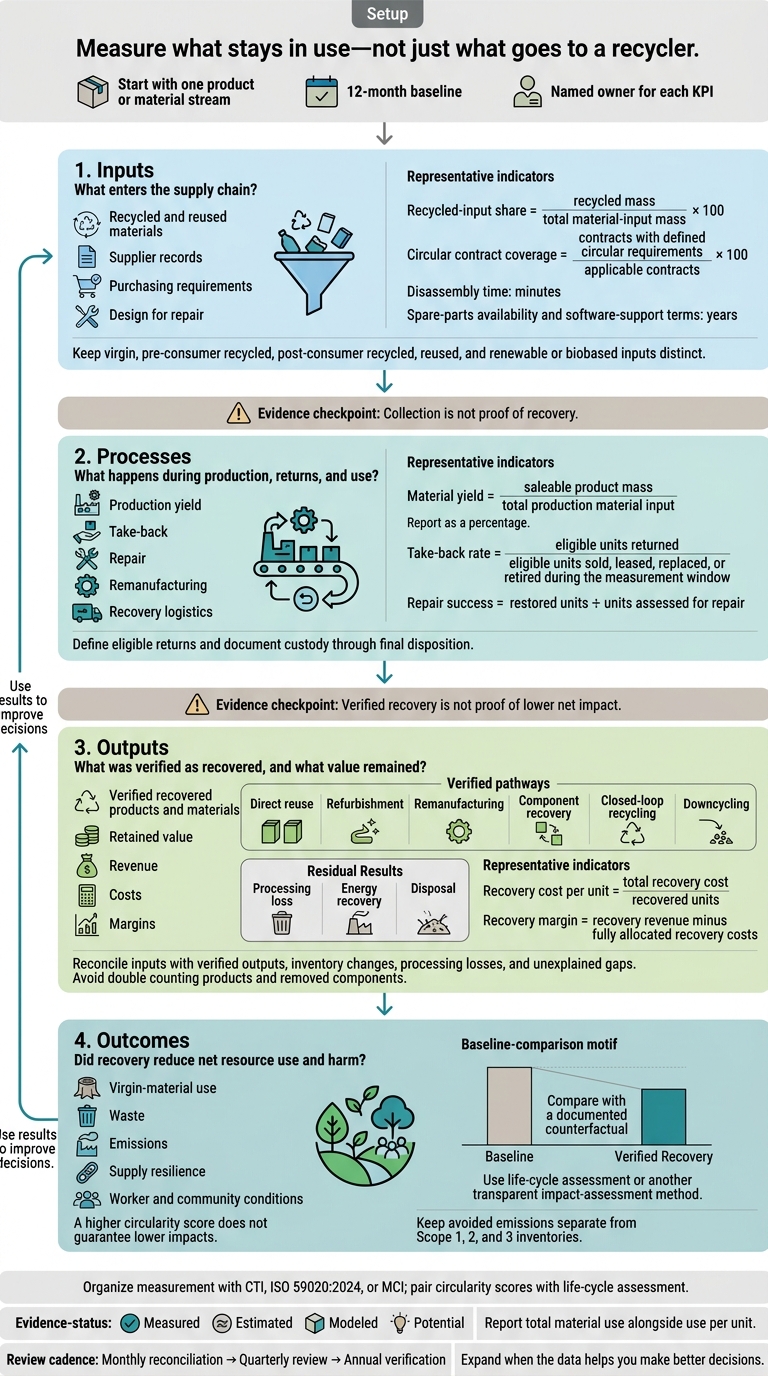
We measure circular supply chains by what stays in use - not just what goes to a recycler. Start with one product or material stream, a 12-month baseline, and a named owner for each KPI.
We track four areas to help you connect activity with results:
Inputs: Recycled and reused materials, supplier records, purchasing requirements, and design for repair.
Processes: Production yield, take-back, repair, remanufacturing, and recovery logistics.
Outputs: Verified recovered products and materials, retained value, revenue, costs, and margins.
Outcomes: Changes in virgin-material use, waste, emissions, supply resilience, and worker and community conditions.
We use CTI, ISO 59020:2024, or MCI to organize measurement, then pair circularity scores with life-cycle assessment. <u>Collection is not proof of recovery</u>, and a higher circularity score does not guarantee lower impacts.
Our approach is simple: label results as measured, estimated, modeled, or potential; report total material use alongside use per unit; and review the dashboard monthly, quarterly, and annually. Expand when the data helps you make better decisions.
Circular Supply Chain KPIs: From Inputs to Outcomes
Input Indicators: Materials, Purchasing, and Design
Measure Recycled and Reused Inputs
Input indicators measure how much circular material enters the supply chain - and how well the records support those figures.
Calculate recycled-input share as recycled mass ÷ total material-input mass × 100. Use the same formula for reused-input share. Report pre-consumer and post-consumer recycled content shares separately, and track secondary-material mass used during the period in metric tons.
For recovered components, divide recovered components installed by all components installed. Stick to one measurement basis: count or mass. Measure virgin-material intensity in kilograms per product or per $1 million of revenue, accounting for price effects.
Give each input one primary category: virgin, pre-consumer recycled, post-consumer recycled, reused, or renewable or biobased. Keep renewable origin and biobased inputs separate from recycled and reused content, and report each material and product family separately.
Link lot records to the supplier, origin, composition, mass, chain-of-custody evidence, and verification status. Flag critical, scarce, hazardous, and hard-to-recover materials. Otherwise, high-volume materials can mask smaller inputs with higher risks.
These input KPIs establish the baseline for purchasing and design decisions.
Track Circular Purchasing and Supplier Data
Procurement turns circular goals into enforceable specifications. A circular purchase must meet a measurable contract requirement, such as recycled content, verified refurbishment, spare-parts availability, repairability, or documented take-back. Marketing language alone doesn't qualify.
Report raw materials, products, and services as separate populations. Calculate circular contract coverage as contracts with defined circular requirements ÷ applicable contracts × 100.
| Indicator basis | Calculation | Use | Distortion |
|---|---|---|---|
| Mass-based | Qualifying purchased mass ÷ total relevant purchased mass × 100 | Tracks physical purchasing choices | Heavy materials dominate; qualifying mass may not be entirely recycled |
| Spend-based | Qualifying purchasing spend ÷ total relevant purchasing spend × 100 | Tracks procurement commitment | Prices and premiums can change results without changing material flows |
| Supplier-based | Suppliers meeting requirements ÷ relevant suppliers × 100 | Tracks supplier compliance | Small and large suppliers count equally |
Keep assessment coverage separate from compliance. Assessment coverage is suppliers assessed ÷ relevant suppliers; compliance is suppliers meeting requirements ÷ suppliers assessed.
Measure data completeness as purchasing mass or spend with usable data ÷ the corresponding total. For verified-data coverage, count only data supported by evidence. Also track products covered by documented take-back arrangements ÷ relevant purchased products.
Distinguish supplier declarations, primary records, third-party verification, and estimates. Missing data is not zero. Feed these procurement rules directly into product design requirements.
Assess Design for Repair, Reuse, and Recovery
Design metrics estimate how easily products can be repaired, reused, or recovered later. Use a documented design scorecard to track expected life in years or service hours under stated conditions, repairability scores using a named method, and disassembly time in minutes.
Measure independently replaceable modules as a share of total modules. Calculate reusable-component share as reusable-component mass ÷ total component mass.
Record spare-parts availability and software-support terms in years. Calculate repair-documentation coverage as supported products ÷ relevant products × 100. Track material families, composites, coatings, and bonded interfaces that make separation difficult.
Measure recovery potential as technically recoverable mass ÷ product mass under specified processing conditions. Pair these design metrics with repair records, recovered-component installs, and verified material recovery as the measurement framework moves into production, logistics, and use-stage KPIs.
sbb-itb-8baf5f1
Building a circular supply chain
Process Indicators: Production, Logistics, and Use
Once input and design metrics are set, track how materials move through production, reverse logistics, and recovery.
Track Production Yield and Internal Material Reuse
Calculate material yield as saleable product mass ÷ total production material input. Calculate scrap rate as non-saleable material generated ÷ total material input. Report both as percentages, along with waste in kilograms per finished unit.
Measure internal reuse as scrap returned to the same or another production line ÷ eligible scrap generated. Track residue reuse separately, distinguish internal recirculation from purchased recycled inputs, and count each batch of scrap only once - not each time it recirculates.
For recovered feedstock, calculate processing loss as unrecoverable mass ÷ recovered-material input. Check whether reuse leads to more defects, higher energy demand, or material degradation. Measure recirculated water as recirculated water ÷ total process-water withdrawals, and report renewable-energy share separately. Efficiency alone does not establish a closed loop: collection, processing, and return to productive use must all be verified.
Measure Take-Back and Recovery Logistics
Define which returns qualify by product, geography, condition, timing, and return window. For example, eligible returns might include leased assets due back at contract expiration. Calculate take-back rate as eligible units returned ÷ eligible units sold, leased, replaced, or retired during the measurement window.
Keep collection coverage - the eligible customers, sites, or units covered - separate from actual returns. Track routing by verified recovery pathway, time from authorization to receipt, the share of units with documented custody, and documented handoffs through final disposition. Measure cost per returned unit, including packaging, collection, transport, inspection, and administration.
| Logistics flow | Objective | Key KPIs | Data sources | Measurement risks |
|---|---|---|---|---|
| Reverse | Collect products, packaging, or materials from customers and return them to an authorized location | Collection coverage; take-back rate; time from authorization to receipt; cost per returned unit; return miles; emissions per return; load utilization | Return authorization systems; carrier records; collection-site logs; customer-service systems; GPS data | Counting promised rather than actual returns; failing to define eligible units; omitting failed pickups or empty backhauls |
| Recovery | Move returned items through inspection, repair, refurbishment, remanufacturing, recycling, or disposal while preserving value | Share of units with documented custody; inspection time; recovery yield; recovery route; retained mass; retained value; emissions per recovered unit; final-disposition rate | Serial-number systems; inspection records; repair and remanufacturing systems; recycler certificates; financial systems | Treating shipment to a recycler as successful recovery; ignoring processing losses; failing to verify final disposition |
Use forward logistics only as a baseline. Focus circular KPIs on reverse and recovery flows so the measures distinguish collection activity from verified recovery.
Track Repair, Remanufacturing, and Product Use
Design metrics show what a product could do; these KPIs show what happens in service. Earlier indicators measure design readiness, while this subsection tracks results after products enter use.
Measure actual repair, refurbishment, and remanufacturing performance:
Repair success: restored units ÷ units assessed for repair.
Refurbishment yield: units meeting redeployment specifications ÷ units sent for refurbishment.
Remanufacturing yield: qualifying remanufactured units ÷ cores received or units processed. Clearly name the denominator used.
Pair these measures with turnaround time, core rejection rate, warranty-return rate, and failures per 1,000 operating hours. Track actual time from commissioning to retirement, observed years added after an intervention, and the share of products upgraded rather than replaced.
For logistics impacts, report total emissions alongside emissions per successfully recovered unit. Estimate transport emissions using actual mass or volume, distance, transport mode, and an appropriate emissions factor.
Output and Outcome Indicators: Recovery, Returns, and Impacts
Process KPIs track activity. Output KPIs show what was recovered and how much value remained.
Measure Actual Recovery and Retained Value
Report verified reuse, refurbishment, remanufacturing, component recovery, recycling output, and residual waste sent to disposal or energy recovery. Label each denominator clearly: products sold, eligible returns, recovered products, or input material mass. Keep recovery potential separate from verified circular outputs.
Assign each unit to its highest verified final pathway. Track removed components separately, and don't count them again in the original product-recovery numerator. Reconcile input material with verified outputs, inventory changes, processing losses, and unexplained gaps.
Report direct reuse, refurbishment, remanufacturing, component recovery, closed-loop recycling, downcycling, processing loss, energy recovery, and disposal as separate results. Measure retained value through revenue per recovered unit, added useful life, or recovered component value. Landfill diversion alone does not establish success.
Measure Financial Results
Define which sales qualify as circular revenue before calculating its share. This may include reused, repaired, refurbished, remanufactured, leased, and product-as-a-service offerings. Apply the same inclusion rules across reporting periods.
Separate results by recovery pathway. Account for collection, transport, inspection, labor, replacement parts, testing, processing, software, compliance, and allocated infrastructure costs. When categories overlap, count revenue from recovered products, components, and materials within circular revenue - not on top of it.
| KPI group | Indicator | Definition | Unit |
|---|---|---|---|
| Revenue | Circular revenue share | Revenue from qualifying circular offerings ÷ total revenue | % |
| Revenue | Revenue from recovered products, components, and materials | Sales of recovered products, components, and materials | $ |
| Cost | Material savings | Baseline virgin-material cost minus actual substitute-material cost, adjusted for quality and quantity | $ |
| Cost | Recovery cost per unit | Total recovery cost ÷ recovered units | $ per unit |
| Margin | Recovery margin | Recovery revenue minus fully allocated recovery costs | $ or % |
| Investment | Circular ROI | Incremental circular operating profit ÷ circular investment | % |
| Investment | Payback period | Circular investment ÷ annual incremental cash benefit | Years |
| Productivity | Revenue per material input | Relevant revenue ÷ metric tons of material input | $ per metric ton |
Financial performance only matters if the circular pathway also improves net impact.
Verify Resource, Climate, and Community Outcomes
The last test is whether recovery reduces net resource use and harm compared with what would otherwise happen - the counterfactual.
Compare each pathway with a documented counterfactual that specifies the displaced product or material, geography, service life, electricity mix, and transport assumptions. Use life-cycle assessment or another transparent impact-assessment method to test net impacts. Account for transport, sorting, energy, processing, replacement rates, and offsetting demand growth.
Report virgin-material avoidance, waste prevention, water savings, and greenhouse-gas results against that baseline. Keep avoided emissions separate from emissions inventories. Do not subtract them from Scope 1, 2, or 3 totals.
Test supply resilience by measuring the share of material demand met with recovered material; the quantity of critical material recovered and returned to production; the number and geographic concentration of virgin suppliers; recovered inventory in months of demand; procurement-price volatility; and lead-time changes. Count only material that meets required specifications and is available when needed.
Pair these results with worker injury and illness rates, hazardous-exposure data, contractor safety performance, access to collection points, recovery jobs, and local value retained. Where relevant, assess land disturbance and biodiversity impacts. Recovery is not a positive outcome if it shifts harm to workers, communities, or sensitive habitats.
Build and Use a Circular Supply Chain KPI System
Pilot a KPI Dashboard and Assign Owners
Once you’ve defined the indicators, put them into a dashboard with clear oversight for one pilot stream. Choose a priority product line, material stream, facility, or market. Define its boundary and use the latest complete 12-month period as your baseline. Connect procurement, production, returns, and waste records using shared product IDs, quantities, and metric tons.[3][1] Use a shorter baseline only if a full 12 months of data aren’t available.
Reconcile inflows, outflows, and inventory each month, allowing for measurement variance. Investigate unexplained differences - don’t force the numbers to balance.
Pair headline KPIs with supporting controls. For each KPI, show its formula, scope, baseline, target, reporting period, owner, evidence source, and data-quality rating. Set both absolute and intensity milestones so efficiency gains don’t mask an increase in total consumption. Label every result as measured, estimated, modeled, or potential.
Make the dashboard part of a required schedule: monthly reconciliation, quarterly review, and annual verification.
| Governance responsibility | Owner | Review and control |
|---|---|---|
| Executive accountability | Senior executive | Approve scope, targets, resources, and corrective actions quarterly |
| KPI definitions and methodology | Sustainability or circularity program manager | Maintain the KPI dictionary, assumptions, and version history; review boundaries annually |
| Procurement and supplier data | Procurement data owner | Verify supplier declarations, recycled-content evidence, and coverage |
| Production and inventory data | Operations or plant manager | Reconcile material inputs, yield, scrap, and inventory changes monthly |
| Returns and recovery data | Reverse-logistics or service leader | Track collection, triage, repair, remanufacturing, recycling, and disposal |
| Financial outcomes | Finance controller | Validate avoided costs, revenue, margin, capital spending, and savings claims quarterly |
| Independent verification | Internal audit, assurance provider, or qualified reviewer | Test samples, calculations, evidence, and control effectiveness at least annually |
| Corrections and disputes | KPI steering committee | Log errors, approve restatements, and record causes, affected periods, and approvals |
Work With Council Fire on Implementation
Council Fire can help put the system into practice, from setting boundaries and mapping flows to KPI governance, stakeholder engagement, and resilience alignment.
Conclusion: Measure Circular Flows and Check Results
Choose one pilot stream, assign owners, and establish the baseline. Measure flows, verify results, and review progress. Expand only after the dashboard changes decisions.
FAQs
Which circular KPIs should I prioritize first?
Start with waste diversion rates, resource efficiency, material reuse, and waste reduction. Choose metrics that match your strategy and circular principles. They give you a baseline to track progress and see where you can improve.
As your approach matures, add the Material Circularity Indicator (MCI) or Circular Transition Indicators (CTI) to measure material flows and recovery cycles more precisely. Council Fire helps organizations put these KPI frameworks into practice.
How can I track circularity with limited supplier data?
Begin with qualitative assessments and internal audits. Use procurement and production records to map material inputs, outputs, and waste streams. Supplier questionnaires can help you learn about circular practices, while circularity criteria in supplier scorecards make those practices part of supplier reviews.
Track a few high-impact metrics, such as waste diversion rates or recycled content percentages, rather than building extensive dashboards. Over time, work with suppliers to improve transparency and support more detailed tracking.
What if circularity improves but emissions rise?
Circularity can improve even as greenhouse gas emissions increase. Circularity indicators measure reuse, repair, and recycling - not the full environmental impact [2][1].
A reuse program, for example, may divert more material from disposal while adding emissions from transportation or energy use during processing [2].
Use circularity metrics as a screening tool, then pair them with life cycle assessments (LCA) to check whether circular strategies deliver the intended environmental and climate benefits [2][1].


FAQ