
Sep 12, 2026
Catastrophe Modeling And Risk: Guide 2026
Governance
In This Article
Practical guide to catastrophe models: metrics (AAL/PML/EP), data needs, platform choices, and governance for 2026 risk decisions.
Catastrophe Modeling And Risk: Guide 2026
Catastrophe models help me estimate how often disasters may hit, how bad they may get, and what they may cost - before I commit capital, buy insurance, or plan resilience work. In 2023 and 2024 alone, NOAA logged 28 and 27 billion-dollar U.S. disasters, which is why old history-only methods are no longer enough.
If I had to boil this guide down, it comes to four points:
A catastrophe model links hazard, exposure, vulnerability, and financial terms
The core outputs areAAL, PML, and EP curves
Good results depend on clean location, building, value, and hazard data
Model governance matters because outputs are estimates, not exact answers
Here’s the plain-English version:
AAL tells me the long-run average yearly loss
PML tells me the tail loss, such as a 1% annual chance event
OEP looks at one large event in a year
AEP looks at all events combined in a year
Climate-conditioned views test how losses may change as heat, rainfall, wildfire, sea level, and storm behavior shift
I also need to pick the right tool for the job:
Commercial platforms fit insurance, reinsurance, and capital work
Specialty models add local flood or wildfire detail
Open-source tools give more visibility into assumptions and code
In-house models fit firms with custom data and strong model control
And I cannot stop at model output. To use results well, I need:
a model inventory
version tracking
back-testing against past events
sensitivity testing
rules for overrides and approvals
A simple way to think about it: the model gives me a range, not a promise. I use that range to price risk, shape reinsurance, test capital, harden assets, and guide public or private investment.
Topic | What I need to know |
|---|---|
Model structure | Event, hazard, vulnerability, financial terms |
Main metrics | AAL, PML, OEP, AEP |
Main data | |
Tool choices | Commercial, specialty, open-source, in-house |
Decision use | Underwriting, reinsurance, capital, lending, resilience planning |
Control needs | Validation, documentation, review cycle, audit trail |
Bottom line: if I want cat modeling to help me make better decisions in 2026, I need fit-for-purpose data, the right platform, and clear governance - not just a model run.
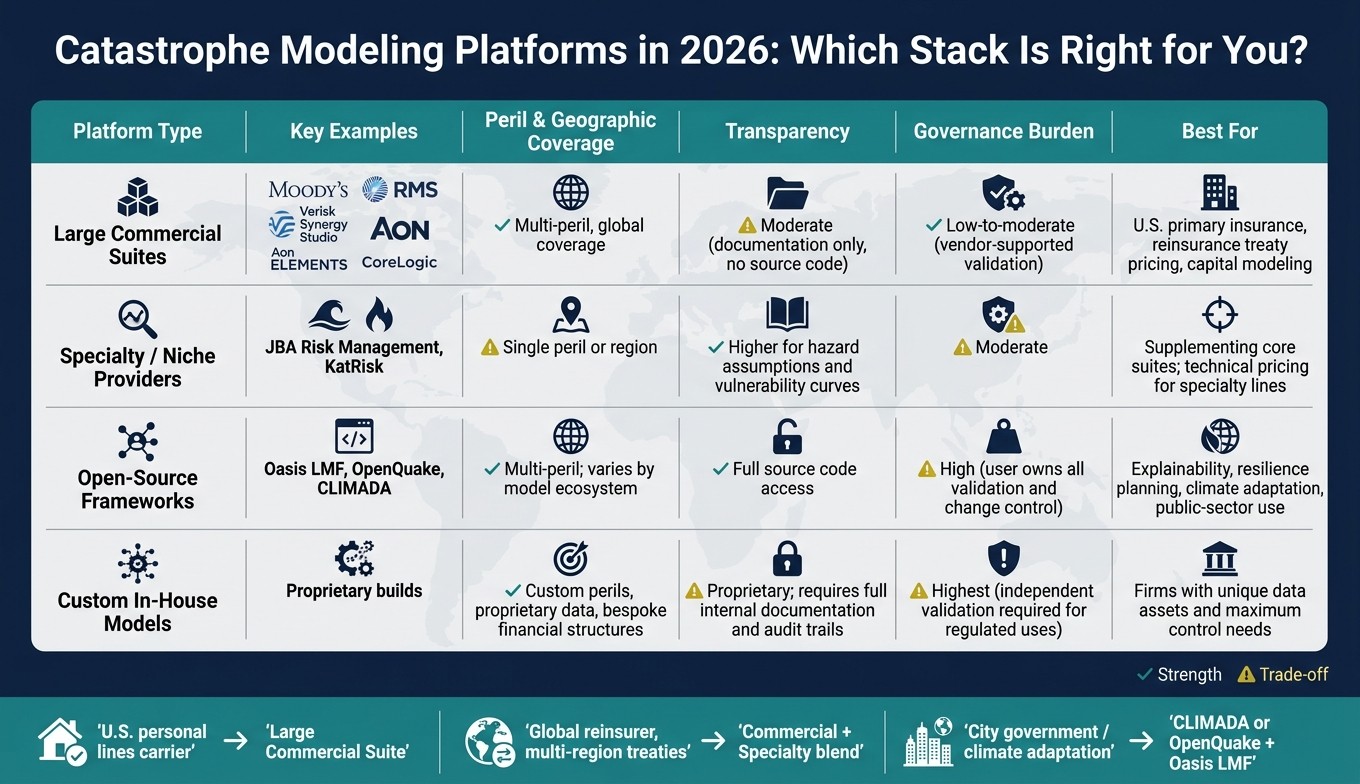
Catastrophe Model Platforms Compared: Commercial vs. Open-Source vs. In-House (2026)
Evaluating Catastrophe Models in Insurance | What Works and What’s Changing
1. Catastrophe Model Basics and Core Risk Metrics
Catastrophe models convert simulated events into loss estimates by linking hazard, exposure, vulnerability, and financial terms. At the core, the logic is simple: model the event, map the physical force, estimate the damage, then apply insurance terms. That process runs through four modules: event, hazard, vulnerability, and financial.
The Four-Part Model Structure
The event module builds a synthetic catalog of peril-specific events such as hurricanes, earthquakes, severe convective storms, and wildfires. Each event gets a location, an intensity, and an annual occurrence rate. These catalogs often cover tens of thousands of simulated years so teams can study rare events that do not appear often in recorded history.
The hazard module takes each simulated event and maps its physical intensity across a geographic area. That might mean wind speed in mph, flood depth in feet, or peak ground acceleration in g. From there, the vulnerability module applies damage functions that connect hazard intensity to expected damage ratios for each building type. The same wind speed or flood depth can produce very different damage outcomes depending on construction type and code era.
Exposure data sits underneath all of this. If the geocoding is off, or if a structure is placed in the wrong construction class, the error moves through every module and skews every metric that comes after it. The financial module then applies policy terms like limits, deductibles, attachment points, and reinsurance structures to turn physical damage into insured loss at the policy, portfolio, and treaty level.
Probabilistic, Deterministic, and Climate-Conditioned Views
Probabilistic models run the full stochastic event catalog against a portfolio and produce a complete loss distribution. This is the standard view for pricing, capital allocation, and solvency work because it reflects the full spread of possible losses, not just a single scenario.
Deterministic scenarios focus on one event at a time. That could mean a repeat of Hurricane Ian making landfall near Fort Myers, FL, a Category 4 storm hitting Miami, or a 1-in-100-year flood in the Ohio River Basin. These scenarios answer a direct what-if question. They also work well for stress testing and board-level risk discussions because they are easier to grasp than a full probability curve.
The same setup can also be adjusted for projected climate change. Climate-conditioned views modify hazard assumptions for plausible future climate states. In 2026, many teams run these views alongside standard probabilistic models to test long-horizon exposure. The point is to see how sensitive today’s risk profile is to plausible future climate states, especially for assets with multi-decade timeframes like coastal infrastructure or long-duration property portfolios. [1][2][3]
AAL, PML, and Exceedance Probability Curves
Three metrics show up in almost every catastrophe model report, and mixing them up can lead to bad calls.
Annualized Average Loss (AAL) is the long-run mean annual loss across the full simulation. It is calculated by weighting each event’s loss by its annual probability and summing across the catalog. Insurers use AAL for technical pricing loads and for expected loss budgeting. It does not tell you what any single year will look like. It tells you what the average looks like over a very long period.
Probable Maximum Loss (PML) is a high-percentile tail estimate, usually the 1-in-100-year or 1-in-250-year loss. This is the main metric used for reinsurance program design, capital adequacy discussions, and rating agency review. A 1-in-100-year PML means there is a 1% annual chance of losses at or above that level.
Exceedance probability (EP) curves give the fuller picture. The occurrence EP, or OEP, curve shows the chance that any single event in a year exceeds a given loss amount. That makes it especially useful for occurrence-based reinsurance covers. The aggregate EP, or AEP, curve shows the chance that total annual losses from all events combined exceed a threshold. That matters for aggregate covers and for a portfolio-level view of risk.
Metric | What It Measures | Primary Use |
|---|---|---|
AAL | Long-run mean annual loss | Technical pricing loads, budgeting |
PML (1-in-100 or 1-in-250) | High-percentile tail loss | Reinsurance structuring, capital adequacy, rating agencies |
OEP curve | Probability a single event exceeds a loss level | Occurrence reinsurance layer design |
AEP curve | Probability total annual losses exceed a level | Aggregate cover design, portfolio risk management |
One practical caution matters here: tail metrics are estimates with uncertainty, not exact forecasts. After Hurricane Katrina, post-event analysis exposed major blind spots in storm surge and flood modeling. That is why disciplined catastrophe risk programs usually hold a buffer beyond modeled PMLs rather than treating the number as a hard line. [5]
These outputs depend on the quality of the hazard, exposure, and climate data behind them.
2. Climate, Hazard, Exposure, and Loss Data Inputs
Model output is only as good as the data behind it. If the inputs are weak, the result will be shaky too. In insurance, reinsurance, and finance, that matters fast. Data choice is the first check on model confidence. In practice, catastrophe models rely on hazard and event records, exposure data, vulnerability and loss data, plus climate and background datasets.
U.S. Hazard and Event Datasets
Pick the source that fits the peril, geography, and decision you need to make.
NOAA's Storm Events Database covers more than 49 event types, with records from January 1950 through May 2026. Teams often use it for frequency-severity work on atmospheric perils. One catch: recent records may not be complete because reporting usually trails by about 75 to 120 days. [14][15][16]
NOAA's Billion-Dollar Weather and Climate Disasters dataset tracks CPI-adjusted direct losses for events above $1 billion, with state-level cost data from 1980–2024. Reinsurers and portfolio managers use it to frame tail-loss behavior and test portfolios against past extremes. [13][17][19]
For earthquake risk, the USGS National Seismic Hazard Model (NSHM) 2023 update covers all 50 states and U.S. territories. It provides probabilistic ground-shaking levels used in building codes, insurance rating, and seismic risk estimates. [20]
FEMA's National Flood Hazard Layer (NFHL) and Risk MAP flood mapping guidance define Special Flood Hazard Areas and flood zones at the parcel and neighborhood level. That makes them central for flood zone decisions, NFIP alignment, and compliance work. The USGS 3D Elevation Program, at about 10-meter resolution, supports storm surge and riverine flood modeling by mapping terrain and coastal form. [18][24][25]
For wildfire, NASA FIRMS offers near-real-time active-fire and burned-area signals that support wildfire monitoring and spread analysis.
Climate Projections and Global Reference Datasets
Historical records on their own no longer tell the whole story. Climate-conditioned models add forward-looking hazard assumptions, extending historical calibration into underwriting, capital planning, and reinsurance stress testing.
CMIP6 supplies multi-model climate projections across multiple emissions scenarios. NASA NEX-GDDP-CMIP6 downscales those projections into daily, local-scale outputs, which makes them easier to use for regional hazard adjustments and portfolio stress tests. [11] ERA5 reconstructs historical weather at about 17 miles spatial resolution with hourly to sub-daily time steps, and it performs well for hydrological modeling across much of North America. [6][8] CHIRPS adds precipitation-focused data at about 5 km resolution with daily to five-day estimates. [9][10] EM-DAT records fatalities, affected people, and economic losses by event and country, which helps with macro-level benchmarking where insurer claims data are thin. NGFS climate scenarios and IPCC assessment findings give financial institutions the structured climate pathways used to align hazard adjustments with standard stress tests. [7][12]
These datasets do not estimate insured loss directly. They change hazard frequency and intensity assumptions before the catastrophe model turns damage into loss. In plain terms, they push historical calibration into forward-looking stress tests.
Data Quality, Resolution, and Fit-for-Purpose Selection
Poor exposure data can drown out good hazard data. At the property level, geocoding accuracy is one of the biggest sources of model uncertainty. ZIP-code centroid geocoding can place a property as much as 10 miles off in rural areas. In coastal counties, the gap between parcel-centroid and rooftop-level geocoding can move modeled hurricane losses by 5%–12%, largely because wind and surge risk change fast with distance to the coast. [21][27]
Location is only part of the picture. Occupancy and construction data decide which vulnerability curve gets applied. A wood-frame home and a reinforced concrete commercial building will not take the same damage at the same wind speed or ground shaking level. If construction type is misclassified, or filled in with a generic assumption, losses can be pushed too low or too high, especially for earthquake and wind perils. Replacement values also need to reflect current construction costs, not old appraisals. Claims history remains the best check on modeled vulnerability. [4][21][22][23]
The table below gives a side-by-side view of key data sources by peril focus, geography, resolution, time coverage, and best use case.
Data Source | Peril Focus | Geography | Resolution | Time Coverage | Best Use Case |
|---|---|---|---|---|---|
NOAA Storm Events | Severe convective storms, hurricanes, winter storms, floods | United States | County/zone; event-level timing | 1950–present (through May 2026) | Frequency-severity analysis, claims validation |
NOAA Billion-Dollar Disasters | Multi-peril large events | United States | National/regional; annual stats | 1980–2024 | Tail-loss context, portfolio stress testing |
USGS NSHM | Earthquakes | All 50 states + territories | Fine spatial; long-term probabilistic | Long-term averages | Seismic hazard layers, PML estimation |
FEMA NFHL / Risk MAP | Flood | United States | Parcel/neighborhood; relatively static | Varies by map vintage | Flood zone determination, NFIP compliance |
NASA FIRMS | Wildfire | Global, including U.S. | Near-real-time; fine spatial | Recent years, ongoing | Wildfire ignition monitoring, hazard characterization |
ERA5 Reanalysis | Multi-hazard atmospheric | Global | About 17 miles; hourly to sub-daily | 1979–near present | Historical storm reconstruction, hazard validation |
CHIRPS | Precipitation / drought | Quasi-global (50°S–50°N) | 0.05° (~5 km); daily to five-day | 1981–near present | Extreme rainfall statistics, drought monitoring |
CMIP6 / NEX-GDDP-CMIP6 | Multi-hazard climate trends | Global | Coarse (CMIP6); downscaled daily (NEX) | Projections through 2100 | Climate-conditioned hazard adjustments, scenario stress testing |
EM-DAT | Multi-peril disaster impacts | Global | Country-level; event records | 1900–present | Macro loss benchmarking, NGFS stress test calibration |
Resolution should match the decision. Coarse climate projections fit long-horizon capital planning. High-precision geocoding and parcel-level flood maps are better for underwriting and property-level work. The next step is choosing a modeling platform that can take in these inputs at the right scale.
3. Modeling Platforms in 2026: Commercial, Specialty, Open-Source, and In-House
Once inputs are set, the platform starts to shape almost everything that follows: how fast models run, how much you can inspect, and how cleanly outputs move into business use. In 2026, platform choice comes down to peril mix, geography, transparency needs, and how easily results feed underwriting, capital, and resilience decisions.
Major Commercial and Specialty Model Providers
Moody's RMS, Verisk Extreme Event Solutions, and Aon Impact Forecasting lead the commercial catastrophe modeling market in 2026.[36][38] Each provides broad multi-peril coverage across U.S. hurricane, earthquake, flood, severe convective storm, and wildfire, with tight links to underwriting, pricing, and portfolio management workflows.
The big move right now is toward cloud-delivered platforms. Moody's RMS Intelligent Risk Platform reportedly hosts 700+ risk models, including 300+ from Nasdaq Risk Modelling for Catastrophes.[36] Verisk is expanding Synergy Studio to bring cat models and analytics together in one cloud environment.[41] Aon's ELEMENTS platform includes 180+ models across 95+ territories, with API, on-premise, and cloud delivery options.[37] That cloud setup makes large-portfolio runs easier and helps teams push results straight into underwriting and portfolio systems.
Specialty vendors step in where broad commercial suites can lose local detail. JBA Risk Management offers probabilistic global flood models with 5 m flood mapping in key markets, which lines up with the parcel-level and asset-level exposure data discussed in the previous section.[36] KatRisk concentrates on high-resolution U.S. flood and wildfire at similar detail. Many specialty models also run through shared Oasis-based platforms such as Nasdaq Risk Modelling for Catastrophes.[37][28][29]
Breadth matters, but platform choice also affects validation, workflow, and governance.
Provider Category | Key Examples | Peril Coverage | Deployment Style | Transparency | Typical Enterprise Use |
|---|---|---|---|---|---|
Large commercial suites | Moody's RMS, Verisk, Aon Impact Forecasting, CoreLogic | Multi-peril, global | Cloud SaaS + API; optional on-prem | Moderate (documentation, validation notes; no source code) | U.S. primary insurance, reinsurance treaty pricing, capital modeling |
Specialty / niche providers | JBA Risk Management, KatRisk | Single peril or region (flood, wildfire) | Cloud-first, API, Oasis-compatible | Higher for hazard assumptions and vulnerability curves | Supplement core suite; technical pricing for specialty lines |
Multi-vendor platforms | Nasdaq Risk Modelling for Catastrophes | Multi-peril via vendor ecosystem | Hosted service (Oasis-powered) | Varies by model; standardized data formats | Multiple views of risk, reinsurance analytics |
Open-Source Frameworks and Internal Model Development
Open-source frameworks now support production modeling and validation. Oasis LMF provides a web interface, APIs, and the ktools calculation engine for Monte Carlo loss modeling.[28][29] Its ecosystem now includes about 90+ models from roughly 18–19 providers, covering perils from wind and flood to earthquake and wildfire.[28][33] Open code helps with explainability, but it also puts more validation work on the user. European supervisors, including EIOPA, have pointed to Oasis as a framework that supports model governance and validation transparency.[33]
OpenQuake handles seismic hazard and risk with fully transparent code, which makes it a strong fit for earthquake-focused studies and building code support.[30][31] CLIMADA is a Python-based framework for multi-hazard climate risk assessment, adaptation option appraisal, and socio-economic impact assessment. It fits resilience planning, climate adaptation studies, and infrastructure investment decisions where the question is not only how much loss? but also what changes if we invest in mitigation?[32][34][35]
Custom in-house models provide the most freedom for proprietary data and bespoke financial structures, but they also bring the heaviest governance load. Internal models need full documentation, version control, and audit trails, and independent validation is required for regulated uses.
Framework | Primary Focus | Cost | Flexibility | Technical Effort | Transparency | Governance Implications |
|---|---|---|---|---|---|---|
Oasis LMF | Multi-peril loss modeling platform | Low (open-source licensing) | High; modular hazard, vulnerability, financial terms | Moderate to high; requires engineering and modeling staff | Full source code access | User owns validation; needs internal change control and oversight |
OpenQuake | Seismic hazard and risk | Low (open-source) | High for earthquake perils | Moderate; well-documented reference implementations | Full source code access | Suitable for regulated and public-interest use with proper documentation |
CLIMADA | Multi-hazard climate risk and adaptation | Low (open-source) | High; supports custom perils and climate scenarios | High; Python-based, requires data science capacity | Full source code and peer-reviewed publications | Strong for public-interest and resilience work; user responsible for validation |
Custom in-house model | Custom perils, proprietary data, bespoke financial structures | High (staff, infrastructure, maintenance) | Maximum | Very high; sustained investment across data science, actuarial, and engineering | Proprietary; requires full internal documentation and audit trails | Heaviest governance burden; independent validation required for regulated uses |
How to Choose the Right Modeling Stack
Start with peril and geography. Then look at regulatory acceptance, explainability, and operational fit. A U.S. personal lines carrier needs a stack that matches its main perils and the level of detail its book demands. A global reinsurer managing treaty portfolios across many regions usually needs breadth first, then more detail for selected books. A city government planning climate adaptation investments often cares more about transparent assumptions and reproducible outputs than regulatory acceptance, which points toward CLIMADA or OpenQuake paired with Oasis for loss modeling.[40][42]
Regulatory and rating agency recognition also matters for insurers. Commercial suites with market acceptance can make U.S. filings easier. Open-source or internal models can still meet regulatory standards, but they need stronger validation evidence and tighter documentation to make that case.
Explainability deserves a close look too. As boards, regulators, and counterparties push for clearer answers on how a loss estimate was produced, the ability to show the steps becomes a governance edge. Open-source frameworks offer full code access. Commercial platforms provide standardized documentation and third-party validation.
It also pays to check API compatibility, portfolio runtime, and links to underwriting and capital systems. Platforms such as Moody's RMS Location Intelligence APIs and Aon's ELEMENTS with Oasis integration are built to cut friction between model output and business decisions.[37][39]
Model selection only gets you part of the way. Governance is what determines how results are reviewed, approved, and used. The next section looks at how governance keeps model use defensible, auditable, and ready for decisions.
4. Governance, Model Risk Management, and Decision Use Cases
Choosing the right platform matters. Governance is what makes model output defensible when a regulator, rating agency, or board asks a simple question: How did you get this loss estimate? Without that structure, even a strong model gets hard to defend. And because model choice affects auditability, governance has to spell out how results are approved, challenged, and reused.
A Practical Governance Framework for Catastrophe Models
A working governance framework starts with a model inventory. Think of it as a central register for every model in use. It should track the vendor or internal owner, version, perils and regions covered, approved uses, key assumptions, known limits, and the next review date.
That inventory needs a written use policy beside it. The policy should define where model output can and cannot drive decisions. Which model is the approved source for U.S. hurricane pricing? What happens when two models disagree? What data quality threshold has to be met before a run is accepted? Those rules need to be clear before people start leaning on the numbers.
Validation can't stop at vendor documentation. Firms need their own back-testing against past events. That means running the portfolio through event sets that approximate Hurricane Harvey, the Camp Fire, or Hurricane Ida, then comparing modeled losses with observed claims by line of business and geography. Sensitivity analysis should also test key assumptions in a structured way, including vulnerability curves, demand surge, and climate conditioning, and show how tail metrics at the high end respond. Those results should go to risk committees, not stay buried in modeling teams.
Aleatory uncertainty is event randomness; epistemic uncertainty is uncertainty in the model itself. Board reporting should separate the central estimate from the uncertainty range and state which exposure segments drive that range. [26][43]
Version control and assumption logging complete the audit trail. Every modeled result used for pricing, capital, or regulatory reporting should link back to a specific model version, exposure snapshot, and run configuration. Independent review, whether internal or external, should test conceptual soundness, data quality, and implementation integrity.
Governance is moving away from point-in-time validation and toward a full model lifecycle view. That includes design, assumptions, use, monitoring, override, escalation, and change management. Regulators are putting more weight on internal governance than on vendor validation alone, so the documentation load is not a one-off task. It sticks around.
Those controls shape whether model output is trusted in underwriting, capital, and resilience decisions.
Insurance, Reinsurance, and Finance Applications
Catastrophe models affect almost every major financial decision in the U.S. insurance and reinsurance market.
In underwriting, they estimate expected and tail losses for specific locations. That feeds risk selection, pricing, and terms across homeowners, commercial property, and specialty infrastructure lines. In accumulation management, insurers track exposure concentrations by peril, region, and ZIP code so they can set risk appetite limits and avoid dangerous buildup in coastal wind or flood zones. A U.S. insurer may use one commercial hurricane model for underwriting and accumulation management, then use a second high-resolution coastal flood model to stress-test tail risk before setting up reinsurance treaties.
In treaty structuring, reinsurers and cedents test excess-of-loss layers, attachment points, and limits against simulated event sets. Capital allocation uses modeled loss distributions to estimate required risk capital under RBC frameworks and rating-agency models. NAIC materials confirm that modeled catastrophe losses for earthquake, hurricane, wildfire, and severe convective storm feed straight into catastrophe risk charges through RBC factors and reinsurance recoverables. [4][44] A U.S. GAO report noted that insurers often limit writings in high-risk areas or buy reinsurance when modeled losses go above 10% to 20% of capital. [45]
Lenders use modeled loss metrics to screen real estate and infrastructure loans. Infrastructure investors use them to test long-term asset performance. Climate-conditioned analysis can shift those numbers in a material way. A World Bank example showed U.S. hurricane insured AAL rising from $11.4 billion to $14.6 billion under a climate-conditioned case, about a 30% jump, while the 1-in-100 year loss moved from $100 billion to $113 billion. [49]
Municipal and public-agency resilience planning also leans on regional hazard and loss modeling to spot vulnerable communities and infrastructure corridors. That work informs zoning, land-use choices, building codes, and public investment priorities. FEMA HAZUS, a free GIS-based tool, estimates economic and social impacts from hurricane wind, flood, and earthquake scenarios for local and state resilience planning. [46][48] NOAA's Climate Mapping for Resilience and Adaptation (CMRA) supports climate-informed infrastructure investment with hazard layers for extreme heat, drought, wildfire, flooding, and coastal inundation down to the census tract level. [47]
Decision Context | Primary Model Outputs Used | Key Governance Consideration |
|---|---|---|
Underwriting & pricing | Location-level AAL, tail loss, damage ratios | Use policy defines approved model and data quality standards |
Accumulation management | Aggregated OEP/AEP by peril and region | Risk appetite limits tied to modeled PML thresholds |
Reinsurance treaty structuring | Layer loss costs, attachment exceedance probabilities | Independent validation of event set and vulnerability assumptions |
Capital allocation (RBC/rating agency) | Modeled catastrophe loss, reinsurance recoverables | Regulatory acceptance, documentation of model limitations |
Lender due diligence | Expected annual loss, damage ratios, high-risk zone exposure | Version control, scenario transparency for credit underwriting |
Municipal resilience planning | Scenario losses, infrastructure disruption estimates | Public accountability, reproducible outputs, community equity |
The same outputs also support physical adaptation, land-use choices, and capital planning.
Turning Model Output into Resilience Action
Technical output only matters if it changes decisions.
For asset hardening, organizations use modeled loss distributions and hazard maps to find high-risk assets and weigh the cost and payoff of specific actions. That may mean elevating equipment, installing flood barriers, using fire-resistant materials, or upgrading roof construction. The goal is simple: back the measures that cut modeled losses the most per dollar spent.
For land-use and siting decisions, modeled hazard layers help decide where development should move ahead, where it should be discouraged, how setbacks should be designed, and when managed retreat or a different land use makes more sense than putting more money into the same exposed area. In insurance program design, catastrophe models guide retentions, limits, and layering for property and business-interruption coverage. They help organizations sort out the right mix of insurance, reinsurance, captives, and catastrophe bonds based on risk appetite and capital position.
Stakeholder planning turns model results into plain-language scenarios for operations, finance, regulators, investors, and communities.
The strongest programs keep models on a review cycle tied to pricing, capital, and resilience planning.
Conclusion: What a Strong Catastrophe Modeling Program Looks Like in 2026
The earlier sections point to a simple truth: model value comes less from the software itself and more from disciplined use. A strong catastrophe modeling program in 2026 is not shaped by vendor choice or the number of perils in scope. It comes down to how well an organization understands what its models are doing, where those models fall short, and how the output feeds real decisions. The four pillars - model structure, fit-for-purpose data, the right tool mix, and disciplined governance - work only when they support each other.
The biggest mindset shift is this: treat model output as a decision input, not a final answer. Outputs are central estimates with uncertainty ranges, not precise forecasts. Strong programs make that plain in board materials and risk reports. They show ranges, spell out the assumptions driving uncertainty, and name the blind spots instead of brushing past them.
Catastrophe modeling is not about analysis for its own sake. It’s about action. The best programs turn analysis into decisions, using model output to shape capital planning, underwriting, and resilience efforts.
They also treat modeling as a living capability, not a one-and-done project. That means keeping review cycles in place and maintaining change logs as climate risk shifts and portfolios move. The same discipline also supports broader resilience and disaster risk management, including public-sector planning for mitigation, preparedness, and recovery.
In 2026, the best catastrophe modeling programs are accurate enough to trust, transparent enough to defend, and practical enough to change decisions.
FAQs
How accurate are catastrophe models?
Catastrophe models are useful for spotting big-picture, long-term trends, but they become less certain when you zoom in to a single place or a near-term time frame. That gap matters. A model may do a solid job showing how risk shifts across a region over decades, yet still struggle to pin down what happens on one block, one site, or one season. Much of that comes down to the quality of the geospatial inputs and the climate projections underneath the model.
No single model should be treated as gospel. Each one can carry its own bias, shaped by its assumptions, data sources, and calibration choices. That’s why experts often rely on multi-model ensembles instead of one stand-alone result. Looking at a range of outputs gives decision-makers a better sense of where estimates line up, where they drift apart, and how much uncertainty sits in the middle.
Historical data still plays a big role because it helps test how well a model matches observed past events. But past performance, by itself, doesn’t tell the whole story. Climate risk is shifting, and assessments that only look backward can miss what’s coming next. Strong analysis pairs historical validation with forward-looking climate projections so the picture is grounded in both what has happened and what may lie ahead.
What data matters most in cat modeling?
The most important data follows the core risk equation: Risk = Hazard × Exposure × Vulnerability.
That means you need three layers working together:
Granular geospatial hazard data to show where threats are and how severe they may be
Asset-level exposure data such as site location and property value
Vulnerability data to show how physical damage turns into financial impact, including revenue loss or business interruption
On its own, each dataset tells only part of the story. Put them together, and you can trace risk from the hazard itself to the asset in harm’s way, then all the way to the business outcome in dollars.
When should I use climate-conditioned loss views?
Use climate-conditioned loss views when you need a clear picture of how human-caused climate change has already shifted, or will keep shifting, your physical risk profile. They help you look past historical data alone, which can lowball future risk when the climate itself is changing.
They’re useful for risk pricing, capital reserves, forward-looking disclosures, and long-range planning, including insurance strategy and supply chain resilience.
Related Blog Posts
Latest Articles
©2025

Narrative Change and Power Building: The Missing Half of Advocacy
Narrative change is the process of disrupting dominant narratives that normalize inequity and advancing new narratives from historically marginalized communities.

Funding Resilience Without Federal Grants
BRIC is unreliable and FEMA is shrinking. Here's how cities fund climate resilience with dedicated revenue, blended finance, and a coordinating authority.

The ESG Blind Spot: How AI Is Finding Risks in Companies Nobody Else Is Watching
Norway's sovereign wealth fund uses AI to screen 7,200 portfolio companies for forced labor and corruption within 24 hours. The real story is the emerging-market coverage gap that traditional ESG data vendors miss — and what it means for any company with a global supply chain.
Narrative Change and Power Building: The Missing Half of Advocacy
Narrative change is the process of disrupting dominant narratives that normalize inequity and advancing new narratives from historically marginalized communities.
Funding Resilience Without Federal Grants
BRIC is unreliable and FEMA is shrinking. Here's how cities fund climate resilience with dedicated revenue, blended finance, and a coordinating authority.
The ESG Blind Spot: How AI Is Finding Risks in Companies Nobody Else Is Watching
Norway's sovereign wealth fund uses AI to screen 7,200 portfolio companies for forced labor and corruption within 24 hours. The real story is the emerging-market coverage gap that traditional ESG data vendors miss — and what it means for any company with a global supply chain.
FAQ
01
What does it really mean to “redefine profit”?
02
What makes Council Fire different?
03
Who does Council Fire work with?
04
What does working with Council Fire actually look like?
05
How does Council Fire help organizations turn big goals into action?
06
How does Council Fire define and measure success?
Sep 12, 2026
Catastrophe Modeling And Risk: Guide 2026
Governance
In This Article
Practical guide to catastrophe models: metrics (AAL/PML/EP), data needs, platform choices, and governance for 2026 risk decisions.
Catastrophe Modeling And Risk: Guide 2026
Catastrophe models help me estimate how often disasters may hit, how bad they may get, and what they may cost - before I commit capital, buy insurance, or plan resilience work. In 2023 and 2024 alone, NOAA logged 28 and 27 billion-dollar U.S. disasters, which is why old history-only methods are no longer enough.
If I had to boil this guide down, it comes to four points:
A catastrophe model links hazard, exposure, vulnerability, and financial terms
The core outputs areAAL, PML, and EP curves
Good results depend on clean location, building, value, and hazard data
Model governance matters because outputs are estimates, not exact answers
Here’s the plain-English version:
AAL tells me the long-run average yearly loss
PML tells me the tail loss, such as a 1% annual chance event
OEP looks at one large event in a year
AEP looks at all events combined in a year
Climate-conditioned views test how losses may change as heat, rainfall, wildfire, sea level, and storm behavior shift
I also need to pick the right tool for the job:
Commercial platforms fit insurance, reinsurance, and capital work
Specialty models add local flood or wildfire detail
Open-source tools give more visibility into assumptions and code
In-house models fit firms with custom data and strong model control
And I cannot stop at model output. To use results well, I need:
a model inventory
version tracking
back-testing against past events
sensitivity testing
rules for overrides and approvals
A simple way to think about it: the model gives me a range, not a promise. I use that range to price risk, shape reinsurance, test capital, harden assets, and guide public or private investment.
Topic | What I need to know |
|---|---|
Model structure | Event, hazard, vulnerability, financial terms |
Main metrics | AAL, PML, OEP, AEP |
Main data | |
Tool choices | Commercial, specialty, open-source, in-house |
Decision use | Underwriting, reinsurance, capital, lending, resilience planning |
Control needs | Validation, documentation, review cycle, audit trail |
Bottom line: if I want cat modeling to help me make better decisions in 2026, I need fit-for-purpose data, the right platform, and clear governance - not just a model run.
Catastrophe Model Platforms Compared: Commercial vs. Open-Source vs. In-House (2026)
Evaluating Catastrophe Models in Insurance | What Works and What’s Changing
1. Catastrophe Model Basics and Core Risk Metrics
Catastrophe models convert simulated events into loss estimates by linking hazard, exposure, vulnerability, and financial terms. At the core, the logic is simple: model the event, map the physical force, estimate the damage, then apply insurance terms. That process runs through four modules: event, hazard, vulnerability, and financial.
The Four-Part Model Structure
The event module builds a synthetic catalog of peril-specific events such as hurricanes, earthquakes, severe convective storms, and wildfires. Each event gets a location, an intensity, and an annual occurrence rate. These catalogs often cover tens of thousands of simulated years so teams can study rare events that do not appear often in recorded history.
The hazard module takes each simulated event and maps its physical intensity across a geographic area. That might mean wind speed in mph, flood depth in feet, or peak ground acceleration in g. From there, the vulnerability module applies damage functions that connect hazard intensity to expected damage ratios for each building type. The same wind speed or flood depth can produce very different damage outcomes depending on construction type and code era.
Exposure data sits underneath all of this. If the geocoding is off, or if a structure is placed in the wrong construction class, the error moves through every module and skews every metric that comes after it. The financial module then applies policy terms like limits, deductibles, attachment points, and reinsurance structures to turn physical damage into insured loss at the policy, portfolio, and treaty level.
Probabilistic, Deterministic, and Climate-Conditioned Views
Probabilistic models run the full stochastic event catalog against a portfolio and produce a complete loss distribution. This is the standard view for pricing, capital allocation, and solvency work because it reflects the full spread of possible losses, not just a single scenario.
Deterministic scenarios focus on one event at a time. That could mean a repeat of Hurricane Ian making landfall near Fort Myers, FL, a Category 4 storm hitting Miami, or a 1-in-100-year flood in the Ohio River Basin. These scenarios answer a direct what-if question. They also work well for stress testing and board-level risk discussions because they are easier to grasp than a full probability curve.
The same setup can also be adjusted for projected climate change. Climate-conditioned views modify hazard assumptions for plausible future climate states. In 2026, many teams run these views alongside standard probabilistic models to test long-horizon exposure. The point is to see how sensitive today’s risk profile is to plausible future climate states, especially for assets with multi-decade timeframes like coastal infrastructure or long-duration property portfolios. [1][2][3]
AAL, PML, and Exceedance Probability Curves
Three metrics show up in almost every catastrophe model report, and mixing them up can lead to bad calls.
Annualized Average Loss (AAL) is the long-run mean annual loss across the full simulation. It is calculated by weighting each event’s loss by its annual probability and summing across the catalog. Insurers use AAL for technical pricing loads and for expected loss budgeting. It does not tell you what any single year will look like. It tells you what the average looks like over a very long period.
Probable Maximum Loss (PML) is a high-percentile tail estimate, usually the 1-in-100-year or 1-in-250-year loss. This is the main metric used for reinsurance program design, capital adequacy discussions, and rating agency review. A 1-in-100-year PML means there is a 1% annual chance of losses at or above that level.
Exceedance probability (EP) curves give the fuller picture. The occurrence EP, or OEP, curve shows the chance that any single event in a year exceeds a given loss amount. That makes it especially useful for occurrence-based reinsurance covers. The aggregate EP, or AEP, curve shows the chance that total annual losses from all events combined exceed a threshold. That matters for aggregate covers and for a portfolio-level view of risk.
Metric | What It Measures | Primary Use |
|---|---|---|
AAL | Long-run mean annual loss | Technical pricing loads, budgeting |
PML (1-in-100 or 1-in-250) | High-percentile tail loss | Reinsurance structuring, capital adequacy, rating agencies |
OEP curve | Probability a single event exceeds a loss level | Occurrence reinsurance layer design |
AEP curve | Probability total annual losses exceed a level | Aggregate cover design, portfolio risk management |
One practical caution matters here: tail metrics are estimates with uncertainty, not exact forecasts. After Hurricane Katrina, post-event analysis exposed major blind spots in storm surge and flood modeling. That is why disciplined catastrophe risk programs usually hold a buffer beyond modeled PMLs rather than treating the number as a hard line. [5]
These outputs depend on the quality of the hazard, exposure, and climate data behind them.
2. Climate, Hazard, Exposure, and Loss Data Inputs
Model output is only as good as the data behind it. If the inputs are weak, the result will be shaky too. In insurance, reinsurance, and finance, that matters fast. Data choice is the first check on model confidence. In practice, catastrophe models rely on hazard and event records, exposure data, vulnerability and loss data, plus climate and background datasets.
U.S. Hazard and Event Datasets
Pick the source that fits the peril, geography, and decision you need to make.
NOAA's Storm Events Database covers more than 49 event types, with records from January 1950 through May 2026. Teams often use it for frequency-severity work on atmospheric perils. One catch: recent records may not be complete because reporting usually trails by about 75 to 120 days. [14][15][16]
NOAA's Billion-Dollar Weather and Climate Disasters dataset tracks CPI-adjusted direct losses for events above $1 billion, with state-level cost data from 1980–2024. Reinsurers and portfolio managers use it to frame tail-loss behavior and test portfolios against past extremes. [13][17][19]
For earthquake risk, the USGS National Seismic Hazard Model (NSHM) 2023 update covers all 50 states and U.S. territories. It provides probabilistic ground-shaking levels used in building codes, insurance rating, and seismic risk estimates. [20]
FEMA's National Flood Hazard Layer (NFHL) and Risk MAP flood mapping guidance define Special Flood Hazard Areas and flood zones at the parcel and neighborhood level. That makes them central for flood zone decisions, NFIP alignment, and compliance work. The USGS 3D Elevation Program, at about 10-meter resolution, supports storm surge and riverine flood modeling by mapping terrain and coastal form. [18][24][25]
For wildfire, NASA FIRMS offers near-real-time active-fire and burned-area signals that support wildfire monitoring and spread analysis.
Climate Projections and Global Reference Datasets
Historical records on their own no longer tell the whole story. Climate-conditioned models add forward-looking hazard assumptions, extending historical calibration into underwriting, capital planning, and reinsurance stress testing.
CMIP6 supplies multi-model climate projections across multiple emissions scenarios. NASA NEX-GDDP-CMIP6 downscales those projections into daily, local-scale outputs, which makes them easier to use for regional hazard adjustments and portfolio stress tests. [11] ERA5 reconstructs historical weather at about 17 miles spatial resolution with hourly to sub-daily time steps, and it performs well for hydrological modeling across much of North America. [6][8] CHIRPS adds precipitation-focused data at about 5 km resolution with daily to five-day estimates. [9][10] EM-DAT records fatalities, affected people, and economic losses by event and country, which helps with macro-level benchmarking where insurer claims data are thin. NGFS climate scenarios and IPCC assessment findings give financial institutions the structured climate pathways used to align hazard adjustments with standard stress tests. [7][12]
These datasets do not estimate insured loss directly. They change hazard frequency and intensity assumptions before the catastrophe model turns damage into loss. In plain terms, they push historical calibration into forward-looking stress tests.
Data Quality, Resolution, and Fit-for-Purpose Selection
Poor exposure data can drown out good hazard data. At the property level, geocoding accuracy is one of the biggest sources of model uncertainty. ZIP-code centroid geocoding can place a property as much as 10 miles off in rural areas. In coastal counties, the gap between parcel-centroid and rooftop-level geocoding can move modeled hurricane losses by 5%–12%, largely because wind and surge risk change fast with distance to the coast. [21][27]
Location is only part of the picture. Occupancy and construction data decide which vulnerability curve gets applied. A wood-frame home and a reinforced concrete commercial building will not take the same damage at the same wind speed or ground shaking level. If construction type is misclassified, or filled in with a generic assumption, losses can be pushed too low or too high, especially for earthquake and wind perils. Replacement values also need to reflect current construction costs, not old appraisals. Claims history remains the best check on modeled vulnerability. [4][21][22][23]
The table below gives a side-by-side view of key data sources by peril focus, geography, resolution, time coverage, and best use case.
Data Source | Peril Focus | Geography | Resolution | Time Coverage | Best Use Case |
|---|---|---|---|---|---|
NOAA Storm Events | Severe convective storms, hurricanes, winter storms, floods | United States | County/zone; event-level timing | 1950–present (through May 2026) | Frequency-severity analysis, claims validation |
NOAA Billion-Dollar Disasters | Multi-peril large events | United States | National/regional; annual stats | 1980–2024 | Tail-loss context, portfolio stress testing |
USGS NSHM | Earthquakes | All 50 states + territories | Fine spatial; long-term probabilistic | Long-term averages | Seismic hazard layers, PML estimation |
FEMA NFHL / Risk MAP | Flood | United States | Parcel/neighborhood; relatively static | Varies by map vintage | Flood zone determination, NFIP compliance |
NASA FIRMS | Wildfire | Global, including U.S. | Near-real-time; fine spatial | Recent years, ongoing | Wildfire ignition monitoring, hazard characterization |
ERA5 Reanalysis | Multi-hazard atmospheric | Global | About 17 miles; hourly to sub-daily | 1979–near present | Historical storm reconstruction, hazard validation |
CHIRPS | Precipitation / drought | Quasi-global (50°S–50°N) | 0.05° (~5 km); daily to five-day | 1981–near present | Extreme rainfall statistics, drought monitoring |
CMIP6 / NEX-GDDP-CMIP6 | Multi-hazard climate trends | Global | Coarse (CMIP6); downscaled daily (NEX) | Projections through 2100 | Climate-conditioned hazard adjustments, scenario stress testing |
EM-DAT | Multi-peril disaster impacts | Global | Country-level; event records | 1900–present | Macro loss benchmarking, NGFS stress test calibration |
Resolution should match the decision. Coarse climate projections fit long-horizon capital planning. High-precision geocoding and parcel-level flood maps are better for underwriting and property-level work. The next step is choosing a modeling platform that can take in these inputs at the right scale.
3. Modeling Platforms in 2026: Commercial, Specialty, Open-Source, and In-House
Once inputs are set, the platform starts to shape almost everything that follows: how fast models run, how much you can inspect, and how cleanly outputs move into business use. In 2026, platform choice comes down to peril mix, geography, transparency needs, and how easily results feed underwriting, capital, and resilience decisions.
Major Commercial and Specialty Model Providers
Moody's RMS, Verisk Extreme Event Solutions, and Aon Impact Forecasting lead the commercial catastrophe modeling market in 2026.[36][38] Each provides broad multi-peril coverage across U.S. hurricane, earthquake, flood, severe convective storm, and wildfire, with tight links to underwriting, pricing, and portfolio management workflows.
The big move right now is toward cloud-delivered platforms. Moody's RMS Intelligent Risk Platform reportedly hosts 700+ risk models, including 300+ from Nasdaq Risk Modelling for Catastrophes.[36] Verisk is expanding Synergy Studio to bring cat models and analytics together in one cloud environment.[41] Aon's ELEMENTS platform includes 180+ models across 95+ territories, with API, on-premise, and cloud delivery options.[37] That cloud setup makes large-portfolio runs easier and helps teams push results straight into underwriting and portfolio systems.
Specialty vendors step in where broad commercial suites can lose local detail. JBA Risk Management offers probabilistic global flood models with 5 m flood mapping in key markets, which lines up with the parcel-level and asset-level exposure data discussed in the previous section.[36] KatRisk concentrates on high-resolution U.S. flood and wildfire at similar detail. Many specialty models also run through shared Oasis-based platforms such as Nasdaq Risk Modelling for Catastrophes.[37][28][29]
Breadth matters, but platform choice also affects validation, workflow, and governance.
Provider Category | Key Examples | Peril Coverage | Deployment Style | Transparency | Typical Enterprise Use |
|---|---|---|---|---|---|
Large commercial suites | Moody's RMS, Verisk, Aon Impact Forecasting, CoreLogic | Multi-peril, global | Cloud SaaS + API; optional on-prem | Moderate (documentation, validation notes; no source code) | U.S. primary insurance, reinsurance treaty pricing, capital modeling |
Specialty / niche providers | JBA Risk Management, KatRisk | Single peril or region (flood, wildfire) | Cloud-first, API, Oasis-compatible | Higher for hazard assumptions and vulnerability curves | Supplement core suite; technical pricing for specialty lines |
Multi-vendor platforms | Nasdaq Risk Modelling for Catastrophes | Multi-peril via vendor ecosystem | Hosted service (Oasis-powered) | Varies by model; standardized data formats | Multiple views of risk, reinsurance analytics |
Open-Source Frameworks and Internal Model Development
Open-source frameworks now support production modeling and validation. Oasis LMF provides a web interface, APIs, and the ktools calculation engine for Monte Carlo loss modeling.[28][29] Its ecosystem now includes about 90+ models from roughly 18–19 providers, covering perils from wind and flood to earthquake and wildfire.[28][33] Open code helps with explainability, but it also puts more validation work on the user. European supervisors, including EIOPA, have pointed to Oasis as a framework that supports model governance and validation transparency.[33]
OpenQuake handles seismic hazard and risk with fully transparent code, which makes it a strong fit for earthquake-focused studies and building code support.[30][31] CLIMADA is a Python-based framework for multi-hazard climate risk assessment, adaptation option appraisal, and socio-economic impact assessment. It fits resilience planning, climate adaptation studies, and infrastructure investment decisions where the question is not only how much loss? but also what changes if we invest in mitigation?[32][34][35]
Custom in-house models provide the most freedom for proprietary data and bespoke financial structures, but they also bring the heaviest governance load. Internal models need full documentation, version control, and audit trails, and independent validation is required for regulated uses.
Framework | Primary Focus | Cost | Flexibility | Technical Effort | Transparency | Governance Implications |
|---|---|---|---|---|---|---|
Oasis LMF | Multi-peril loss modeling platform | Low (open-source licensing) | High; modular hazard, vulnerability, financial terms | Moderate to high; requires engineering and modeling staff | Full source code access | User owns validation; needs internal change control and oversight |
OpenQuake | Seismic hazard and risk | Low (open-source) | High for earthquake perils | Moderate; well-documented reference implementations | Full source code access | Suitable for regulated and public-interest use with proper documentation |
CLIMADA | Multi-hazard climate risk and adaptation | Low (open-source) | High; supports custom perils and climate scenarios | High; Python-based, requires data science capacity | Full source code and peer-reviewed publications | Strong for public-interest and resilience work; user responsible for validation |
Custom in-house model | Custom perils, proprietary data, bespoke financial structures | High (staff, infrastructure, maintenance) | Maximum | Very high; sustained investment across data science, actuarial, and engineering | Proprietary; requires full internal documentation and audit trails | Heaviest governance burden; independent validation required for regulated uses |
How to Choose the Right Modeling Stack
Start with peril and geography. Then look at regulatory acceptance, explainability, and operational fit. A U.S. personal lines carrier needs a stack that matches its main perils and the level of detail its book demands. A global reinsurer managing treaty portfolios across many regions usually needs breadth first, then more detail for selected books. A city government planning climate adaptation investments often cares more about transparent assumptions and reproducible outputs than regulatory acceptance, which points toward CLIMADA or OpenQuake paired with Oasis for loss modeling.[40][42]
Regulatory and rating agency recognition also matters for insurers. Commercial suites with market acceptance can make U.S. filings easier. Open-source or internal models can still meet regulatory standards, but they need stronger validation evidence and tighter documentation to make that case.
Explainability deserves a close look too. As boards, regulators, and counterparties push for clearer answers on how a loss estimate was produced, the ability to show the steps becomes a governance edge. Open-source frameworks offer full code access. Commercial platforms provide standardized documentation and third-party validation.
It also pays to check API compatibility, portfolio runtime, and links to underwriting and capital systems. Platforms such as Moody's RMS Location Intelligence APIs and Aon's ELEMENTS with Oasis integration are built to cut friction between model output and business decisions.[37][39]
Model selection only gets you part of the way. Governance is what determines how results are reviewed, approved, and used. The next section looks at how governance keeps model use defensible, auditable, and ready for decisions.
4. Governance, Model Risk Management, and Decision Use Cases
Choosing the right platform matters. Governance is what makes model output defensible when a regulator, rating agency, or board asks a simple question: How did you get this loss estimate? Without that structure, even a strong model gets hard to defend. And because model choice affects auditability, governance has to spell out how results are approved, challenged, and reused.
A Practical Governance Framework for Catastrophe Models
A working governance framework starts with a model inventory. Think of it as a central register for every model in use. It should track the vendor or internal owner, version, perils and regions covered, approved uses, key assumptions, known limits, and the next review date.
That inventory needs a written use policy beside it. The policy should define where model output can and cannot drive decisions. Which model is the approved source for U.S. hurricane pricing? What happens when two models disagree? What data quality threshold has to be met before a run is accepted? Those rules need to be clear before people start leaning on the numbers.
Validation can't stop at vendor documentation. Firms need their own back-testing against past events. That means running the portfolio through event sets that approximate Hurricane Harvey, the Camp Fire, or Hurricane Ida, then comparing modeled losses with observed claims by line of business and geography. Sensitivity analysis should also test key assumptions in a structured way, including vulnerability curves, demand surge, and climate conditioning, and show how tail metrics at the high end respond. Those results should go to risk committees, not stay buried in modeling teams.
Aleatory uncertainty is event randomness; epistemic uncertainty is uncertainty in the model itself. Board reporting should separate the central estimate from the uncertainty range and state which exposure segments drive that range. [26][43]
Version control and assumption logging complete the audit trail. Every modeled result used for pricing, capital, or regulatory reporting should link back to a specific model version, exposure snapshot, and run configuration. Independent review, whether internal or external, should test conceptual soundness, data quality, and implementation integrity.
Governance is moving away from point-in-time validation and toward a full model lifecycle view. That includes design, assumptions, use, monitoring, override, escalation, and change management. Regulators are putting more weight on internal governance than on vendor validation alone, so the documentation load is not a one-off task. It sticks around.
Those controls shape whether model output is trusted in underwriting, capital, and resilience decisions.
Insurance, Reinsurance, and Finance Applications
Catastrophe models affect almost every major financial decision in the U.S. insurance and reinsurance market.
In underwriting, they estimate expected and tail losses for specific locations. That feeds risk selection, pricing, and terms across homeowners, commercial property, and specialty infrastructure lines. In accumulation management, insurers track exposure concentrations by peril, region, and ZIP code so they can set risk appetite limits and avoid dangerous buildup in coastal wind or flood zones. A U.S. insurer may use one commercial hurricane model for underwriting and accumulation management, then use a second high-resolution coastal flood model to stress-test tail risk before setting up reinsurance treaties.
In treaty structuring, reinsurers and cedents test excess-of-loss layers, attachment points, and limits against simulated event sets. Capital allocation uses modeled loss distributions to estimate required risk capital under RBC frameworks and rating-agency models. NAIC materials confirm that modeled catastrophe losses for earthquake, hurricane, wildfire, and severe convective storm feed straight into catastrophe risk charges through RBC factors and reinsurance recoverables. [4][44] A U.S. GAO report noted that insurers often limit writings in high-risk areas or buy reinsurance when modeled losses go above 10% to 20% of capital. [45]
Lenders use modeled loss metrics to screen real estate and infrastructure loans. Infrastructure investors use them to test long-term asset performance. Climate-conditioned analysis can shift those numbers in a material way. A World Bank example showed U.S. hurricane insured AAL rising from $11.4 billion to $14.6 billion under a climate-conditioned case, about a 30% jump, while the 1-in-100 year loss moved from $100 billion to $113 billion. [49]
Municipal and public-agency resilience planning also leans on regional hazard and loss modeling to spot vulnerable communities and infrastructure corridors. That work informs zoning, land-use choices, building codes, and public investment priorities. FEMA HAZUS, a free GIS-based tool, estimates economic and social impacts from hurricane wind, flood, and earthquake scenarios for local and state resilience planning. [46][48] NOAA's Climate Mapping for Resilience and Adaptation (CMRA) supports climate-informed infrastructure investment with hazard layers for extreme heat, drought, wildfire, flooding, and coastal inundation down to the census tract level. [47]
Decision Context | Primary Model Outputs Used | Key Governance Consideration |
|---|---|---|
Underwriting & pricing | Location-level AAL, tail loss, damage ratios | Use policy defines approved model and data quality standards |
Accumulation management | Aggregated OEP/AEP by peril and region | Risk appetite limits tied to modeled PML thresholds |
Reinsurance treaty structuring | Layer loss costs, attachment exceedance probabilities | Independent validation of event set and vulnerability assumptions |
Capital allocation (RBC/rating agency) | Modeled catastrophe loss, reinsurance recoverables | Regulatory acceptance, documentation of model limitations |
Lender due diligence | Expected annual loss, damage ratios, high-risk zone exposure | Version control, scenario transparency for credit underwriting |
Municipal resilience planning | Scenario losses, infrastructure disruption estimates | Public accountability, reproducible outputs, community equity |
The same outputs also support physical adaptation, land-use choices, and capital planning.
Turning Model Output into Resilience Action
Technical output only matters if it changes decisions.
For asset hardening, organizations use modeled loss distributions and hazard maps to find high-risk assets and weigh the cost and payoff of specific actions. That may mean elevating equipment, installing flood barriers, using fire-resistant materials, or upgrading roof construction. The goal is simple: back the measures that cut modeled losses the most per dollar spent.
For land-use and siting decisions, modeled hazard layers help decide where development should move ahead, where it should be discouraged, how setbacks should be designed, and when managed retreat or a different land use makes more sense than putting more money into the same exposed area. In insurance program design, catastrophe models guide retentions, limits, and layering for property and business-interruption coverage. They help organizations sort out the right mix of insurance, reinsurance, captives, and catastrophe bonds based on risk appetite and capital position.
Stakeholder planning turns model results into plain-language scenarios for operations, finance, regulators, investors, and communities.
The strongest programs keep models on a review cycle tied to pricing, capital, and resilience planning.
Conclusion: What a Strong Catastrophe Modeling Program Looks Like in 2026
The earlier sections point to a simple truth: model value comes less from the software itself and more from disciplined use. A strong catastrophe modeling program in 2026 is not shaped by vendor choice or the number of perils in scope. It comes down to how well an organization understands what its models are doing, where those models fall short, and how the output feeds real decisions. The four pillars - model structure, fit-for-purpose data, the right tool mix, and disciplined governance - work only when they support each other.
The biggest mindset shift is this: treat model output as a decision input, not a final answer. Outputs are central estimates with uncertainty ranges, not precise forecasts. Strong programs make that plain in board materials and risk reports. They show ranges, spell out the assumptions driving uncertainty, and name the blind spots instead of brushing past them.
Catastrophe modeling is not about analysis for its own sake. It’s about action. The best programs turn analysis into decisions, using model output to shape capital planning, underwriting, and resilience efforts.
They also treat modeling as a living capability, not a one-and-done project. That means keeping review cycles in place and maintaining change logs as climate risk shifts and portfolios move. The same discipline also supports broader resilience and disaster risk management, including public-sector planning for mitigation, preparedness, and recovery.
In 2026, the best catastrophe modeling programs are accurate enough to trust, transparent enough to defend, and practical enough to change decisions.
FAQs
How accurate are catastrophe models?
Catastrophe models are useful for spotting big-picture, long-term trends, but they become less certain when you zoom in to a single place or a near-term time frame. That gap matters. A model may do a solid job showing how risk shifts across a region over decades, yet still struggle to pin down what happens on one block, one site, or one season. Much of that comes down to the quality of the geospatial inputs and the climate projections underneath the model.
No single model should be treated as gospel. Each one can carry its own bias, shaped by its assumptions, data sources, and calibration choices. That’s why experts often rely on multi-model ensembles instead of one stand-alone result. Looking at a range of outputs gives decision-makers a better sense of where estimates line up, where they drift apart, and how much uncertainty sits in the middle.
Historical data still plays a big role because it helps test how well a model matches observed past events. But past performance, by itself, doesn’t tell the whole story. Climate risk is shifting, and assessments that only look backward can miss what’s coming next. Strong analysis pairs historical validation with forward-looking climate projections so the picture is grounded in both what has happened and what may lie ahead.
What data matters most in cat modeling?
The most important data follows the core risk equation: Risk = Hazard × Exposure × Vulnerability.
That means you need three layers working together:
Granular geospatial hazard data to show where threats are and how severe they may be
Asset-level exposure data such as site location and property value
Vulnerability data to show how physical damage turns into financial impact, including revenue loss or business interruption
On its own, each dataset tells only part of the story. Put them together, and you can trace risk from the hazard itself to the asset in harm’s way, then all the way to the business outcome in dollars.
When should I use climate-conditioned loss views?
Use climate-conditioned loss views when you need a clear picture of how human-caused climate change has already shifted, or will keep shifting, your physical risk profile. They help you look past historical data alone, which can lowball future risk when the climate itself is changing.
They’re useful for risk pricing, capital reserves, forward-looking disclosures, and long-range planning, including insurance strategy and supply chain resilience.
Related Blog Posts
Latest Articles
©2025
Narrative Change and Power Building: The Missing Half of Advocacy
Narrative change is the process of disrupting dominant narratives that normalize inequity and advancing new narratives from historically marginalized communities.
Funding Resilience Without Federal Grants
BRIC is unreliable and FEMA is shrinking. Here's how cities fund climate resilience with dedicated revenue, blended finance, and a coordinating authority.
The ESG Blind Spot: How AI Is Finding Risks in Companies Nobody Else Is Watching
Norway's sovereign wealth fund uses AI to screen 7,200 portfolio companies for forced labor and corruption within 24 hours. The real story is the emerging-market coverage gap that traditional ESG data vendors miss — and what it means for any company with a global supply chain.
FAQ
01
What does it really mean to “redefine profit”?
02
What makes Council Fire different?
03
Who does Council Fire work with?
04
What does working with Council Fire actually look like?
05
How does Council Fire help organizations turn big goals into action?
06
How does Council Fire define and measure success?
Sep 12, 2026
Catastrophe Modeling And Risk: Guide 2026
Governance
In This Article
Practical guide to catastrophe models: metrics (AAL/PML/EP), data needs, platform choices, and governance for 2026 risk decisions.
Catastrophe Modeling And Risk: Guide 2026
Catastrophe models help me estimate how often disasters may hit, how bad they may get, and what they may cost - before I commit capital, buy insurance, or plan resilience work. In 2023 and 2024 alone, NOAA logged 28 and 27 billion-dollar U.S. disasters, which is why old history-only methods are no longer enough.
If I had to boil this guide down, it comes to four points:
A catastrophe model links hazard, exposure, vulnerability, and financial terms
The core outputs areAAL, PML, and EP curves
Good results depend on clean location, building, value, and hazard data
Model governance matters because outputs are estimates, not exact answers
Here’s the plain-English version:
AAL tells me the long-run average yearly loss
PML tells me the tail loss, such as a 1% annual chance event
OEP looks at one large event in a year
AEP looks at all events combined in a year
Climate-conditioned views test how losses may change as heat, rainfall, wildfire, sea level, and storm behavior shift
I also need to pick the right tool for the job:
Commercial platforms fit insurance, reinsurance, and capital work
Specialty models add local flood or wildfire detail
Open-source tools give more visibility into assumptions and code
In-house models fit firms with custom data and strong model control
And I cannot stop at model output. To use results well, I need:
a model inventory
version tracking
back-testing against past events
sensitivity testing
rules for overrides and approvals
A simple way to think about it: the model gives me a range, not a promise. I use that range to price risk, shape reinsurance, test capital, harden assets, and guide public or private investment.
Topic | What I need to know |
|---|---|
Model structure | Event, hazard, vulnerability, financial terms |
Main metrics | AAL, PML, OEP, AEP |
Main data | |
Tool choices | Commercial, specialty, open-source, in-house |
Decision use | Underwriting, reinsurance, capital, lending, resilience planning |
Control needs | Validation, documentation, review cycle, audit trail |
Bottom line: if I want cat modeling to help me make better decisions in 2026, I need fit-for-purpose data, the right platform, and clear governance - not just a model run.
Catastrophe Model Platforms Compared: Commercial vs. Open-Source vs. In-House (2026)
Evaluating Catastrophe Models in Insurance | What Works and What’s Changing
1. Catastrophe Model Basics and Core Risk Metrics
Catastrophe models convert simulated events into loss estimates by linking hazard, exposure, vulnerability, and financial terms. At the core, the logic is simple: model the event, map the physical force, estimate the damage, then apply insurance terms. That process runs through four modules: event, hazard, vulnerability, and financial.
The Four-Part Model Structure
The event module builds a synthetic catalog of peril-specific events such as hurricanes, earthquakes, severe convective storms, and wildfires. Each event gets a location, an intensity, and an annual occurrence rate. These catalogs often cover tens of thousands of simulated years so teams can study rare events that do not appear often in recorded history.
The hazard module takes each simulated event and maps its physical intensity across a geographic area. That might mean wind speed in mph, flood depth in feet, or peak ground acceleration in g. From there, the vulnerability module applies damage functions that connect hazard intensity to expected damage ratios for each building type. The same wind speed or flood depth can produce very different damage outcomes depending on construction type and code era.
Exposure data sits underneath all of this. If the geocoding is off, or if a structure is placed in the wrong construction class, the error moves through every module and skews every metric that comes after it. The financial module then applies policy terms like limits, deductibles, attachment points, and reinsurance structures to turn physical damage into insured loss at the policy, portfolio, and treaty level.
Probabilistic, Deterministic, and Climate-Conditioned Views
Probabilistic models run the full stochastic event catalog against a portfolio and produce a complete loss distribution. This is the standard view for pricing, capital allocation, and solvency work because it reflects the full spread of possible losses, not just a single scenario.
Deterministic scenarios focus on one event at a time. That could mean a repeat of Hurricane Ian making landfall near Fort Myers, FL, a Category 4 storm hitting Miami, or a 1-in-100-year flood in the Ohio River Basin. These scenarios answer a direct what-if question. They also work well for stress testing and board-level risk discussions because they are easier to grasp than a full probability curve.
The same setup can also be adjusted for projected climate change. Climate-conditioned views modify hazard assumptions for plausible future climate states. In 2026, many teams run these views alongside standard probabilistic models to test long-horizon exposure. The point is to see how sensitive today’s risk profile is to plausible future climate states, especially for assets with multi-decade timeframes like coastal infrastructure or long-duration property portfolios. [1][2][3]
AAL, PML, and Exceedance Probability Curves
Three metrics show up in almost every catastrophe model report, and mixing them up can lead to bad calls.
Annualized Average Loss (AAL) is the long-run mean annual loss across the full simulation. It is calculated by weighting each event’s loss by its annual probability and summing across the catalog. Insurers use AAL for technical pricing loads and for expected loss budgeting. It does not tell you what any single year will look like. It tells you what the average looks like over a very long period.
Probable Maximum Loss (PML) is a high-percentile tail estimate, usually the 1-in-100-year or 1-in-250-year loss. This is the main metric used for reinsurance program design, capital adequacy discussions, and rating agency review. A 1-in-100-year PML means there is a 1% annual chance of losses at or above that level.
Exceedance probability (EP) curves give the fuller picture. The occurrence EP, or OEP, curve shows the chance that any single event in a year exceeds a given loss amount. That makes it especially useful for occurrence-based reinsurance covers. The aggregate EP, or AEP, curve shows the chance that total annual losses from all events combined exceed a threshold. That matters for aggregate covers and for a portfolio-level view of risk.
Metric | What It Measures | Primary Use |
|---|---|---|
AAL | Long-run mean annual loss | Technical pricing loads, budgeting |
PML (1-in-100 or 1-in-250) | High-percentile tail loss | Reinsurance structuring, capital adequacy, rating agencies |
OEP curve | Probability a single event exceeds a loss level | Occurrence reinsurance layer design |
AEP curve | Probability total annual losses exceed a level | Aggregate cover design, portfolio risk management |
One practical caution matters here: tail metrics are estimates with uncertainty, not exact forecasts. After Hurricane Katrina, post-event analysis exposed major blind spots in storm surge and flood modeling. That is why disciplined catastrophe risk programs usually hold a buffer beyond modeled PMLs rather than treating the number as a hard line. [5]
These outputs depend on the quality of the hazard, exposure, and climate data behind them.
2. Climate, Hazard, Exposure, and Loss Data Inputs
Model output is only as good as the data behind it. If the inputs are weak, the result will be shaky too. In insurance, reinsurance, and finance, that matters fast. Data choice is the first check on model confidence. In practice, catastrophe models rely on hazard and event records, exposure data, vulnerability and loss data, plus climate and background datasets.
U.S. Hazard and Event Datasets
Pick the source that fits the peril, geography, and decision you need to make.
NOAA's Storm Events Database covers more than 49 event types, with records from January 1950 through May 2026. Teams often use it for frequency-severity work on atmospheric perils. One catch: recent records may not be complete because reporting usually trails by about 75 to 120 days. [14][15][16]
NOAA's Billion-Dollar Weather and Climate Disasters dataset tracks CPI-adjusted direct losses for events above $1 billion, with state-level cost data from 1980–2024. Reinsurers and portfolio managers use it to frame tail-loss behavior and test portfolios against past extremes. [13][17][19]
For earthquake risk, the USGS National Seismic Hazard Model (NSHM) 2023 update covers all 50 states and U.S. territories. It provides probabilistic ground-shaking levels used in building codes, insurance rating, and seismic risk estimates. [20]
FEMA's National Flood Hazard Layer (NFHL) and Risk MAP flood mapping guidance define Special Flood Hazard Areas and flood zones at the parcel and neighborhood level. That makes them central for flood zone decisions, NFIP alignment, and compliance work. The USGS 3D Elevation Program, at about 10-meter resolution, supports storm surge and riverine flood modeling by mapping terrain and coastal form. [18][24][25]
For wildfire, NASA FIRMS offers near-real-time active-fire and burned-area signals that support wildfire monitoring and spread analysis.
Climate Projections and Global Reference Datasets
Historical records on their own no longer tell the whole story. Climate-conditioned models add forward-looking hazard assumptions, extending historical calibration into underwriting, capital planning, and reinsurance stress testing.
CMIP6 supplies multi-model climate projections across multiple emissions scenarios. NASA NEX-GDDP-CMIP6 downscales those projections into daily, local-scale outputs, which makes them easier to use for regional hazard adjustments and portfolio stress tests. [11] ERA5 reconstructs historical weather at about 17 miles spatial resolution with hourly to sub-daily time steps, and it performs well for hydrological modeling across much of North America. [6][8] CHIRPS adds precipitation-focused data at about 5 km resolution with daily to five-day estimates. [9][10] EM-DAT records fatalities, affected people, and economic losses by event and country, which helps with macro-level benchmarking where insurer claims data are thin. NGFS climate scenarios and IPCC assessment findings give financial institutions the structured climate pathways used to align hazard adjustments with standard stress tests. [7][12]
These datasets do not estimate insured loss directly. They change hazard frequency and intensity assumptions before the catastrophe model turns damage into loss. In plain terms, they push historical calibration into forward-looking stress tests.
Data Quality, Resolution, and Fit-for-Purpose Selection
Poor exposure data can drown out good hazard data. At the property level, geocoding accuracy is one of the biggest sources of model uncertainty. ZIP-code centroid geocoding can place a property as much as 10 miles off in rural areas. In coastal counties, the gap between parcel-centroid and rooftop-level geocoding can move modeled hurricane losses by 5%–12%, largely because wind and surge risk change fast with distance to the coast. [21][27]
Location is only part of the picture. Occupancy and construction data decide which vulnerability curve gets applied. A wood-frame home and a reinforced concrete commercial building will not take the same damage at the same wind speed or ground shaking level. If construction type is misclassified, or filled in with a generic assumption, losses can be pushed too low or too high, especially for earthquake and wind perils. Replacement values also need to reflect current construction costs, not old appraisals. Claims history remains the best check on modeled vulnerability. [4][21][22][23]
The table below gives a side-by-side view of key data sources by peril focus, geography, resolution, time coverage, and best use case.
Data Source | Peril Focus | Geography | Resolution | Time Coverage | Best Use Case |
|---|---|---|---|---|---|
NOAA Storm Events | Severe convective storms, hurricanes, winter storms, floods | United States | County/zone; event-level timing | 1950–present (through May 2026) | Frequency-severity analysis, claims validation |
NOAA Billion-Dollar Disasters | Multi-peril large events | United States | National/regional; annual stats | 1980–2024 | Tail-loss context, portfolio stress testing |
USGS NSHM | Earthquakes | All 50 states + territories | Fine spatial; long-term probabilistic | Long-term averages | Seismic hazard layers, PML estimation |
FEMA NFHL / Risk MAP | Flood | United States | Parcel/neighborhood; relatively static | Varies by map vintage | Flood zone determination, NFIP compliance |
NASA FIRMS | Wildfire | Global, including U.S. | Near-real-time; fine spatial | Recent years, ongoing | Wildfire ignition monitoring, hazard characterization |
ERA5 Reanalysis | Multi-hazard atmospheric | Global | About 17 miles; hourly to sub-daily | 1979–near present | Historical storm reconstruction, hazard validation |
CHIRPS | Precipitation / drought | Quasi-global (50°S–50°N) | 0.05° (~5 km); daily to five-day | 1981–near present | Extreme rainfall statistics, drought monitoring |
CMIP6 / NEX-GDDP-CMIP6 | Multi-hazard climate trends | Global | Coarse (CMIP6); downscaled daily (NEX) | Projections through 2100 | Climate-conditioned hazard adjustments, scenario stress testing |
EM-DAT | Multi-peril disaster impacts | Global | Country-level; event records | 1900–present | Macro loss benchmarking, NGFS stress test calibration |
Resolution should match the decision. Coarse climate projections fit long-horizon capital planning. High-precision geocoding and parcel-level flood maps are better for underwriting and property-level work. The next step is choosing a modeling platform that can take in these inputs at the right scale.
3. Modeling Platforms in 2026: Commercial, Specialty, Open-Source, and In-House
Once inputs are set, the platform starts to shape almost everything that follows: how fast models run, how much you can inspect, and how cleanly outputs move into business use. In 2026, platform choice comes down to peril mix, geography, transparency needs, and how easily results feed underwriting, capital, and resilience decisions.
Major Commercial and Specialty Model Providers
Moody's RMS, Verisk Extreme Event Solutions, and Aon Impact Forecasting lead the commercial catastrophe modeling market in 2026.[36][38] Each provides broad multi-peril coverage across U.S. hurricane, earthquake, flood, severe convective storm, and wildfire, with tight links to underwriting, pricing, and portfolio management workflows.
The big move right now is toward cloud-delivered platforms. Moody's RMS Intelligent Risk Platform reportedly hosts 700+ risk models, including 300+ from Nasdaq Risk Modelling for Catastrophes.[36] Verisk is expanding Synergy Studio to bring cat models and analytics together in one cloud environment.[41] Aon's ELEMENTS platform includes 180+ models across 95+ territories, with API, on-premise, and cloud delivery options.[37] That cloud setup makes large-portfolio runs easier and helps teams push results straight into underwriting and portfolio systems.
Specialty vendors step in where broad commercial suites can lose local detail. JBA Risk Management offers probabilistic global flood models with 5 m flood mapping in key markets, which lines up with the parcel-level and asset-level exposure data discussed in the previous section.[36] KatRisk concentrates on high-resolution U.S. flood and wildfire at similar detail. Many specialty models also run through shared Oasis-based platforms such as Nasdaq Risk Modelling for Catastrophes.[37][28][29]
Breadth matters, but platform choice also affects validation, workflow, and governance.
Provider Category | Key Examples | Peril Coverage | Deployment Style | Transparency | Typical Enterprise Use |
|---|---|---|---|---|---|
Large commercial suites | Moody's RMS, Verisk, Aon Impact Forecasting, CoreLogic | Multi-peril, global | Cloud SaaS + API; optional on-prem | Moderate (documentation, validation notes; no source code) | U.S. primary insurance, reinsurance treaty pricing, capital modeling |
Specialty / niche providers | JBA Risk Management, KatRisk | Single peril or region (flood, wildfire) | Cloud-first, API, Oasis-compatible | Higher for hazard assumptions and vulnerability curves | Supplement core suite; technical pricing for specialty lines |
Multi-vendor platforms | Nasdaq Risk Modelling for Catastrophes | Multi-peril via vendor ecosystem | Hosted service (Oasis-powered) | Varies by model; standardized data formats | Multiple views of risk, reinsurance analytics |
Open-Source Frameworks and Internal Model Development
Open-source frameworks now support production modeling and validation. Oasis LMF provides a web interface, APIs, and the ktools calculation engine for Monte Carlo loss modeling.[28][29] Its ecosystem now includes about 90+ models from roughly 18–19 providers, covering perils from wind and flood to earthquake and wildfire.[28][33] Open code helps with explainability, but it also puts more validation work on the user. European supervisors, including EIOPA, have pointed to Oasis as a framework that supports model governance and validation transparency.[33]
OpenQuake handles seismic hazard and risk with fully transparent code, which makes it a strong fit for earthquake-focused studies and building code support.[30][31] CLIMADA is a Python-based framework for multi-hazard climate risk assessment, adaptation option appraisal, and socio-economic impact assessment. It fits resilience planning, climate adaptation studies, and infrastructure investment decisions where the question is not only how much loss? but also what changes if we invest in mitigation?[32][34][35]
Custom in-house models provide the most freedom for proprietary data and bespoke financial structures, but they also bring the heaviest governance load. Internal models need full documentation, version control, and audit trails, and independent validation is required for regulated uses.
Framework | Primary Focus | Cost | Flexibility | Technical Effort | Transparency | Governance Implications |
|---|---|---|---|---|---|---|
Oasis LMF | Multi-peril loss modeling platform | Low (open-source licensing) | High; modular hazard, vulnerability, financial terms | Moderate to high; requires engineering and modeling staff | Full source code access | User owns validation; needs internal change control and oversight |
OpenQuake | Seismic hazard and risk | Low (open-source) | High for earthquake perils | Moderate; well-documented reference implementations | Full source code access | Suitable for regulated and public-interest use with proper documentation |
CLIMADA | Multi-hazard climate risk and adaptation | Low (open-source) | High; supports custom perils and climate scenarios | High; Python-based, requires data science capacity | Full source code and peer-reviewed publications | Strong for public-interest and resilience work; user responsible for validation |
Custom in-house model | Custom perils, proprietary data, bespoke financial structures | High (staff, infrastructure, maintenance) | Maximum | Very high; sustained investment across data science, actuarial, and engineering | Proprietary; requires full internal documentation and audit trails | Heaviest governance burden; independent validation required for regulated uses |
How to Choose the Right Modeling Stack
Start with peril and geography. Then look at regulatory acceptance, explainability, and operational fit. A U.S. personal lines carrier needs a stack that matches its main perils and the level of detail its book demands. A global reinsurer managing treaty portfolios across many regions usually needs breadth first, then more detail for selected books. A city government planning climate adaptation investments often cares more about transparent assumptions and reproducible outputs than regulatory acceptance, which points toward CLIMADA or OpenQuake paired with Oasis for loss modeling.[40][42]
Regulatory and rating agency recognition also matters for insurers. Commercial suites with market acceptance can make U.S. filings easier. Open-source or internal models can still meet regulatory standards, but they need stronger validation evidence and tighter documentation to make that case.
Explainability deserves a close look too. As boards, regulators, and counterparties push for clearer answers on how a loss estimate was produced, the ability to show the steps becomes a governance edge. Open-source frameworks offer full code access. Commercial platforms provide standardized documentation and third-party validation.
It also pays to check API compatibility, portfolio runtime, and links to underwriting and capital systems. Platforms such as Moody's RMS Location Intelligence APIs and Aon's ELEMENTS with Oasis integration are built to cut friction between model output and business decisions.[37][39]
Model selection only gets you part of the way. Governance is what determines how results are reviewed, approved, and used. The next section looks at how governance keeps model use defensible, auditable, and ready for decisions.
4. Governance, Model Risk Management, and Decision Use Cases
Choosing the right platform matters. Governance is what makes model output defensible when a regulator, rating agency, or board asks a simple question: How did you get this loss estimate? Without that structure, even a strong model gets hard to defend. And because model choice affects auditability, governance has to spell out how results are approved, challenged, and reused.
A Practical Governance Framework for Catastrophe Models
A working governance framework starts with a model inventory. Think of it as a central register for every model in use. It should track the vendor or internal owner, version, perils and regions covered, approved uses, key assumptions, known limits, and the next review date.
That inventory needs a written use policy beside it. The policy should define where model output can and cannot drive decisions. Which model is the approved source for U.S. hurricane pricing? What happens when two models disagree? What data quality threshold has to be met before a run is accepted? Those rules need to be clear before people start leaning on the numbers.
Validation can't stop at vendor documentation. Firms need their own back-testing against past events. That means running the portfolio through event sets that approximate Hurricane Harvey, the Camp Fire, or Hurricane Ida, then comparing modeled losses with observed claims by line of business and geography. Sensitivity analysis should also test key assumptions in a structured way, including vulnerability curves, demand surge, and climate conditioning, and show how tail metrics at the high end respond. Those results should go to risk committees, not stay buried in modeling teams.
Aleatory uncertainty is event randomness; epistemic uncertainty is uncertainty in the model itself. Board reporting should separate the central estimate from the uncertainty range and state which exposure segments drive that range. [26][43]
Version control and assumption logging complete the audit trail. Every modeled result used for pricing, capital, or regulatory reporting should link back to a specific model version, exposure snapshot, and run configuration. Independent review, whether internal or external, should test conceptual soundness, data quality, and implementation integrity.
Governance is moving away from point-in-time validation and toward a full model lifecycle view. That includes design, assumptions, use, monitoring, override, escalation, and change management. Regulators are putting more weight on internal governance than on vendor validation alone, so the documentation load is not a one-off task. It sticks around.
Those controls shape whether model output is trusted in underwriting, capital, and resilience decisions.
Insurance, Reinsurance, and Finance Applications
Catastrophe models affect almost every major financial decision in the U.S. insurance and reinsurance market.
In underwriting, they estimate expected and tail losses for specific locations. That feeds risk selection, pricing, and terms across homeowners, commercial property, and specialty infrastructure lines. In accumulation management, insurers track exposure concentrations by peril, region, and ZIP code so they can set risk appetite limits and avoid dangerous buildup in coastal wind or flood zones. A U.S. insurer may use one commercial hurricane model for underwriting and accumulation management, then use a second high-resolution coastal flood model to stress-test tail risk before setting up reinsurance treaties.
In treaty structuring, reinsurers and cedents test excess-of-loss layers, attachment points, and limits against simulated event sets. Capital allocation uses modeled loss distributions to estimate required risk capital under RBC frameworks and rating-agency models. NAIC materials confirm that modeled catastrophe losses for earthquake, hurricane, wildfire, and severe convective storm feed straight into catastrophe risk charges through RBC factors and reinsurance recoverables. [4][44] A U.S. GAO report noted that insurers often limit writings in high-risk areas or buy reinsurance when modeled losses go above 10% to 20% of capital. [45]
Lenders use modeled loss metrics to screen real estate and infrastructure loans. Infrastructure investors use them to test long-term asset performance. Climate-conditioned analysis can shift those numbers in a material way. A World Bank example showed U.S. hurricane insured AAL rising from $11.4 billion to $14.6 billion under a climate-conditioned case, about a 30% jump, while the 1-in-100 year loss moved from $100 billion to $113 billion. [49]
Municipal and public-agency resilience planning also leans on regional hazard and loss modeling to spot vulnerable communities and infrastructure corridors. That work informs zoning, land-use choices, building codes, and public investment priorities. FEMA HAZUS, a free GIS-based tool, estimates economic and social impacts from hurricane wind, flood, and earthquake scenarios for local and state resilience planning. [46][48] NOAA's Climate Mapping for Resilience and Adaptation (CMRA) supports climate-informed infrastructure investment with hazard layers for extreme heat, drought, wildfire, flooding, and coastal inundation down to the census tract level. [47]
Decision Context | Primary Model Outputs Used | Key Governance Consideration |
|---|---|---|
Underwriting & pricing | Location-level AAL, tail loss, damage ratios | Use policy defines approved model and data quality standards |
Accumulation management | Aggregated OEP/AEP by peril and region | Risk appetite limits tied to modeled PML thresholds |
Reinsurance treaty structuring | Layer loss costs, attachment exceedance probabilities | Independent validation of event set and vulnerability assumptions |
Capital allocation (RBC/rating agency) | Modeled catastrophe loss, reinsurance recoverables | Regulatory acceptance, documentation of model limitations |
Lender due diligence | Expected annual loss, damage ratios, high-risk zone exposure | Version control, scenario transparency for credit underwriting |
Municipal resilience planning | Scenario losses, infrastructure disruption estimates | Public accountability, reproducible outputs, community equity |
The same outputs also support physical adaptation, land-use choices, and capital planning.
Turning Model Output into Resilience Action
Technical output only matters if it changes decisions.
For asset hardening, organizations use modeled loss distributions and hazard maps to find high-risk assets and weigh the cost and payoff of specific actions. That may mean elevating equipment, installing flood barriers, using fire-resistant materials, or upgrading roof construction. The goal is simple: back the measures that cut modeled losses the most per dollar spent.
For land-use and siting decisions, modeled hazard layers help decide where development should move ahead, where it should be discouraged, how setbacks should be designed, and when managed retreat or a different land use makes more sense than putting more money into the same exposed area. In insurance program design, catastrophe models guide retentions, limits, and layering for property and business-interruption coverage. They help organizations sort out the right mix of insurance, reinsurance, captives, and catastrophe bonds based on risk appetite and capital position.
Stakeholder planning turns model results into plain-language scenarios for operations, finance, regulators, investors, and communities.
The strongest programs keep models on a review cycle tied to pricing, capital, and resilience planning.
Conclusion: What a Strong Catastrophe Modeling Program Looks Like in 2026
The earlier sections point to a simple truth: model value comes less from the software itself and more from disciplined use. A strong catastrophe modeling program in 2026 is not shaped by vendor choice or the number of perils in scope. It comes down to how well an organization understands what its models are doing, where those models fall short, and how the output feeds real decisions. The four pillars - model structure, fit-for-purpose data, the right tool mix, and disciplined governance - work only when they support each other.
The biggest mindset shift is this: treat model output as a decision input, not a final answer. Outputs are central estimates with uncertainty ranges, not precise forecasts. Strong programs make that plain in board materials and risk reports. They show ranges, spell out the assumptions driving uncertainty, and name the blind spots instead of brushing past them.
Catastrophe modeling is not about analysis for its own sake. It’s about action. The best programs turn analysis into decisions, using model output to shape capital planning, underwriting, and resilience efforts.
They also treat modeling as a living capability, not a one-and-done project. That means keeping review cycles in place and maintaining change logs as climate risk shifts and portfolios move. The same discipline also supports broader resilience and disaster risk management, including public-sector planning for mitigation, preparedness, and recovery.
In 2026, the best catastrophe modeling programs are accurate enough to trust, transparent enough to defend, and practical enough to change decisions.
FAQs
How accurate are catastrophe models?
Catastrophe models are useful for spotting big-picture, long-term trends, but they become less certain when you zoom in to a single place or a near-term time frame. That gap matters. A model may do a solid job showing how risk shifts across a region over decades, yet still struggle to pin down what happens on one block, one site, or one season. Much of that comes down to the quality of the geospatial inputs and the climate projections underneath the model.
No single model should be treated as gospel. Each one can carry its own bias, shaped by its assumptions, data sources, and calibration choices. That’s why experts often rely on multi-model ensembles instead of one stand-alone result. Looking at a range of outputs gives decision-makers a better sense of where estimates line up, where they drift apart, and how much uncertainty sits in the middle.
Historical data still plays a big role because it helps test how well a model matches observed past events. But past performance, by itself, doesn’t tell the whole story. Climate risk is shifting, and assessments that only look backward can miss what’s coming next. Strong analysis pairs historical validation with forward-looking climate projections so the picture is grounded in both what has happened and what may lie ahead.
What data matters most in cat modeling?
The most important data follows the core risk equation: Risk = Hazard × Exposure × Vulnerability.
That means you need three layers working together:
Granular geospatial hazard data to show where threats are and how severe they may be
Asset-level exposure data such as site location and property value
Vulnerability data to show how physical damage turns into financial impact, including revenue loss or business interruption
On its own, each dataset tells only part of the story. Put them together, and you can trace risk from the hazard itself to the asset in harm’s way, then all the way to the business outcome in dollars.
When should I use climate-conditioned loss views?
Use climate-conditioned loss views when you need a clear picture of how human-caused climate change has already shifted, or will keep shifting, your physical risk profile. They help you look past historical data alone, which can lowball future risk when the climate itself is changing.
They’re useful for risk pricing, capital reserves, forward-looking disclosures, and long-range planning, including insurance strategy and supply chain resilience.
Related Blog Posts
Latest Articles
©2025
Narrative Change and Power Building: The Missing Half of Advocacy
Narrative change is the process of disrupting dominant narratives that normalize inequity and advancing new narratives from historically marginalized communities.
Funding Resilience Without Federal Grants
BRIC is unreliable and FEMA is shrinking. Here's how cities fund climate resilience with dedicated revenue, blended finance, and a coordinating authority.
The ESG Blind Spot: How AI Is Finding Risks in Companies Nobody Else Is Watching
Norway's sovereign wealth fund uses AI to screen 7,200 portfolio companies for forced labor and corruption within 24 hours. The real story is the emerging-market coverage gap that traditional ESG data vendors miss — and what it means for any company with a global supply chain.
FAQ
What does it really mean to “redefine profit”?
What makes Council Fire different?
Who does Council Fire work with?
What does working with Council Fire actually look like?
How does Council Fire help organizations turn big goals into action?
How does Council Fire define and measure success?