
Jan 25, 2026
How to Conduct Vulnerability Assessment & Equity Mapping for NGOs & Nonprofits
Capacity Building
In This Article
Six-step guide for NGOs to combine vulnerability assessments with equity mapping to identify at-risk communities and prioritize equitable interventions.
How to Conduct Vulnerability Assessment & Equity Mapping for NGOs & Nonprofits
In this guide, we explore how NGOs and nonprofits can use vulnerability assessments and equity mapping to identify risks and address systemic inequalities. These tools help organizations make data-driven decisions to better serve at-risk communities and allocate resources effectively. Here's a quick breakdown:
Vulnerability Assessment: Identifies populations and assets most at risk from hazards (e.g., climate change, economic issues). Focuses on sensitivity (how affected a community is) and adaptive capacity (how well it can recover).
Equity Mapping: Examines how racial, ethnic, and social groups are impacted by policies or programs to address disparities and avoid perpetuating inequities.
Combined Approach: Helps answer critical questions like who faces the greatest risks, where service gaps exist, and how to avoid reinforcing inequalities.
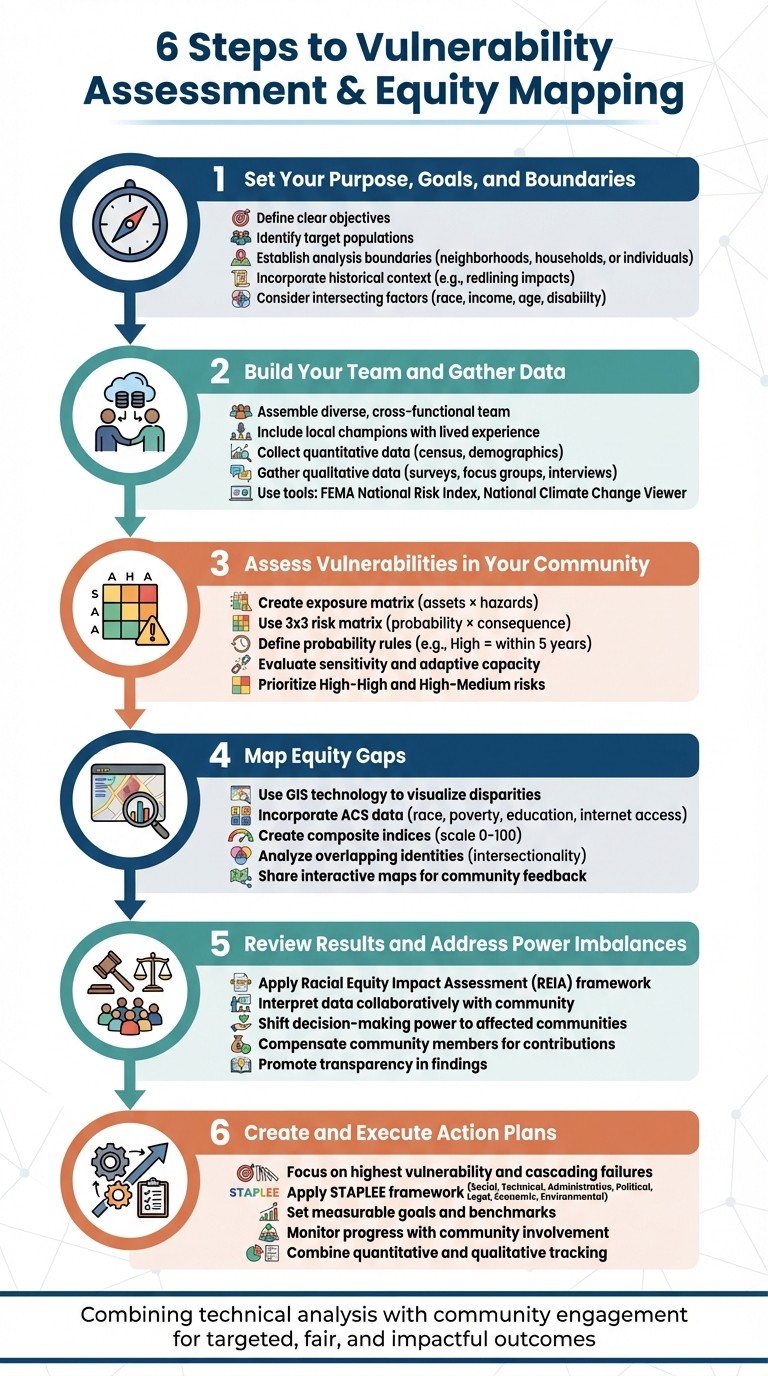
Key Steps:
Define Purpose & Goals: Set clear objectives, identify target populations, and establish boundaries for analysis.
Build a Team & Gather Data: Form a diverse team, collect both quantitative (e.g., census data) and qualitative (e.g., community surveys) information.
Assess Community Vulnerabilities: Identify hazards, evaluate risks, and prioritize assets using tools like risk matrices.
Map Equity Gaps: Use GIS tools to visualize disparities and analyze how overlapping identities (e.g., race, income) compound risks.
Review Results & Address Power Imbalances: Interpret findings collaboratively, address gaps, and shift decision-making power to affected communities.
Create Action Plans: Focus on high-risk areas, prioritize interventions, and monitor progress with clear metrics.
By combining technical analysis with community engagement, organizations can ensure their efforts are targeted, fair, and impactful.
6-Step Process for Vulnerability Assessment and Equity Mapping in Nonprofits
Equitable Engagement with Underserved Communities
Step 1: Set Your Purpose, Goals, and Boundaries
Before diving into data collection, take the time to define your objectives and identify your target populations. This initial step ensures your efforts remain focused and impactful, particularly for those most at risk [1][4]. Without such clarity, you risk unintentionally perpetuating the very inequalities you aim to address.
Once your goals are clear, refine your approach by asking targeted questions. Are you assessing how policies affect specific racial groups? Pinpointing high-risk neighborhoods? Or evaluating whether current programs reach the people who need them most? Use your REIA framework during this planning phase to guide decisions. Conduct this assessment before implementing new proposals to shape your strategy and avoid unforeseen consequences [2].
Establish clear boundaries for your analysis. Decide whether to focus on neighborhoods, households, or individuals [6]. To maintain consistency, create a straightforward rule set - for instance, define "high probability" as a hazard likely to occur within five years [4]. This kind of standardization ensures your team applies uniform criteria across all evaluations.
Your objectives should go beyond merely identifying disparities. Focus on actively reducing and preventing racial inequities [2]. To do this effectively, incorporate historical contexts to uncover root causes. For example, past redlining practices still impact which communities lack green spaces or face flooding risks today [5]. Consider how intersecting factors - such as gender, ethnicity, income, age, disability, and immigration status - create unique vulnerabilities when they overlap [5].
Finally, strike a balance between hard data and community insights. Combining quantitative analysis with qualitative feedback helps you prioritize actions that truly address community needs [4]. This thoughtful and focused approach ensures your interventions align with an equitable, data-informed strategy.
Step 2: Build Your Team and Gather Data
Creating a Diverse Team
An effective assessment team needs more than just technical know-how - it requires individuals who truly understand the local community. Start by identifying a local champion, someone deeply connected to the neighborhoods you're working in. This person brings invaluable lived experience to the table, grounding your efforts in reality rather than assumptions [1][8].
Assemble a cross-functional team that includes program staff, data analysts, and community members who have firsthand knowledge of local challenges [1][5]. Research from The Bridgespan Group, published in June 2023, highlighted an important trend: organizations are increasingly shifting decision-making power to those closest to the work. According to partners Danielle Berfond and Donald Yeh, transferring resources from traditional hubs like New York or London to leaders in the Global South has led to more equitable outcomes [8].
If technical expertise is needed - such as adaptation practitioners or engineering consultants - ensure that local insights remain at the core of your approach [1]. Once your team is in place, the next step is to gather detailed data to guide your efforts.
Gathering Data on Multiple Factors
To get a complete understanding of the situation, combine both quantitative and qualitative data. Start by pulling census data on demographics like race, age, gender, and income. Then enrich these statistics with surveys, focus groups, and face-to-face interviews [3]. Tools like FEMA's National Risk Index and the National Climate Change Viewer can provide baseline data on geographic and environmental risks [4]. However, these resources often miss the nuances of how residents experience these challenges in their daily lives.
When you encounter data gaps, participatory methods can help fill them. For instance, techniques like "photovoice" enable residents to document their surroundings using cameras, while citizen science projects allow community members to actively contribute to the data collection process [3].
"To capture the unique characteristics, perspectives, and knowledge of the community, those numbers [quantitative data] need to be combined with qualitative data, or information typically collected through surveys, focus groups, and in-person interviews." - Georgetown Climate Center [3].
If precise metrics aren’t available, qualitative screenings can serve as a starting point. These screenings categorize risks as high, medium, or low based on observable impacts [1][9].
Keep in mind that the residents most affected by hazards may lack digital access. To ensure their voices are heard, plan targeted outreach efforts. Collaborate with local community-based organizations to explain why this data is being collected and how it will enhance program outcomes [3]. This approach not only strengthens trust but also ensures that the data reflects the realities of those who are most impacted.
Step 3: Assess Vulnerabilities in Your Community
Identifying Hazards and Risks
Start by examining how community assets intersect with potential hazards. One effective way to do this is by creating an exposure matrix. List community assets in the first column and potential hazards - like flooding, extreme heat, or wildfires - across the top. Mark an "X" wherever an asset might be impacted by a hazard. This straightforward tool provides a quick visual overview of your community's most pressing vulnerabilities [10].
To evaluate the risk for each asset-hazard combination, consider both the likelihood of the hazard and the severity of its consequences [1][4]. Set clear rules to categorize probability - for example, classify hazards expected within the next five years as "High Probability", while those occurring less than once every 20 years can be labeled "Low Probability" [1][4]. For estimating consequences, delve into historical data to assess potential financial and social impacts. While traditional methods often emphasize economic losses, applying an equity-focused approach highlights human impacts. Many frontline communities, despite having fewer financial assets, hold vital human and cultural resources that are often undervalued by conventional metrics [11].
"The government at every level is more likely to invest in hazard mitigation measures that benefit the more asset-rich areas, even if fewer people are protected. Having a record of assets in frontline communities can help push the narrative away from being purely financially based." - Enterprise Community Partners [11]
To organize your findings, use a 3x3 risk matrix, with probability on the y-axis and consequence magnitude on the x-axis. Focus your attention and resources on the "High-High" or "High-Medium" cells [1][4]. Additionally, consider secondary hazards - such as wildfires leading to power outages or earthquakes disrupting water supplies [11]. Supplement scientific data with local sources like newspaper archives and interviews to uncover historical patterns of hazards and how past underinvestment, such as redlining, continues to shape current vulnerabilities [11].
These insights will guide you in setting clear criteria for prioritizing the most vulnerable assets.
Setting Criteria to Prioritize Programs
To evaluate asset vulnerability, create a spreadsheet with columns for Asset, Potential Impact, Sensitivity (High/Med/Low), Adaptive Capacity (High/Med/Low), and Overall Vulnerability [1]. Marginalized groups often demonstrate higher sensitivity and lower adaptive capacity, making this evaluation especially important [1][4].
Focus on assets that are essential to the functioning of your community. Infrastructure that could cause "multiple failures across other sectors" if compromised - like telecommunications networks or major bridges - should be treated as high-priority [1]. As the U.S. Climate Resilience Toolkit advises:
"Think about the things your community truly depends upon to function, and use that knowledge to set your priorities" [1].
Interactive tools like FEMA's National Risk Index can provide valuable mapping data for 18 types of natural hazards across the United States, helping you calculate and visualize risks for specific locations [1][4]. While a qualitative approach may be sufficient for a quick assessment, more complex systems might require quantitative geospatial data to reduce uncertainty and refine your priorities [1][4].
Step 4: Map Equity Gaps
Creating Maps That Show Disparities
Once vulnerabilities are identified, the next step is to visualize disparities across communities. Geographic Information System (GIS) technology provides a powerful tool for this, allowing you to incorporate demographic data, health outcomes, and access to resources into specific geographic areas, such as census block groups. This approach helps assess local conditions in a detailed and precise manner [13].
Using tools like ArcGIS Social Equity Analysis, you can map community conditions, create composite indices, and pinpoint areas requiring intervention [14]. Enrich these maps with data from the American Community Survey (ACS), which includes details on race, ethnicity, poverty, education, and internet access, focusing on small spatial units like census block groups for accuracy [13][14][16].
For instance, a GIS analyst in Lucas County developed a "Child Asthma Index" to address respiratory health disparities. By combining six indicators - such as the percentage of children in the population, poverty levels, uninsured children under 19, adults without a high school diploma, households without internet, and asthma prevalence - they ranked census block groups. Using the "Calculate Composite Index" tool and the "Quantile Classes" method, they identified the top 10% of neighborhoods requiring prioritized health program funding [14].
Another example is the Washington Environmental Health Disparities Map, created by the University of Washington DEOHS in collaboration with the Department of Health and the "Front and Centered" coalition. This tool evaluates over 1,450 U.S. Census tracts using 19 indicators, including diesel emissions, housing affordability, and racial demographics. The map has become a critical resource for shaping state and local environmental policies, budgeting decisions, and enforcement of the HEAL Act. The findings highlight stark inequities: residents in census tracts with the highest environmental health disparities (rank 10) live, on average, 5.3 years less than those in the lowest-ranked tracts (rank 1) [15][17].
To make these findings clear and actionable, scale index scores between 0 and 100. This allows stakeholders and the public to easily grasp the results [14][16]. Share these visualizations through interactive web maps or ArcGIS Hub templates to enhance transparency and invite community feedback on proposed interventions [14]. The next step involves analyzing how overlapping identities amplify these disparities.
Analyzing Overlapping Identities
To effectively target interventions, it’s essential to examine how overlapping identities - such as race, income, disability, and exposure to environmental risks - compound vulnerabilities. This intersectional approach helps identify populations facing the most severe disparities, ensuring they receive the attention they need.
After mapping disparities, collaborate with community stakeholders and advisory boards to determine which socioeconomic and health indicators best represent local challenges [14]. As Esri highlights:
"GIS technology helps organizations make assessments about where needs are greatest to plan more equitable and just investments" [13].
Use tools like the Spatial Join feature to integrate data from broader levels (e.g., census tracts) into smaller, more granular levels (e.g., block groups). This ensures that demographic factors and health outcomes are analyzed together for a more comprehensive understanding [14].
To create a combined equity score, integrate variables such as poverty, lack of vehicle access, chronic health issues, and proximity to environmental hazards into a single numerical value. Normalize the data beforehand - using methods like minimum-to-maximum scaling - to ensure comparability across variables with different units [14]. Use correlation charts to check for redundancy, ensuring that highly correlated variables (above 0.90) don’t unintentionally skew the results [14].
Once your equity index is complete, disaggregate the data by race and ethnicity to uncover disparities that might be hidden in aggregate numbers. This step is critical, as ArcGIS documentation underscores:
"The most crucial step in the Racial Equity workflow is to engage communities impacted by the inequity and who will be receiving the support of the intervention" [14].
Share preliminary maps with community members to ensure the data reflects their lived experiences. If certain areas seem overlooked, adjust the indicators accordingly [14].
Finally, classify your index using methods like "Quantile" or "Standard Deviation" to identify the top 10% of areas most in need of immediate intervention. This classification makes it easier to pinpoint specific neighborhoods for funding or programs. To supplement the quantitative data, gather qualitative insights through interviews, focus groups, and community meetings. These personal perspectives provide a deeper understanding of community needs that numbers alone may not capture [3].
Step 5: Review Results and Address Power Imbalances
Understanding Your Findings
Once you've completed your vulnerability assessment and equity mapping, take a methodical approach to interpreting the data. Pinpoint gaps and identify programs requiring improvement. A Racial Equity Impact Assessment (REIA) framework can be invaluable in examining how your programs or proposed actions affect different racial and ethnic groups. This approach has been successfully applied in the United Kingdom for nearly a decade, proving to be an effective tool for addressing inequities [2].
To decide which interventions to prioritize, revisit the 3x3 risk matrix from Step 3. Focus on areas categorized as "High-High" or "High-Medium" for immediate action [1]. Pay close attention to cascading failures, where the failure of one asset or program could lead to breakdowns across multiple sectors in the community [1]. Assess each program's sensitivity and capacity to adapt by rating them as high, medium, or low to determine overall vulnerability and where resources are most needed [1].
Engage both leaders and community members in collaborative sessions to interpret the data and identify actionable steps [7]. These discussions help balance the quantitative findings with qualitative insights and lived experiences. As noted by Ecotrust's evaluation partner:
"The purpose of [meaning-making] sessions is to make meaning from the results of the evaluation, and generate learnings and recommendations" [7].
During this phase, ensure you address any remaining data gaps, particularly those that may exclude marginalized groups [5]. Standardize criteria for your analysis, such as defining "High probability" hazards as those likely to occur within the next five years [1].
With these findings in hand, the next step is to rethink how decision-making power is distributed.
Reducing Power Imbalances
Armed with your review insights, it’s time to adjust internal practices to create a more equitable balance of power. Shift away from centralized decision-making and embrace participatory engagement that prioritizes the voices of those most affected by your programs. A 2023 research project by Bridgespan, involving over 70 individuals across 35 organizations, highlighted a growing trend toward localization - handing decision-making authority to local teams with strong community ties rather than keeping it concentrated in capital-rich hubs like New York or London [8]. As Bridgespan observes:
"At the core, this is about yielding power to communities" [8].
Incorporate participatory design by involving current and former program participants, partner organizations, and community leaders from the start - not just as data sources but as collaborators in shaping the assessment process [7]. Allocate funds to compensate community members for their contributions [7]. Amani Austin, Founder of Austin Advocates With, highlights the importance of this approach:
"Ecotrust's commitment to aligning their practices with their values and allowing the communities' priorities to shape how and where they engage will continue to put Ecotrust in spaces where transformation happens" [7].
Reevaluate internal processes, such as reporting requirements and proposal writing, to ensure they align with an equity-centered mission [18][19]. Research shows that Black-led organizations often face significant financial disparities, with revenues 24% smaller and unrestricted net assets 76% smaller than their white-led counterparts [18]. These inequities are frequently tied to overly burdensome reporting requirements that don’t account for the limited capacity of smaller nonprofits. Lori Heninger, PhD, Executive Director of Montclair Fund for Women, explains:
"There is a power imbalance between those with the funds and those asking for the funds and, because of the nonprofit's commitment to the mission, the staff live with it and do the best they can" [18].
Promote transparency in how findings will be shared and with whom to build trust and reduce fear among partners [7][18]. Actively challenge characteristics of white supremacy culture in your evaluation process by centering racial equity from the beginning [7]. Consider hiring local consultants who can bridge technical expertise with community values and lived experiences [1]. The ultimate goal is to redefine your organization’s role - from a centralized authority to a facilitator that empowers those closest to the ground-level impact [8].
Step 6: Create and Execute Action Plans
Choosing Which Actions to Take First
Turning data into action begins by focusing on assets with the highest vulnerability and the most severe risks [1][4]. Addressing cascading failures is critical - these are situations where the failure of one system triggers breakdowns across multiple sectors. For instance, if a telecommunications tower goes down during a disaster, it could disrupt emergency response efforts, healthcare coordination, and community communication simultaneously [1][4].
To make informed decisions, overlay climate-vulnerability maps with socioeconomic and environmental data. This helps identify "frontline" communities - areas facing overlapping challenges like pollution, poverty, and climate risks [3]. Use the vulnerabilities and equity gaps you’ve already mapped to guide your actions. Apply a Racial Equity Impact Assessment (REIA) to ensure fairness, as Race Forward advises:
"When racial equity is not consciously addressed, racial inequality is often unconsciously replicated" [2].
To evaluate potential actions, consider the STAPLEE framework, which examines interventions through seven lenses:
Social: Does it address the needs of marginalized groups?
Technical: Is it feasible over the long term?
Administrative: Can your team handle the workload?
Political: Is there community support?
Legal: Do you have the authority to implement it?
Economic: Is it financially viable?
Environmental: Does it protect natural systems? [20]
This method ensures your actions align with both community priorities and organizational capacity. Additionally, identify community "anchors" - existing spaces like community centers, faith-based organizations, or local parks - that could serve as hubs for resilience-building efforts [3].
Once priorities are set, the next step is to focus on tracking the outcomes of these actions.
Tracking Your Progress
The data you gathered earlier now serves as a baseline for measuring improvements. Effective monitoring requires the same level of community involvement as the initial assessment. As the Georgetown Climate Center highlights:
"To avoid the problem of reinforcing disparities, therefore, policymakers should pair the benefits of data-guided decisionmaking with substantive community engagement at each stage of the adaptation planning process" [3].
Use participatory tools like photovoice to capture community perspectives directly [3]. Set clear, measurable goals and benchmarks during the planning phase so you can evaluate the success of your interventions later [3]. For example, if you establish cooling centers for heatwaves, monitor both their usage rates and health outcomes to see if they effectively reduce heat-related illnesses. Combine quantitative data, such as census statistics and climate models, with qualitative insights from interviews and focus groups to build a well-rounded understanding of your impact [3].
Hold regular sessions that bring together staff, leaders, and community members to review data and refine strategies collaboratively [7]. Address the digital divide by investing in broadband access and devices for under-resourced residents. This creates direct feedback channels, enabling real-time input on the effectiveness of your actions [3]. By regularly engaging the community, you ensure the process remains dynamic and inclusive [12].
Conclusion
Vulnerability assessments and equity mapping empower NGOs and nonprofits to identify communities most at risk. By integrating quantitative data - such as census statistics and climate projections - with qualitative insights from residents, organizations gain a well-rounded understanding of local needs. This balanced approach avoids the pitfalls of top-down planning that can overlook the lived experiences of those directly affected.
The six-step process outlined in this guide transforms raw data into meaningful community action. By focusing on clear goals, assembling diverse teams, identifying hazards, mapping equity gaps, addressing power dynamics, and tracking progress, organizations ensure that their efforts are both inclusive and impactful. Incorporating Racial Equity Impact Assessments early on helps prevent the unintentional perpetuation of long-standing inequities [2]. These practices highlight the tangible benefits of combining data-driven methods with an equity-centered focus.
Research supports the effectiveness of these targeted strategies. By layering environmental hazard data with socioeconomic factors, nonprofits can pinpoint "frontline" communities - those bearing the brunt of overlapping challenges like pollution and poverty [3]. This precision enables resources to be directed where they are needed most, while ongoing monitoring ensures accountability and allows for adjustments as conditions evolve.
Achieving equity requires deliberate and sustained effort. By coupling technical analysis with meaningful community engagement at every stage, NGOs can transform vulnerability assessments from static documents into dynamic tools for fostering resilience and addressing disparities. This approach underscores the importance of maintaining a continuous focus on equity, ensuring that the methodology remains both relevant and impactful.
FAQs
How can NGOs engage communities effectively during vulnerability assessments?
To effectively connect with communities during vulnerability assessments, NGOs should focus on approaches that encourage participation and inclusivity. This means actively involving local residents through activities such as community meetings, focus groups, or participatory mapping. These hands-on methods not only give individuals a platform to share their insights but also help build a sense of shared responsibility for the outcomes.
Establishing trust and transparency is equally important. Clearly communicate the purpose and potential benefits of the assessment, and ensure the process respects local customs and traditions. Make a deliberate effort to include voices from marginalized groups, ensuring no one is left out. Demonstrating that their contributions are valued - by integrating their feedback into the final results - helps strengthen the partnership and fosters a collective sense of resilience.
True engagement goes beyond simply gathering input. It requires NGOs to embrace a range of perspectives and commit to building long-term relationships within the community. This deeper connection lays the groundwork for more equitable and impactful results.
What are the key tools for effective equity mapping in nonprofits?
Effective equity mapping in nonprofits relies on tools designed to uncover and address disparities while promoting inclusivity. One such resource is the Racial Equity Impact Assessment Toolkit, which helps evaluate how policies or actions affect various racial and ethnic groups. Additionally, detailed guides created by government agencies and nonprofit organizations highlight the importance of community involvement, integrating both quantitative and qualitative data, and factoring in historical and societal contexts to inform decision-making.
Other helpful tools include evaluation kits tailored to racial equity and inclusion, along with self-assessment materials that encourage organizations to reflect on power dynamics and refine their approaches. These resources empower nonprofits to make informed, data-based decisions, foster meaningful community connections, and work toward fairer outcomes.
How can vulnerability assessments help nonprofits allocate resources to support at-risk communities?
Vulnerability assessments play a crucial role for nonprofits by pinpointing the communities, assets, or groups that face the greatest risks from challenges such as climate events or other hazards. By examining factors like sensitivity and the ability to adapt, these assessments offer a clear understanding of where help is needed most. This allows organizations to direct their resources in a way that is both effective and fair.
By combining hard data with insights from the community, these assessments ensure that decisions align with local priorities and values. This inclusive approach helps prevent marginalized populations from being overlooked and encourages a more equitable allocation of resources. Targeting efforts toward the most at-risk areas not only strengthens resilience but also reduces inequalities, leading to outcomes that are both impactful and inclusive.
Related Blog Posts
How to Build a Climate Resilience Plan for NGOs & Nonprofits
How to Integrate Climate Risk into Infrastructure Planning for NGOs & Nonprofits
How to Conduct Vulnerability Assessment & Equity Mapping for Municipalities & Government Agencies
How to Conduct Vulnerability Assessment & Equity Mapping for Corporations
Latest Articles
©2025


FAQ
01
What does it really mean to “redefine profit”?
02
What makes Council Fire different?
03
Who does Council Fire you work with?
04
What does working with Council Fire actually look like?
05
How does Council Fire help organizations turn big goals into action?
06
How does Council Fire define and measure success?
Jan 25, 2026
How to Conduct Vulnerability Assessment & Equity Mapping for NGOs & Nonprofits
Capacity Building
In This Article
Six-step guide for NGOs to combine vulnerability assessments with equity mapping to identify at-risk communities and prioritize equitable interventions.
How to Conduct Vulnerability Assessment & Equity Mapping for NGOs & Nonprofits
In this guide, we explore how NGOs and nonprofits can use vulnerability assessments and equity mapping to identify risks and address systemic inequalities. These tools help organizations make data-driven decisions to better serve at-risk communities and allocate resources effectively. Here's a quick breakdown:
Vulnerability Assessment: Identifies populations and assets most at risk from hazards (e.g., climate change, economic issues). Focuses on sensitivity (how affected a community is) and adaptive capacity (how well it can recover).
Equity Mapping: Examines how racial, ethnic, and social groups are impacted by policies or programs to address disparities and avoid perpetuating inequities.
Combined Approach: Helps answer critical questions like who faces the greatest risks, where service gaps exist, and how to avoid reinforcing inequalities.
Key Steps:
Define Purpose & Goals: Set clear objectives, identify target populations, and establish boundaries for analysis.
Build a Team & Gather Data: Form a diverse team, collect both quantitative (e.g., census data) and qualitative (e.g., community surveys) information.
Assess Community Vulnerabilities: Identify hazards, evaluate risks, and prioritize assets using tools like risk matrices.
Map Equity Gaps: Use GIS tools to visualize disparities and analyze how overlapping identities (e.g., race, income) compound risks.
Review Results & Address Power Imbalances: Interpret findings collaboratively, address gaps, and shift decision-making power to affected communities.
Create Action Plans: Focus on high-risk areas, prioritize interventions, and monitor progress with clear metrics.
By combining technical analysis with community engagement, organizations can ensure their efforts are targeted, fair, and impactful.
6-Step Process for Vulnerability Assessment and Equity Mapping in Nonprofits
Equitable Engagement with Underserved Communities
Step 1: Set Your Purpose, Goals, and Boundaries
Before diving into data collection, take the time to define your objectives and identify your target populations. This initial step ensures your efforts remain focused and impactful, particularly for those most at risk [1][4]. Without such clarity, you risk unintentionally perpetuating the very inequalities you aim to address.
Once your goals are clear, refine your approach by asking targeted questions. Are you assessing how policies affect specific racial groups? Pinpointing high-risk neighborhoods? Or evaluating whether current programs reach the people who need them most? Use your REIA framework during this planning phase to guide decisions. Conduct this assessment before implementing new proposals to shape your strategy and avoid unforeseen consequences [2].
Establish clear boundaries for your analysis. Decide whether to focus on neighborhoods, households, or individuals [6]. To maintain consistency, create a straightforward rule set - for instance, define "high probability" as a hazard likely to occur within five years [4]. This kind of standardization ensures your team applies uniform criteria across all evaluations.
Your objectives should go beyond merely identifying disparities. Focus on actively reducing and preventing racial inequities [2]. To do this effectively, incorporate historical contexts to uncover root causes. For example, past redlining practices still impact which communities lack green spaces or face flooding risks today [5]. Consider how intersecting factors - such as gender, ethnicity, income, age, disability, and immigration status - create unique vulnerabilities when they overlap [5].
Finally, strike a balance between hard data and community insights. Combining quantitative analysis with qualitative feedback helps you prioritize actions that truly address community needs [4]. This thoughtful and focused approach ensures your interventions align with an equitable, data-informed strategy.
Step 2: Build Your Team and Gather Data
Creating a Diverse Team
An effective assessment team needs more than just technical know-how - it requires individuals who truly understand the local community. Start by identifying a local champion, someone deeply connected to the neighborhoods you're working in. This person brings invaluable lived experience to the table, grounding your efforts in reality rather than assumptions [1][8].
Assemble a cross-functional team that includes program staff, data analysts, and community members who have firsthand knowledge of local challenges [1][5]. Research from The Bridgespan Group, published in June 2023, highlighted an important trend: organizations are increasingly shifting decision-making power to those closest to the work. According to partners Danielle Berfond and Donald Yeh, transferring resources from traditional hubs like New York or London to leaders in the Global South has led to more equitable outcomes [8].
If technical expertise is needed - such as adaptation practitioners or engineering consultants - ensure that local insights remain at the core of your approach [1]. Once your team is in place, the next step is to gather detailed data to guide your efforts.
Gathering Data on Multiple Factors
To get a complete understanding of the situation, combine both quantitative and qualitative data. Start by pulling census data on demographics like race, age, gender, and income. Then enrich these statistics with surveys, focus groups, and face-to-face interviews [3]. Tools like FEMA's National Risk Index and the National Climate Change Viewer can provide baseline data on geographic and environmental risks [4]. However, these resources often miss the nuances of how residents experience these challenges in their daily lives.
When you encounter data gaps, participatory methods can help fill them. For instance, techniques like "photovoice" enable residents to document their surroundings using cameras, while citizen science projects allow community members to actively contribute to the data collection process [3].
"To capture the unique characteristics, perspectives, and knowledge of the community, those numbers [quantitative data] need to be combined with qualitative data, or information typically collected through surveys, focus groups, and in-person interviews." - Georgetown Climate Center [3].
If precise metrics aren’t available, qualitative screenings can serve as a starting point. These screenings categorize risks as high, medium, or low based on observable impacts [1][9].
Keep in mind that the residents most affected by hazards may lack digital access. To ensure their voices are heard, plan targeted outreach efforts. Collaborate with local community-based organizations to explain why this data is being collected and how it will enhance program outcomes [3]. This approach not only strengthens trust but also ensures that the data reflects the realities of those who are most impacted.
Step 3: Assess Vulnerabilities in Your Community
Identifying Hazards and Risks
Start by examining how community assets intersect with potential hazards. One effective way to do this is by creating an exposure matrix. List community assets in the first column and potential hazards - like flooding, extreme heat, or wildfires - across the top. Mark an "X" wherever an asset might be impacted by a hazard. This straightforward tool provides a quick visual overview of your community's most pressing vulnerabilities [10].
To evaluate the risk for each asset-hazard combination, consider both the likelihood of the hazard and the severity of its consequences [1][4]. Set clear rules to categorize probability - for example, classify hazards expected within the next five years as "High Probability", while those occurring less than once every 20 years can be labeled "Low Probability" [1][4]. For estimating consequences, delve into historical data to assess potential financial and social impacts. While traditional methods often emphasize economic losses, applying an equity-focused approach highlights human impacts. Many frontline communities, despite having fewer financial assets, hold vital human and cultural resources that are often undervalued by conventional metrics [11].
"The government at every level is more likely to invest in hazard mitigation measures that benefit the more asset-rich areas, even if fewer people are protected. Having a record of assets in frontline communities can help push the narrative away from being purely financially based." - Enterprise Community Partners [11]
To organize your findings, use a 3x3 risk matrix, with probability on the y-axis and consequence magnitude on the x-axis. Focus your attention and resources on the "High-High" or "High-Medium" cells [1][4]. Additionally, consider secondary hazards - such as wildfires leading to power outages or earthquakes disrupting water supplies [11]. Supplement scientific data with local sources like newspaper archives and interviews to uncover historical patterns of hazards and how past underinvestment, such as redlining, continues to shape current vulnerabilities [11].
These insights will guide you in setting clear criteria for prioritizing the most vulnerable assets.
Setting Criteria to Prioritize Programs
To evaluate asset vulnerability, create a spreadsheet with columns for Asset, Potential Impact, Sensitivity (High/Med/Low), Adaptive Capacity (High/Med/Low), and Overall Vulnerability [1]. Marginalized groups often demonstrate higher sensitivity and lower adaptive capacity, making this evaluation especially important [1][4].
Focus on assets that are essential to the functioning of your community. Infrastructure that could cause "multiple failures across other sectors" if compromised - like telecommunications networks or major bridges - should be treated as high-priority [1]. As the U.S. Climate Resilience Toolkit advises:
"Think about the things your community truly depends upon to function, and use that knowledge to set your priorities" [1].
Interactive tools like FEMA's National Risk Index can provide valuable mapping data for 18 types of natural hazards across the United States, helping you calculate and visualize risks for specific locations [1][4]. While a qualitative approach may be sufficient for a quick assessment, more complex systems might require quantitative geospatial data to reduce uncertainty and refine your priorities [1][4].
Step 4: Map Equity Gaps
Creating Maps That Show Disparities
Once vulnerabilities are identified, the next step is to visualize disparities across communities. Geographic Information System (GIS) technology provides a powerful tool for this, allowing you to incorporate demographic data, health outcomes, and access to resources into specific geographic areas, such as census block groups. This approach helps assess local conditions in a detailed and precise manner [13].
Using tools like ArcGIS Social Equity Analysis, you can map community conditions, create composite indices, and pinpoint areas requiring intervention [14]. Enrich these maps with data from the American Community Survey (ACS), which includes details on race, ethnicity, poverty, education, and internet access, focusing on small spatial units like census block groups for accuracy [13][14][16].
For instance, a GIS analyst in Lucas County developed a "Child Asthma Index" to address respiratory health disparities. By combining six indicators - such as the percentage of children in the population, poverty levels, uninsured children under 19, adults without a high school diploma, households without internet, and asthma prevalence - they ranked census block groups. Using the "Calculate Composite Index" tool and the "Quantile Classes" method, they identified the top 10% of neighborhoods requiring prioritized health program funding [14].
Another example is the Washington Environmental Health Disparities Map, created by the University of Washington DEOHS in collaboration with the Department of Health and the "Front and Centered" coalition. This tool evaluates over 1,450 U.S. Census tracts using 19 indicators, including diesel emissions, housing affordability, and racial demographics. The map has become a critical resource for shaping state and local environmental policies, budgeting decisions, and enforcement of the HEAL Act. The findings highlight stark inequities: residents in census tracts with the highest environmental health disparities (rank 10) live, on average, 5.3 years less than those in the lowest-ranked tracts (rank 1) [15][17].
To make these findings clear and actionable, scale index scores between 0 and 100. This allows stakeholders and the public to easily grasp the results [14][16]. Share these visualizations through interactive web maps or ArcGIS Hub templates to enhance transparency and invite community feedback on proposed interventions [14]. The next step involves analyzing how overlapping identities amplify these disparities.
Analyzing Overlapping Identities
To effectively target interventions, it’s essential to examine how overlapping identities - such as race, income, disability, and exposure to environmental risks - compound vulnerabilities. This intersectional approach helps identify populations facing the most severe disparities, ensuring they receive the attention they need.
After mapping disparities, collaborate with community stakeholders and advisory boards to determine which socioeconomic and health indicators best represent local challenges [14]. As Esri highlights:
"GIS technology helps organizations make assessments about where needs are greatest to plan more equitable and just investments" [13].
Use tools like the Spatial Join feature to integrate data from broader levels (e.g., census tracts) into smaller, more granular levels (e.g., block groups). This ensures that demographic factors and health outcomes are analyzed together for a more comprehensive understanding [14].
To create a combined equity score, integrate variables such as poverty, lack of vehicle access, chronic health issues, and proximity to environmental hazards into a single numerical value. Normalize the data beforehand - using methods like minimum-to-maximum scaling - to ensure comparability across variables with different units [14]. Use correlation charts to check for redundancy, ensuring that highly correlated variables (above 0.90) don’t unintentionally skew the results [14].
Once your equity index is complete, disaggregate the data by race and ethnicity to uncover disparities that might be hidden in aggregate numbers. This step is critical, as ArcGIS documentation underscores:
"The most crucial step in the Racial Equity workflow is to engage communities impacted by the inequity and who will be receiving the support of the intervention" [14].
Share preliminary maps with community members to ensure the data reflects their lived experiences. If certain areas seem overlooked, adjust the indicators accordingly [14].
Finally, classify your index using methods like "Quantile" or "Standard Deviation" to identify the top 10% of areas most in need of immediate intervention. This classification makes it easier to pinpoint specific neighborhoods for funding or programs. To supplement the quantitative data, gather qualitative insights through interviews, focus groups, and community meetings. These personal perspectives provide a deeper understanding of community needs that numbers alone may not capture [3].
Step 5: Review Results and Address Power Imbalances
Understanding Your Findings
Once you've completed your vulnerability assessment and equity mapping, take a methodical approach to interpreting the data. Pinpoint gaps and identify programs requiring improvement. A Racial Equity Impact Assessment (REIA) framework can be invaluable in examining how your programs or proposed actions affect different racial and ethnic groups. This approach has been successfully applied in the United Kingdom for nearly a decade, proving to be an effective tool for addressing inequities [2].
To decide which interventions to prioritize, revisit the 3x3 risk matrix from Step 3. Focus on areas categorized as "High-High" or "High-Medium" for immediate action [1]. Pay close attention to cascading failures, where the failure of one asset or program could lead to breakdowns across multiple sectors in the community [1]. Assess each program's sensitivity and capacity to adapt by rating them as high, medium, or low to determine overall vulnerability and where resources are most needed [1].
Engage both leaders and community members in collaborative sessions to interpret the data and identify actionable steps [7]. These discussions help balance the quantitative findings with qualitative insights and lived experiences. As noted by Ecotrust's evaluation partner:
"The purpose of [meaning-making] sessions is to make meaning from the results of the evaluation, and generate learnings and recommendations" [7].
During this phase, ensure you address any remaining data gaps, particularly those that may exclude marginalized groups [5]. Standardize criteria for your analysis, such as defining "High probability" hazards as those likely to occur within the next five years [1].
With these findings in hand, the next step is to rethink how decision-making power is distributed.
Reducing Power Imbalances
Armed with your review insights, it’s time to adjust internal practices to create a more equitable balance of power. Shift away from centralized decision-making and embrace participatory engagement that prioritizes the voices of those most affected by your programs. A 2023 research project by Bridgespan, involving over 70 individuals across 35 organizations, highlighted a growing trend toward localization - handing decision-making authority to local teams with strong community ties rather than keeping it concentrated in capital-rich hubs like New York or London [8]. As Bridgespan observes:
"At the core, this is about yielding power to communities" [8].
Incorporate participatory design by involving current and former program participants, partner organizations, and community leaders from the start - not just as data sources but as collaborators in shaping the assessment process [7]. Allocate funds to compensate community members for their contributions [7]. Amani Austin, Founder of Austin Advocates With, highlights the importance of this approach:
"Ecotrust's commitment to aligning their practices with their values and allowing the communities' priorities to shape how and where they engage will continue to put Ecotrust in spaces where transformation happens" [7].
Reevaluate internal processes, such as reporting requirements and proposal writing, to ensure they align with an equity-centered mission [18][19]. Research shows that Black-led organizations often face significant financial disparities, with revenues 24% smaller and unrestricted net assets 76% smaller than their white-led counterparts [18]. These inequities are frequently tied to overly burdensome reporting requirements that don’t account for the limited capacity of smaller nonprofits. Lori Heninger, PhD, Executive Director of Montclair Fund for Women, explains:
"There is a power imbalance between those with the funds and those asking for the funds and, because of the nonprofit's commitment to the mission, the staff live with it and do the best they can" [18].
Promote transparency in how findings will be shared and with whom to build trust and reduce fear among partners [7][18]. Actively challenge characteristics of white supremacy culture in your evaluation process by centering racial equity from the beginning [7]. Consider hiring local consultants who can bridge technical expertise with community values and lived experiences [1]. The ultimate goal is to redefine your organization’s role - from a centralized authority to a facilitator that empowers those closest to the ground-level impact [8].
Step 6: Create and Execute Action Plans
Choosing Which Actions to Take First
Turning data into action begins by focusing on assets with the highest vulnerability and the most severe risks [1][4]. Addressing cascading failures is critical - these are situations where the failure of one system triggers breakdowns across multiple sectors. For instance, if a telecommunications tower goes down during a disaster, it could disrupt emergency response efforts, healthcare coordination, and community communication simultaneously [1][4].
To make informed decisions, overlay climate-vulnerability maps with socioeconomic and environmental data. This helps identify "frontline" communities - areas facing overlapping challenges like pollution, poverty, and climate risks [3]. Use the vulnerabilities and equity gaps you’ve already mapped to guide your actions. Apply a Racial Equity Impact Assessment (REIA) to ensure fairness, as Race Forward advises:
"When racial equity is not consciously addressed, racial inequality is often unconsciously replicated" [2].
To evaluate potential actions, consider the STAPLEE framework, which examines interventions through seven lenses:
Social: Does it address the needs of marginalized groups?
Technical: Is it feasible over the long term?
Administrative: Can your team handle the workload?
Political: Is there community support?
Legal: Do you have the authority to implement it?
Economic: Is it financially viable?
Environmental: Does it protect natural systems? [20]
This method ensures your actions align with both community priorities and organizational capacity. Additionally, identify community "anchors" - existing spaces like community centers, faith-based organizations, or local parks - that could serve as hubs for resilience-building efforts [3].
Once priorities are set, the next step is to focus on tracking the outcomes of these actions.
Tracking Your Progress
The data you gathered earlier now serves as a baseline for measuring improvements. Effective monitoring requires the same level of community involvement as the initial assessment. As the Georgetown Climate Center highlights:
"To avoid the problem of reinforcing disparities, therefore, policymakers should pair the benefits of data-guided decisionmaking with substantive community engagement at each stage of the adaptation planning process" [3].
Use participatory tools like photovoice to capture community perspectives directly [3]. Set clear, measurable goals and benchmarks during the planning phase so you can evaluate the success of your interventions later [3]. For example, if you establish cooling centers for heatwaves, monitor both their usage rates and health outcomes to see if they effectively reduce heat-related illnesses. Combine quantitative data, such as census statistics and climate models, with qualitative insights from interviews and focus groups to build a well-rounded understanding of your impact [3].
Hold regular sessions that bring together staff, leaders, and community members to review data and refine strategies collaboratively [7]. Address the digital divide by investing in broadband access and devices for under-resourced residents. This creates direct feedback channels, enabling real-time input on the effectiveness of your actions [3]. By regularly engaging the community, you ensure the process remains dynamic and inclusive [12].
Conclusion
Vulnerability assessments and equity mapping empower NGOs and nonprofits to identify communities most at risk. By integrating quantitative data - such as census statistics and climate projections - with qualitative insights from residents, organizations gain a well-rounded understanding of local needs. This balanced approach avoids the pitfalls of top-down planning that can overlook the lived experiences of those directly affected.
The six-step process outlined in this guide transforms raw data into meaningful community action. By focusing on clear goals, assembling diverse teams, identifying hazards, mapping equity gaps, addressing power dynamics, and tracking progress, organizations ensure that their efforts are both inclusive and impactful. Incorporating Racial Equity Impact Assessments early on helps prevent the unintentional perpetuation of long-standing inequities [2]. These practices highlight the tangible benefits of combining data-driven methods with an equity-centered focus.
Research supports the effectiveness of these targeted strategies. By layering environmental hazard data with socioeconomic factors, nonprofits can pinpoint "frontline" communities - those bearing the brunt of overlapping challenges like pollution and poverty [3]. This precision enables resources to be directed where they are needed most, while ongoing monitoring ensures accountability and allows for adjustments as conditions evolve.
Achieving equity requires deliberate and sustained effort. By coupling technical analysis with meaningful community engagement at every stage, NGOs can transform vulnerability assessments from static documents into dynamic tools for fostering resilience and addressing disparities. This approach underscores the importance of maintaining a continuous focus on equity, ensuring that the methodology remains both relevant and impactful.
FAQs
How can NGOs engage communities effectively during vulnerability assessments?
To effectively connect with communities during vulnerability assessments, NGOs should focus on approaches that encourage participation and inclusivity. This means actively involving local residents through activities such as community meetings, focus groups, or participatory mapping. These hands-on methods not only give individuals a platform to share their insights but also help build a sense of shared responsibility for the outcomes.
Establishing trust and transparency is equally important. Clearly communicate the purpose and potential benefits of the assessment, and ensure the process respects local customs and traditions. Make a deliberate effort to include voices from marginalized groups, ensuring no one is left out. Demonstrating that their contributions are valued - by integrating their feedback into the final results - helps strengthen the partnership and fosters a collective sense of resilience.
True engagement goes beyond simply gathering input. It requires NGOs to embrace a range of perspectives and commit to building long-term relationships within the community. This deeper connection lays the groundwork for more equitable and impactful results.
What are the key tools for effective equity mapping in nonprofits?
Effective equity mapping in nonprofits relies on tools designed to uncover and address disparities while promoting inclusivity. One such resource is the Racial Equity Impact Assessment Toolkit, which helps evaluate how policies or actions affect various racial and ethnic groups. Additionally, detailed guides created by government agencies and nonprofit organizations highlight the importance of community involvement, integrating both quantitative and qualitative data, and factoring in historical and societal contexts to inform decision-making.
Other helpful tools include evaluation kits tailored to racial equity and inclusion, along with self-assessment materials that encourage organizations to reflect on power dynamics and refine their approaches. These resources empower nonprofits to make informed, data-based decisions, foster meaningful community connections, and work toward fairer outcomes.
How can vulnerability assessments help nonprofits allocate resources to support at-risk communities?
Vulnerability assessments play a crucial role for nonprofits by pinpointing the communities, assets, or groups that face the greatest risks from challenges such as climate events or other hazards. By examining factors like sensitivity and the ability to adapt, these assessments offer a clear understanding of where help is needed most. This allows organizations to direct their resources in a way that is both effective and fair.
By combining hard data with insights from the community, these assessments ensure that decisions align with local priorities and values. This inclusive approach helps prevent marginalized populations from being overlooked and encourages a more equitable allocation of resources. Targeting efforts toward the most at-risk areas not only strengthens resilience but also reduces inequalities, leading to outcomes that are both impactful and inclusive.
Related Blog Posts
How to Build a Climate Resilience Plan for NGOs & Nonprofits
How to Integrate Climate Risk into Infrastructure Planning for NGOs & Nonprofits
How to Conduct Vulnerability Assessment & Equity Mapping for Municipalities & Government Agencies
How to Conduct Vulnerability Assessment & Equity Mapping for Corporations
FAQ
What does it really mean to “redefine profit”?
What makes Council Fire different?
Who does Council Fire you work with?
What does working with Council Fire actually look like?
How does Council Fire help organizations turn big goals into action?
How does Council Fire define and measure success?