
Jan 24, 2026
How to Conduct Vulnerability Assessment & Equity Mapping for Municipalities & Government Agencies
Capacity Building
In This Article
Data-driven vulnerability assessments and equity mapping help municipalities target investments where climate hazards and social inequities overlap.
How to Conduct Vulnerability Assessment & Equity Mapping for Municipalities & Government Agencies
Vulnerability assessments and equity mapping help municipalities identify risks and address unequal access to resources. These methods combine data on hazards, infrastructure, and demographics to prioritize high-risk areas and underserved populations. By following a structured approach, agencies can:
Define Scope: Set clear goals and assemble a cross-sector team.
Collect Data: Use tools like FEMA's National Risk Index and census tract data to assess hazards and social vulnerabilities.
Analyze Risks: Map vulnerabilities by evaluating exposure, sensitivity, and recovery capacity.
Overlay Equity Data: Combine demographic insights with resource locations to pinpoint disparities.
Create Action Plans: Use findings to prioritize investments and engage stakeholders in decision-making.
This process ensures resources are allocated where they are needed most and strengthens planning for future challenges.
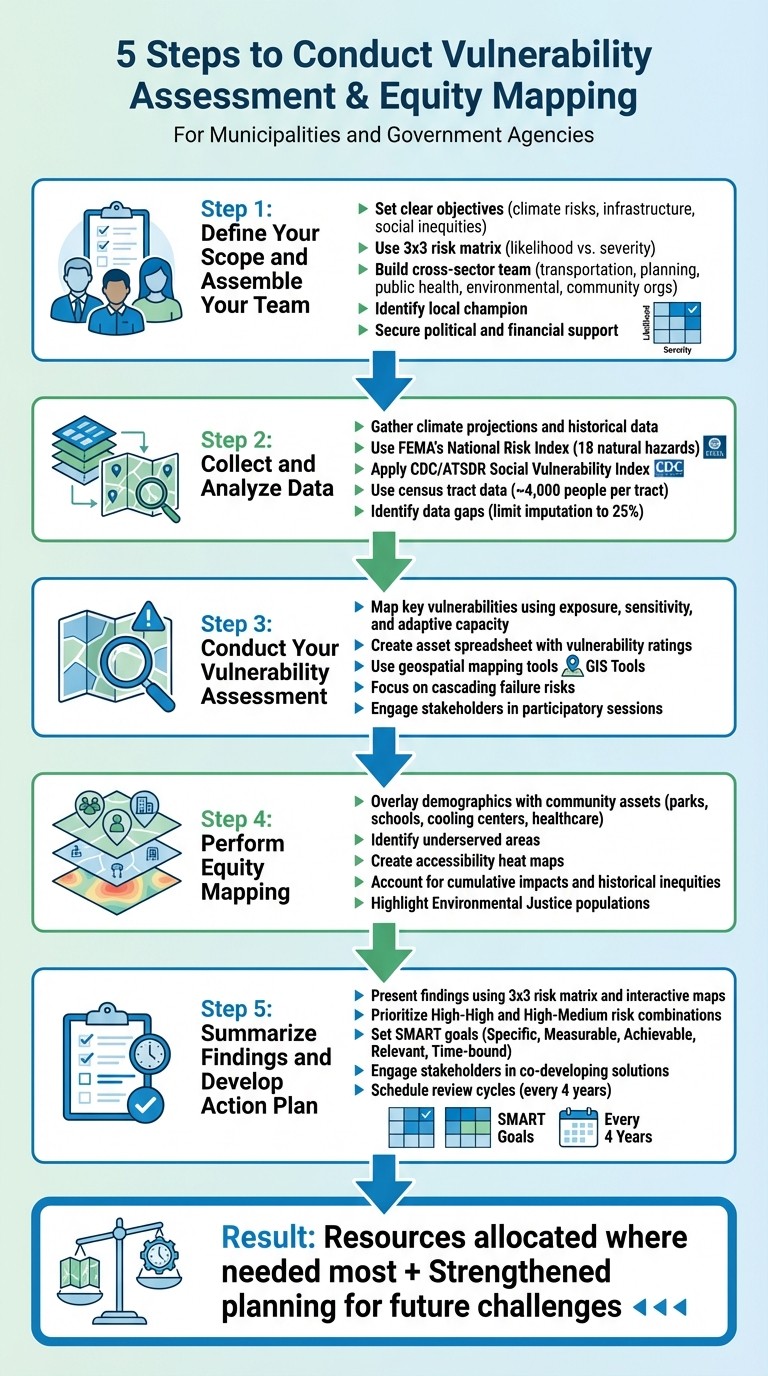
5-Step Vulnerability Assessment and Equity Mapping Process for Municipalities
Step 1: Define Your Scope and Assemble Your Team
Set Clear Objectives
Start by pinpointing your focus - whether it's addressing climate risks, identifying infrastructure vulnerabilities, or tackling social inequities. This clarity will help determine whether your approach should lean on qualitative screenings or dive into detailed, data-driven quantitative analyses. Begin by listing your assets alongside potential hazards, and evaluate each for vulnerability using a High, Medium, or Low rating system. A 3x3 risk matrix, which plots the likelihood of a hazard against the severity of its consequences, can be a valuable tool for zeroing in on areas of greatest concern [2].
Pay special attention to cascading failures, where damage to critical assets could ripple across multiple sectors. For instance, a heavily trafficked bridge or a key telecommunications system could, if compromised, trigger widespread disruptions. With your objectives clearly defined and initial screenings completed, the next step is to assemble a team with the right mix of expertise.
Build a Cross-Sector Team
Gather a team that brings together a variety of perspectives and skills. Include representatives from state transportation, urban planning, public health, environmental regulation, community organizations, and local leadership. Technical experts who can analyze spatial data or assess property values should also be part of the team, alongside utility managers responsible for vital services like water systems.
"Professionals who fill these roles still need plenty of input from the local champion and team, but they can help groups navigate unfamiliar concepts and document the most pressing potential climate problems in your community." - U.S. Climate Resilience Toolkit [2]
A key player in this effort is the local champion - an internal leader who acts as a bridge between the diverse team and any external consultants. This person ensures the assessment aligns with the community's unique needs. Additionally, forming partnerships with neighboring counties can improve the quality of the assessment and allow for resource sharing [2]. With your team in place and local champions ready, the next priority is to secure the necessary political and financial backing.
Secure Political and Financial Support
Gaining the support of decision-makers is essential for moving forward. Use clear, compelling visuals, such as maps highlighting high-risk areas, to communicate the risks effectively. Tools like FEMA's National Risk Index offer a standardized way to compare a community's exposure to 18 different natural hazards.
Cities and municipalities often rely on architecture and engineering firms or climate adaptation consultants to document challenges and secure funding. Start with a qualitative assessment to identify key priorities before committing resources to more detailed quantitative studies. Striking a balance between technical climate data and the values of the community is critical to maintaining both public and political support throughout the process [2]. These efforts lay the groundwork for linking risk assessments to actionable, equitable plans.
Equitable Engagement with Underserved Communities
Step 2: Collect and Analyze Data
Thorough data collection is the foundation of any meaningful vulnerability and equity assessment. By combining information on climate hazards, infrastructure, and social factors, you can pinpoint where risks and inequities intersect, ensuring resources are allocated effectively.
Gather Geographic and Climate Data
Start by collecting historical data and downscaled climate projections to understand how risks may evolve over time [5][6]. Tools like the Climate Mapping for Resilience and Adaptation (CMRA) offer localized projections from global climate models, showing how exposure to five major climate hazards may shift throughout the century [4]. Similarly, FEMA’s National Risk Index provides insights into 18 natural hazards across the United States, helping you compare risks at a regional scale [2].
Pair this climate data with baseline infrastructure metrics, such as transportation systems, energy grids, water and waste management networks, and critical facilities like hospitals and schools [5][6]. Vulnerability is shaped by three key factors: exposure, sensitivity, and adaptive capacity [2]. To capture local nuances, use census tract data, which typically represents about 4,000 people, rather than broader county-level statistics [6].
To deepen the analysis, integrate social vulnerability data using established indices.
Use Social Vulnerability Indices
Leverage tools like the CDC/ATSDR Social Vulnerability Index (SVI), U.S. Census Bureau data, and the U.S. Climate Vulnerability Index (CVI) to assess community risks. These tools consider factors such as income levels, racial demographics, health conditions, and more. For instance, the CVI draws on over 200 datasets, narrowing them down to 184 indicators to evaluate community vulnerability [6].
"Census tracts also allow for sufficient granularity to understand hyperlocal differences within urban areas whereas county level data is too broad to identify drivers of vulnerability and where targeted benefits and resources should be directed." - U.S. Climate Vulnerability Index [6]
Enhance your analysis by layering climate hazard data with social indicators like redlining histories, crime rates, and housing conditions. This approach highlights communities facing compounded risks, offering a clearer picture of where resources should be directed to address long-standing disparities [6].
Once you’ve combined these data layers, assess any gaps in your dataset.
Identify Data Gaps
Identifying and addressing data gaps is critical to ensure a comprehensive analysis. If gaps emerge, consider using crosswalks or median values from larger areas, limiting imputation to no more than 25% [6]. Collaborate with environmental justice organizations to identify indicators that reflect lived experiences and structural investment needs - factors that standard datasets may overlook [6].
In cases where quantitative data is unavailable or overly complex, qualitative methods can serve as a starting point. Use expert input and initial screenings to categorize vulnerability and risk as high, medium, or low [2][3]. Before incorporating any dataset, review it for distribution and variability, and exclude those with excessive missing or uniform values [6].
Step 3: Conduct Your Vulnerability Assessment
Take a deep dive into your data to pinpoint which populations and assets face the highest risks. Using the scope and data you've already gathered, assess vulnerabilities by examining how asset exposure intersects with sensitivity and the ability to adapt or recover. This step zeroes in on two key aspects: sensitivity (the degree to which an asset is impacted by a hazard) and adaptive capacity (the ability to adjust or bounce back). Together, these factors shape the overall vulnerability of an asset [2][3].
Map Key Vulnerabilities
Start by organizing your findings in a clear and systematic way. Create a spreadsheet that lists each asset alongside columns for Potential Impact, Sensitivity, Adaptive Capacity, and overall Vulnerability. This structured approach makes it easier to identify which asset-hazard combinations require immediate attention.
Geospatial mapping can add another layer of insight. Use accessible mapping tools to visualize areas where risks are concentrated. These maps can help decision-makers spot patterns and focus on critical vulnerabilities. Pay special attention to assets whose failure could lead to cascading disruptions - think major bridges or telecommunications systems [2].
"Stay focused on assets that are most vulnerable and at risk." - U.S. Climate Resilience Toolkit [2]
To further prioritize, use a 3x3 risk matrix. This tool plots hazard probability against the magnitude of consequences, helping you focus on the most pressing asset-hazard combinations. Target resources toward those that fall into the "High-High" or "High-Medium" categories [2][3].
Engage Stakeholders in Analysis
Numbers alone don't tell the whole story. To get a complete picture, involve the community. Host participatory sessions with residents, local business owners, and community groups. These discussions can validate your findings and uncover insights that raw data might miss.
"To work in a real community, this quantitative information about physical assets needs to be complemented by social awareness and a commitment to serve the entire community." - U.S. Climate Resilience Toolkit [3]
Bring your risk matrix to these sessions to guide the conversation. Ask participants to identify the assets they rely on and share whether your technical analysis aligns with their daily experiences [2][3]. Local champions can play a key role here, bridging the gap between the data-driven analysis and the community’s lived realities. Their input ensures your priorities reflect not just statistics but the actual needs and values of those affected [2][3].
Step 4: Perform Equity Mapping
Once your vulnerability assessment is complete, the next step is to identify disparities in access to resources. Equity mapping helps uncover patterns of inequality by combining demographic data with spatial information. This approach adds depth to your vulnerability analysis, highlighting how unequal access to essential resources amplifies risks. By visualizing these disparities, you can pinpoint where investments are most urgently needed.
Overlay Demographics with Community Assets
Begin by layering demographic data over maps of community assets. Use GIS tools to chart the locations of parks, schools, cooling centers, healthcare facilities, and drinking water access points alongside demographic indicators such as income levels, racial composition, age distribution, and English language proficiency. This process builds on your vulnerability data, making it easier to see where gaps in resource access exacerbate risks. For instance, this overlay can quickly show whether vulnerable populations are situated near - or far from - critical resources [2][3][8].
A real-world example comes from the Massachusetts Executive Office of Energy and Environmental Affairs, which updated its Environmental Justice Map Viewer in 2022. Using 2020 Census block group data and 2019 American Community Survey information, the tool identifies areas where the annual median household income is 65% or less of the statewide median or where minorities make up at least 40% of the population. State agencies now rely on this map to locate neighborhoods disproportionately affected by environmental pollution or lacking access to open spaces and recreational facilities [1].
Identify Underserved Areas
The next step is to pinpoint neighborhoods with significant resource deficits. These are areas where barriers like low income, language isolation, or limited healthcare access prevent residents from meeting basic needs. Massachusetts, for example, defines language isolation in census tracts where at least 5% of the population reports not speaking English "very well" [1]. Identifying such areas sheds light on not just physical distance to resources but also systemic barriers that hinder equitable access.
A notable example comes from Maricopa County Public Health, which partnered with Arizona State University in 2015 to map cooling centers against heat-related mortality data among homeless populations. Using National Climate Assessment data, the project identified gaps in public health interventions designed to protect those most at risk from extreme heat - currently the leading cause of heat-related deaths in the U.S. [8].
Create Accessibility Heat Maps
Building on this analysis, create heat maps to transform complex data into clear, actionable visuals. These maps can use web-accessible layers to highlight areas where social risks are highest and where hazards overlap with vulnerable populations [2][3]. Heat maps make it easy to spot "cold spots" - locations where essential resources are absent.
"Data and mapping tools enable policymakers to identify and prioritize these communities and develop planning interventions to mitigate the risks that additional environmental stresses may place on already burdened communities." - Georgetown Climate Center [8]
Your heat maps should also account for cumulative impacts, such as historical environmental violations and prolonged exposure to toxins, which often disproportionately affect low-income communities of color [8]. By incorporating both immediate needs and long-term inequities, these maps provide a comprehensive foundation for targeted action plans.
Step 5: Summarize Findings and Develop an Action Plan
After creating your vulnerability and equity maps, the next step is to translate that data into practical, results-driven plans.
Present Vulnerability and Equity Findings
Compile your assessment data into concise, actionable reports that decision-makers can immediately use. One effective way to present this is by utilizing a 3x3 risk matrix within a spreadsheet. This matrix plots the "Probability of Hazard" against the "Magnitude of Consequence", helping to pinpoint high-risk asset-hazard pairs that require urgent attention [2]. To complement this, interactive geospatial maps can provide localized insights. These maps allow stakeholders to drill down into specific census tracts to view details such as income levels, minority population percentages, and language proficiency data [1][2].
When sharing equity findings, overlay demographic data on these hazard maps to spotlight Environmental Justice populations using well-established criteria [1].
Prioritize Actions for High-Impact Areas
Direct your initial focus to asset-hazard pairs that fall into the "High-High" or "High-Medium" categories on the risk matrix [2]. To maintain consistency, establish clear probability rules. For instance, classify "High" as events likely to occur within five years, "Medium" as those expected once in 5–20 years, and "Low" as those occurring less than once every 20 years [2]. This ensures that everyone involved interprets risk consistently.
Pay special attention to assets where potential damage could lead to widespread disruptions across multiple sectors. Examples include telecommunications hubs or critical transportation infrastructure like heavily used bridges [2]. Combine technical insights with community priorities by identifying both immediate actions - such as emergency response upgrades or urgent infrastructure repairs - and longer-term strategies like zoning updates or green infrastructure projects to address deeper vulnerabilities and inequities.
Once these priorities are outlined, work collaboratively with stakeholders to refine them further.
Engage Stakeholders for Implementation
Effective action plans rely on the input and involvement of those directly impacted. Host workshops to co-develop solutions with stakeholders, ensuring their perspectives shape the plan. Early engagement helps fill data gaps, incorporates diverse local knowledge, and builds trust in your recommendations [9]. Include representatives from health departments, civil protection agencies, utilities, planning offices, and finance departments to ensure a well-rounded approach [9].
"Involving stakeholders in co-defining these goals ensures they reflect community priorities and create a solid foundation for monitoring progress." - weADAPT Knowledge Manager [9]
Set SMART goals - Specific, Measurable, Achievable, Relevant, and Time-bound - to effectively track progress [9]. When presenting your plan, emphasize co-benefits to gain public support. To keep the plan on track, consider appointing an adaptation officer to oversee the multidisciplinary team and ensure alignment with broader policy objectives [9]. Lastly, schedule regular review cycles, ideally every four years, to incorporate new climate data and adapt to changing socio-economic conditions, ensuring your action plan remains a dynamic tool for building resilience [9].
How Council Fire Supports Implementation

Turning assessments into actionable strategies requires both technical know-how and a deep understanding of community needs. Council Fire's consulting services bridge these two areas, helping municipalities navigate intricate risk management systems while keeping local priorities front and center. Their tailored approach ensures that data and community goals align seamlessly.
Work with Council Fire's Consulting Services
Council Fire blends data-driven analysis with stakeholder-focused planning, helping teams address climate challenges through detailed geospatial insights. This shift from broad risk categories to specific spatial data makes it easier to justify resource allocation and establish clear priorities.
"Some groups hire consultants to be sure climate considerations are balanced with community values." - U.S. Climate Resilience Toolkit [2]
By collaborating with internal teams and local advocates, Council Fire identifies critical assets whose failure could disrupt multiple sectors [2]. This focus ensures that investments are directed toward initiatives that strengthen resilience across the entire community.
Achieve Fair Resource Allocation
Council Fire also integrates climate resilience with social vulnerability data to ensure equitable resource distribution. Their approach embeds resilience strategies into official plans, making municipalities eligible for federal and state funding programs [7]. This process transforms assessment results into actionable steps that promote fairness in resource allocation.
"To work in a real community, this quantitative information about physical assets needs to be complemented by social awareness and a commitment to serve the entire community." - U.S. Climate Resilience Toolkit [2]
Using tools like risk matrices and standardized rule sets, Council Fire helps municipalities objectively assess hazards, such as identifying high-probability events likely to occur within five years [2]. This transparent process builds trust among stakeholders and ensures that resources are directed to underserved areas. Through collaborative partnerships and systems thinking, Council Fire turns sustainability goals into measurable progress, delivering lasting benefits for the environment, society, and local economies.
Conclusion
Vulnerability assessments and equity mapping equip municipalities with the tools to build stronger, more inclusive communities. By leveraging precise geospatial data, these methods take the guesswork out of decision-making and help set clear priorities for action [2].
The true impact of these tools goes beyond numbers - they blend technical accuracy with an understanding of social needs. While data identifies risks to critical infrastructure, the ultimate goal is to ensure that every community member, especially those in underserved areas, receives the resources necessary to face climate-related challenges [2].
Focusing on key assets can prevent widespread disruptions. For example, protecting a single bridge or telecommunications hub can safeguard entire regional systems from cascading failures [2].
Incorporating vulnerability assessments into planning documents not only strengthens preparedness but also opens doors to federal and state funding opportunities [7]. By using tools like risk matrices to assess the likelihood and consequences of potential hazards, decision-makers create transparent strategies that foster trust and justify investments in areas with the greatest impact [2].
This approach to data-driven decision-making does more than manage risks - it builds communities where safety and opportunity are accessible to all. By ensuring resources are allocated fairly and systematically, these methods enable leaders to direct funding to the areas that need it most. Embedding vulnerability assessments and equity mapping into regular planning cycles lays the groundwork for resilience that supports both the environment and the people who live there.
FAQs
What are the benefits of vulnerability assessments and equity mapping for local governments?
Vulnerability assessments and equity mapping provide local governments with critical insights into which communities face the greatest risks from social, environmental, and climate-related challenges. By identifying these at-risk areas, municipalities can direct resources more efficiently to ensure help reaches those who need it most. This targeted approach not only addresses disparities but also supports more balanced and thoughtful decision-making.
These tools also empower governments to design resilience strategies that are both inclusive and community-centered. By understanding the unique needs of various populations, policymakers can create initiatives that strengthen social connections, improve access to vital resources, and enhance readiness for future challenges. Together, these efforts contribute to building communities that are stronger, more connected, and better equipped to thrive in the face of adversity.
How can municipalities involve communities in vulnerability assessments effectively?
Municipalities looking to involve communities in vulnerability assessments should focus on inclusive and participatory methods. Start by bringing together a wide range of stakeholders, particularly those most impacted by social and environmental challenges. Offer accessible ways for people to share their input - whether through community forums, surveys, or workshops - and address barriers like language differences, lack of transportation, or community mistrust to ensure everyone has a chance to participate.
To make the process equitable, tailor efforts to meet the specific needs of the community and prioritize open, transparent communication to build trust. Involving residents early and maintaining consistent dialogue fosters a sense of shared ownership over the results. Collaborating with local organizations and tapping into existing networks can further improve outreach and ensure a variety of perspectives are represented. These steps create a collaborative environment that supports fair and effective decision-making.
What are the key tools and data sources needed for effective equity mapping?
To carry out meaningful equity mapping, it's essential to combine trusted data sources with robust analytical tools that can pinpoint vulnerable communities and address existing inequalities. Demographic and geographic data, such as census information, provide a foundation for understanding the makeup of a community. Similarly, environmental health data, like maps showing pollution levels or health outcomes, can reveal areas where risks are disproportionately higher. Climate hazard assessments also play a vital role, offering insight into vulnerabilities tied to natural disasters or extreme weather events.
Equally important are the tools used to analyze and visualize this data. These tools turn raw figures into clear, actionable insights, helping to identify patterns and allocate resources where they're needed most. Collaborating with local communities is another critical step, ensuring that the data reflects real-world experiences and doesn't miss key priorities. When combined, these elements create a strong framework for equitable decision-making and help tackle disparities more effectively.
Related Blog Posts
Latest Articles
©2025


FAQ
01
What does it really mean to “redefine profit”?
02
What makes Council Fire different?
03
Who does Council Fire you work with?
04
What does working with Council Fire actually look like?
05
How does Council Fire help organizations turn big goals into action?
06
How does Council Fire define and measure success?
Jan 24, 2026
How to Conduct Vulnerability Assessment & Equity Mapping for Municipalities & Government Agencies
Capacity Building
In This Article
Data-driven vulnerability assessments and equity mapping help municipalities target investments where climate hazards and social inequities overlap.
How to Conduct Vulnerability Assessment & Equity Mapping for Municipalities & Government Agencies
Vulnerability assessments and equity mapping help municipalities identify risks and address unequal access to resources. These methods combine data on hazards, infrastructure, and demographics to prioritize high-risk areas and underserved populations. By following a structured approach, agencies can:
Define Scope: Set clear goals and assemble a cross-sector team.
Collect Data: Use tools like FEMA's National Risk Index and census tract data to assess hazards and social vulnerabilities.
Analyze Risks: Map vulnerabilities by evaluating exposure, sensitivity, and recovery capacity.
Overlay Equity Data: Combine demographic insights with resource locations to pinpoint disparities.
Create Action Plans: Use findings to prioritize investments and engage stakeholders in decision-making.
This process ensures resources are allocated where they are needed most and strengthens planning for future challenges.
5-Step Vulnerability Assessment and Equity Mapping Process for Municipalities
Step 1: Define Your Scope and Assemble Your Team
Set Clear Objectives
Start by pinpointing your focus - whether it's addressing climate risks, identifying infrastructure vulnerabilities, or tackling social inequities. This clarity will help determine whether your approach should lean on qualitative screenings or dive into detailed, data-driven quantitative analyses. Begin by listing your assets alongside potential hazards, and evaluate each for vulnerability using a High, Medium, or Low rating system. A 3x3 risk matrix, which plots the likelihood of a hazard against the severity of its consequences, can be a valuable tool for zeroing in on areas of greatest concern [2].
Pay special attention to cascading failures, where damage to critical assets could ripple across multiple sectors. For instance, a heavily trafficked bridge or a key telecommunications system could, if compromised, trigger widespread disruptions. With your objectives clearly defined and initial screenings completed, the next step is to assemble a team with the right mix of expertise.
Build a Cross-Sector Team
Gather a team that brings together a variety of perspectives and skills. Include representatives from state transportation, urban planning, public health, environmental regulation, community organizations, and local leadership. Technical experts who can analyze spatial data or assess property values should also be part of the team, alongside utility managers responsible for vital services like water systems.
"Professionals who fill these roles still need plenty of input from the local champion and team, but they can help groups navigate unfamiliar concepts and document the most pressing potential climate problems in your community." - U.S. Climate Resilience Toolkit [2]
A key player in this effort is the local champion - an internal leader who acts as a bridge between the diverse team and any external consultants. This person ensures the assessment aligns with the community's unique needs. Additionally, forming partnerships with neighboring counties can improve the quality of the assessment and allow for resource sharing [2]. With your team in place and local champions ready, the next priority is to secure the necessary political and financial backing.
Secure Political and Financial Support
Gaining the support of decision-makers is essential for moving forward. Use clear, compelling visuals, such as maps highlighting high-risk areas, to communicate the risks effectively. Tools like FEMA's National Risk Index offer a standardized way to compare a community's exposure to 18 different natural hazards.
Cities and municipalities often rely on architecture and engineering firms or climate adaptation consultants to document challenges and secure funding. Start with a qualitative assessment to identify key priorities before committing resources to more detailed quantitative studies. Striking a balance between technical climate data and the values of the community is critical to maintaining both public and political support throughout the process [2]. These efforts lay the groundwork for linking risk assessments to actionable, equitable plans.
Equitable Engagement with Underserved Communities
Step 2: Collect and Analyze Data
Thorough data collection is the foundation of any meaningful vulnerability and equity assessment. By combining information on climate hazards, infrastructure, and social factors, you can pinpoint where risks and inequities intersect, ensuring resources are allocated effectively.
Gather Geographic and Climate Data
Start by collecting historical data and downscaled climate projections to understand how risks may evolve over time [5][6]. Tools like the Climate Mapping for Resilience and Adaptation (CMRA) offer localized projections from global climate models, showing how exposure to five major climate hazards may shift throughout the century [4]. Similarly, FEMA’s National Risk Index provides insights into 18 natural hazards across the United States, helping you compare risks at a regional scale [2].
Pair this climate data with baseline infrastructure metrics, such as transportation systems, energy grids, water and waste management networks, and critical facilities like hospitals and schools [5][6]. Vulnerability is shaped by three key factors: exposure, sensitivity, and adaptive capacity [2]. To capture local nuances, use census tract data, which typically represents about 4,000 people, rather than broader county-level statistics [6].
To deepen the analysis, integrate social vulnerability data using established indices.
Use Social Vulnerability Indices
Leverage tools like the CDC/ATSDR Social Vulnerability Index (SVI), U.S. Census Bureau data, and the U.S. Climate Vulnerability Index (CVI) to assess community risks. These tools consider factors such as income levels, racial demographics, health conditions, and more. For instance, the CVI draws on over 200 datasets, narrowing them down to 184 indicators to evaluate community vulnerability [6].
"Census tracts also allow for sufficient granularity to understand hyperlocal differences within urban areas whereas county level data is too broad to identify drivers of vulnerability and where targeted benefits and resources should be directed." - U.S. Climate Vulnerability Index [6]
Enhance your analysis by layering climate hazard data with social indicators like redlining histories, crime rates, and housing conditions. This approach highlights communities facing compounded risks, offering a clearer picture of where resources should be directed to address long-standing disparities [6].
Once you’ve combined these data layers, assess any gaps in your dataset.
Identify Data Gaps
Identifying and addressing data gaps is critical to ensure a comprehensive analysis. If gaps emerge, consider using crosswalks or median values from larger areas, limiting imputation to no more than 25% [6]. Collaborate with environmental justice organizations to identify indicators that reflect lived experiences and structural investment needs - factors that standard datasets may overlook [6].
In cases where quantitative data is unavailable or overly complex, qualitative methods can serve as a starting point. Use expert input and initial screenings to categorize vulnerability and risk as high, medium, or low [2][3]. Before incorporating any dataset, review it for distribution and variability, and exclude those with excessive missing or uniform values [6].
Step 3: Conduct Your Vulnerability Assessment
Take a deep dive into your data to pinpoint which populations and assets face the highest risks. Using the scope and data you've already gathered, assess vulnerabilities by examining how asset exposure intersects with sensitivity and the ability to adapt or recover. This step zeroes in on two key aspects: sensitivity (the degree to which an asset is impacted by a hazard) and adaptive capacity (the ability to adjust or bounce back). Together, these factors shape the overall vulnerability of an asset [2][3].
Map Key Vulnerabilities
Start by organizing your findings in a clear and systematic way. Create a spreadsheet that lists each asset alongside columns for Potential Impact, Sensitivity, Adaptive Capacity, and overall Vulnerability. This structured approach makes it easier to identify which asset-hazard combinations require immediate attention.
Geospatial mapping can add another layer of insight. Use accessible mapping tools to visualize areas where risks are concentrated. These maps can help decision-makers spot patterns and focus on critical vulnerabilities. Pay special attention to assets whose failure could lead to cascading disruptions - think major bridges or telecommunications systems [2].
"Stay focused on assets that are most vulnerable and at risk." - U.S. Climate Resilience Toolkit [2]
To further prioritize, use a 3x3 risk matrix. This tool plots hazard probability against the magnitude of consequences, helping you focus on the most pressing asset-hazard combinations. Target resources toward those that fall into the "High-High" or "High-Medium" categories [2][3].
Engage Stakeholders in Analysis
Numbers alone don't tell the whole story. To get a complete picture, involve the community. Host participatory sessions with residents, local business owners, and community groups. These discussions can validate your findings and uncover insights that raw data might miss.
"To work in a real community, this quantitative information about physical assets needs to be complemented by social awareness and a commitment to serve the entire community." - U.S. Climate Resilience Toolkit [3]
Bring your risk matrix to these sessions to guide the conversation. Ask participants to identify the assets they rely on and share whether your technical analysis aligns with their daily experiences [2][3]. Local champions can play a key role here, bridging the gap between the data-driven analysis and the community’s lived realities. Their input ensures your priorities reflect not just statistics but the actual needs and values of those affected [2][3].
Step 4: Perform Equity Mapping
Once your vulnerability assessment is complete, the next step is to identify disparities in access to resources. Equity mapping helps uncover patterns of inequality by combining demographic data with spatial information. This approach adds depth to your vulnerability analysis, highlighting how unequal access to essential resources amplifies risks. By visualizing these disparities, you can pinpoint where investments are most urgently needed.
Overlay Demographics with Community Assets
Begin by layering demographic data over maps of community assets. Use GIS tools to chart the locations of parks, schools, cooling centers, healthcare facilities, and drinking water access points alongside demographic indicators such as income levels, racial composition, age distribution, and English language proficiency. This process builds on your vulnerability data, making it easier to see where gaps in resource access exacerbate risks. For instance, this overlay can quickly show whether vulnerable populations are situated near - or far from - critical resources [2][3][8].
A real-world example comes from the Massachusetts Executive Office of Energy and Environmental Affairs, which updated its Environmental Justice Map Viewer in 2022. Using 2020 Census block group data and 2019 American Community Survey information, the tool identifies areas where the annual median household income is 65% or less of the statewide median or where minorities make up at least 40% of the population. State agencies now rely on this map to locate neighborhoods disproportionately affected by environmental pollution or lacking access to open spaces and recreational facilities [1].
Identify Underserved Areas
The next step is to pinpoint neighborhoods with significant resource deficits. These are areas where barriers like low income, language isolation, or limited healthcare access prevent residents from meeting basic needs. Massachusetts, for example, defines language isolation in census tracts where at least 5% of the population reports not speaking English "very well" [1]. Identifying such areas sheds light on not just physical distance to resources but also systemic barriers that hinder equitable access.
A notable example comes from Maricopa County Public Health, which partnered with Arizona State University in 2015 to map cooling centers against heat-related mortality data among homeless populations. Using National Climate Assessment data, the project identified gaps in public health interventions designed to protect those most at risk from extreme heat - currently the leading cause of heat-related deaths in the U.S. [8].
Create Accessibility Heat Maps
Building on this analysis, create heat maps to transform complex data into clear, actionable visuals. These maps can use web-accessible layers to highlight areas where social risks are highest and where hazards overlap with vulnerable populations [2][3]. Heat maps make it easy to spot "cold spots" - locations where essential resources are absent.
"Data and mapping tools enable policymakers to identify and prioritize these communities and develop planning interventions to mitigate the risks that additional environmental stresses may place on already burdened communities." - Georgetown Climate Center [8]
Your heat maps should also account for cumulative impacts, such as historical environmental violations and prolonged exposure to toxins, which often disproportionately affect low-income communities of color [8]. By incorporating both immediate needs and long-term inequities, these maps provide a comprehensive foundation for targeted action plans.
Step 5: Summarize Findings and Develop an Action Plan
After creating your vulnerability and equity maps, the next step is to translate that data into practical, results-driven plans.
Present Vulnerability and Equity Findings
Compile your assessment data into concise, actionable reports that decision-makers can immediately use. One effective way to present this is by utilizing a 3x3 risk matrix within a spreadsheet. This matrix plots the "Probability of Hazard" against the "Magnitude of Consequence", helping to pinpoint high-risk asset-hazard pairs that require urgent attention [2]. To complement this, interactive geospatial maps can provide localized insights. These maps allow stakeholders to drill down into specific census tracts to view details such as income levels, minority population percentages, and language proficiency data [1][2].
When sharing equity findings, overlay demographic data on these hazard maps to spotlight Environmental Justice populations using well-established criteria [1].
Prioritize Actions for High-Impact Areas
Direct your initial focus to asset-hazard pairs that fall into the "High-High" or "High-Medium" categories on the risk matrix [2]. To maintain consistency, establish clear probability rules. For instance, classify "High" as events likely to occur within five years, "Medium" as those expected once in 5–20 years, and "Low" as those occurring less than once every 20 years [2]. This ensures that everyone involved interprets risk consistently.
Pay special attention to assets where potential damage could lead to widespread disruptions across multiple sectors. Examples include telecommunications hubs or critical transportation infrastructure like heavily used bridges [2]. Combine technical insights with community priorities by identifying both immediate actions - such as emergency response upgrades or urgent infrastructure repairs - and longer-term strategies like zoning updates or green infrastructure projects to address deeper vulnerabilities and inequities.
Once these priorities are outlined, work collaboratively with stakeholders to refine them further.
Engage Stakeholders for Implementation
Effective action plans rely on the input and involvement of those directly impacted. Host workshops to co-develop solutions with stakeholders, ensuring their perspectives shape the plan. Early engagement helps fill data gaps, incorporates diverse local knowledge, and builds trust in your recommendations [9]. Include representatives from health departments, civil protection agencies, utilities, planning offices, and finance departments to ensure a well-rounded approach [9].
"Involving stakeholders in co-defining these goals ensures they reflect community priorities and create a solid foundation for monitoring progress." - weADAPT Knowledge Manager [9]
Set SMART goals - Specific, Measurable, Achievable, Relevant, and Time-bound - to effectively track progress [9]. When presenting your plan, emphasize co-benefits to gain public support. To keep the plan on track, consider appointing an adaptation officer to oversee the multidisciplinary team and ensure alignment with broader policy objectives [9]. Lastly, schedule regular review cycles, ideally every four years, to incorporate new climate data and adapt to changing socio-economic conditions, ensuring your action plan remains a dynamic tool for building resilience [9].
How Council Fire Supports Implementation
Turning assessments into actionable strategies requires both technical know-how and a deep understanding of community needs. Council Fire's consulting services bridge these two areas, helping municipalities navigate intricate risk management systems while keeping local priorities front and center. Their tailored approach ensures that data and community goals align seamlessly.
Work with Council Fire's Consulting Services
Council Fire blends data-driven analysis with stakeholder-focused planning, helping teams address climate challenges through detailed geospatial insights. This shift from broad risk categories to specific spatial data makes it easier to justify resource allocation and establish clear priorities.
"Some groups hire consultants to be sure climate considerations are balanced with community values." - U.S. Climate Resilience Toolkit [2]
By collaborating with internal teams and local advocates, Council Fire identifies critical assets whose failure could disrupt multiple sectors [2]. This focus ensures that investments are directed toward initiatives that strengthen resilience across the entire community.
Achieve Fair Resource Allocation
Council Fire also integrates climate resilience with social vulnerability data to ensure equitable resource distribution. Their approach embeds resilience strategies into official plans, making municipalities eligible for federal and state funding programs [7]. This process transforms assessment results into actionable steps that promote fairness in resource allocation.
"To work in a real community, this quantitative information about physical assets needs to be complemented by social awareness and a commitment to serve the entire community." - U.S. Climate Resilience Toolkit [2]
Using tools like risk matrices and standardized rule sets, Council Fire helps municipalities objectively assess hazards, such as identifying high-probability events likely to occur within five years [2]. This transparent process builds trust among stakeholders and ensures that resources are directed to underserved areas. Through collaborative partnerships and systems thinking, Council Fire turns sustainability goals into measurable progress, delivering lasting benefits for the environment, society, and local economies.
Conclusion
Vulnerability assessments and equity mapping equip municipalities with the tools to build stronger, more inclusive communities. By leveraging precise geospatial data, these methods take the guesswork out of decision-making and help set clear priorities for action [2].
The true impact of these tools goes beyond numbers - they blend technical accuracy with an understanding of social needs. While data identifies risks to critical infrastructure, the ultimate goal is to ensure that every community member, especially those in underserved areas, receives the resources necessary to face climate-related challenges [2].
Focusing on key assets can prevent widespread disruptions. For example, protecting a single bridge or telecommunications hub can safeguard entire regional systems from cascading failures [2].
Incorporating vulnerability assessments into planning documents not only strengthens preparedness but also opens doors to federal and state funding opportunities [7]. By using tools like risk matrices to assess the likelihood and consequences of potential hazards, decision-makers create transparent strategies that foster trust and justify investments in areas with the greatest impact [2].
This approach to data-driven decision-making does more than manage risks - it builds communities where safety and opportunity are accessible to all. By ensuring resources are allocated fairly and systematically, these methods enable leaders to direct funding to the areas that need it most. Embedding vulnerability assessments and equity mapping into regular planning cycles lays the groundwork for resilience that supports both the environment and the people who live there.
FAQs
What are the benefits of vulnerability assessments and equity mapping for local governments?
Vulnerability assessments and equity mapping provide local governments with critical insights into which communities face the greatest risks from social, environmental, and climate-related challenges. By identifying these at-risk areas, municipalities can direct resources more efficiently to ensure help reaches those who need it most. This targeted approach not only addresses disparities but also supports more balanced and thoughtful decision-making.
These tools also empower governments to design resilience strategies that are both inclusive and community-centered. By understanding the unique needs of various populations, policymakers can create initiatives that strengthen social connections, improve access to vital resources, and enhance readiness for future challenges. Together, these efforts contribute to building communities that are stronger, more connected, and better equipped to thrive in the face of adversity.
How can municipalities involve communities in vulnerability assessments effectively?
Municipalities looking to involve communities in vulnerability assessments should focus on inclusive and participatory methods. Start by bringing together a wide range of stakeholders, particularly those most impacted by social and environmental challenges. Offer accessible ways for people to share their input - whether through community forums, surveys, or workshops - and address barriers like language differences, lack of transportation, or community mistrust to ensure everyone has a chance to participate.
To make the process equitable, tailor efforts to meet the specific needs of the community and prioritize open, transparent communication to build trust. Involving residents early and maintaining consistent dialogue fosters a sense of shared ownership over the results. Collaborating with local organizations and tapping into existing networks can further improve outreach and ensure a variety of perspectives are represented. These steps create a collaborative environment that supports fair and effective decision-making.
What are the key tools and data sources needed for effective equity mapping?
To carry out meaningful equity mapping, it's essential to combine trusted data sources with robust analytical tools that can pinpoint vulnerable communities and address existing inequalities. Demographic and geographic data, such as census information, provide a foundation for understanding the makeup of a community. Similarly, environmental health data, like maps showing pollution levels or health outcomes, can reveal areas where risks are disproportionately higher. Climate hazard assessments also play a vital role, offering insight into vulnerabilities tied to natural disasters or extreme weather events.
Equally important are the tools used to analyze and visualize this data. These tools turn raw figures into clear, actionable insights, helping to identify patterns and allocate resources where they're needed most. Collaborating with local communities is another critical step, ensuring that the data reflects real-world experiences and doesn't miss key priorities. When combined, these elements create a strong framework for equitable decision-making and help tackle disparities more effectively.
Related Blog Posts
FAQ
What does it really mean to “redefine profit”?
What makes Council Fire different?
Who does Council Fire you work with?
What does working with Council Fire actually look like?
How does Council Fire help organizations turn big goals into action?
How does Council Fire define and measure success?