
Oct 1, 2026 · 10 min read
ESG Strategy
In This Article
Analysis of 2026 TNFD uptake, regional hotspots, reporting gaps, and steps to make nature-risk disclosures decision-ready.
TNFD Adoption Signals: 2026 Status Report
TNFD reporting is growing, but adoption does not prove that nature risk is under control. As of our October 1, 2026 research cutoff, TNFD reports more than 1,000 organizations across 56 jurisdictions making aligned disclosures. We recommend checking reporting scope, location data, and links to financial decisions before using those disclosures.
Our review points to three findings:
Participation is uneven: Asia-Pacific and Europe lead early adoption, with financial institutions among the first movers.
Coverage remains incomplete: An independent 2026 analysis found average coverage of 8.1 of 14 recommendations. Different samples and scoring methods limit comparisons.
Action matters more than commitments: Assign owners, map exposed sites and suppliers, and connect findings to lending, investment, procurement, and capital budgets.
We separate reporting commitments from published disclosures and flag limits in the data. Our planning focus is simple: <u>identify where nature risk could affect your business, who owns the response, and which decisions need to change.</u>
Regional Adoption and Sector Early Movers
Reported adoption clusters in certain regions and sectors rather than spreading evenly.
Adoption in Asia, Europe, and North America
Asia-Pacific and Europe have the clearest concentration of early adopters. TNFD’s 2025 Status Report covered 7,876 organizations. Asia-Pacific, particularly Japan, accounted for the largest respondent group, followed by Europe. Independent registry analysis supports this pattern, but adoption alone does not prove mature reporting quality.[11][7][10]
| Region | Reported signal | Source and date | Policy or market context | Evidence strength | Comparison limits |
|---|---|---|---|---|---|
| Asia-Pacific | Largest share in the independent adopter dataset; highest representation in TNFD’s 2025 survey | 50% of the adopter dataset, October 2024; TNFD 2025 survey | TNFD highlights current and expected regulatory developments in Asia | Official survey plus independent cross-check | Asia-Pacific covers more than Asia; respondent and adopter populations differ.[11][13][15] |
| Europe | Strong registry and survey representation | 34% of the adopter dataset, October 2024; TNFD 2025 survey | Regulatory developments have moved quickly in Europe | Official survey plus independent cross-check | Neither measure establishes complete reporting or proves that regulation drove adoption.[11][13][15] |
| North America | Smaller share in the independent adopter dataset | 5% of the adopter dataset, October 2024 | Investor expectations and regulatory readiness may be drivers, but this has not been demonstrated | Useful historical signal; insufficient to establish a current regional reporting share | Historical adopter share, not a current disclosure count.[13][15] |
These shares indicate direction, not a precise geographic picture. Headquarters, operating locations, and portfolio exposure do not map to the same places.
Financial institutions show a similar concentration, with adoption often starting around exposed portfolios and client relationships.[12][14]
Financial Institutions and Nature-Dependent Sectors
By November 2025, 179 financial institutions were engaged in TNFD-aligned reporting, representing $22.4 trillion in assets under management and 25% of global systemically important banks. The Green Finance Institute’s sector review found different levels of maturity across banks, asset managers, and insurers.[14][12]
| Sector | Primary nature dependencies | Exposure pathway | TNFD assessment focus | Disclosure maturity signal | Evidence limits |
|---|---|---|---|---|---|
| Banks | Dependencies of borrowers and collateral assets | Lending and sector concentrations | Client locations, collateral, and financed exposure | Client engagement and exposure management are initial use cases | Aggregate financial-sector figures do not establish bank-specific coverage.[12][14] |
| Asset managers | Dependencies of portfolio companies | Investments and stewardship | Holdings, engagement, and investment decisions | Pilot disclosures | Participation does not establish portfolio-wide assessment.[12] |
| Insurers | Dependencies of insured businesses and investments | Underwriting, claims, and asset portfolios | Physical-risk accumulation and material exposures | High-level materiality assessment is a common starting point | Screening does not equal full underwriting integration.[12] |
| Food, forestry, and fisheries | Water, soils, pollination, and ecosystem productivity | Sourcing and supply continuity | Production locations, commodities, and ecosystem impacts | Registry research identifies forestry-related adoption activity | Nature dependence alone does not establish reporting leadership.[10] |
Among these early movers, work generally begins with location data before moving from screening to assessments that can inform decisions.
LEAP and Possible Adoption Drivers
LEAP - Locate, Evaluate, Assess, Prepare - guides assessment; it does not replace disclosure or sector-specific measurement. Begin with location screening, then deepen the assessment where exposure warrants it.[8][9]
Likely adoption drivers include material exposure, investor pressure, regulatory readiness, reporting capacity, location data, and existing sustainability-reporting systems. These signals can help prioritize exposed locations, supply chains, and financed activities for assessment.[2][12]
sbb-itb-8baf5f1
Disclosure Trends and Reporting Gaps
TNFD Reporting Growth vs. Disclosure Coverage
Disclosure Counts and Recommendation Coverage
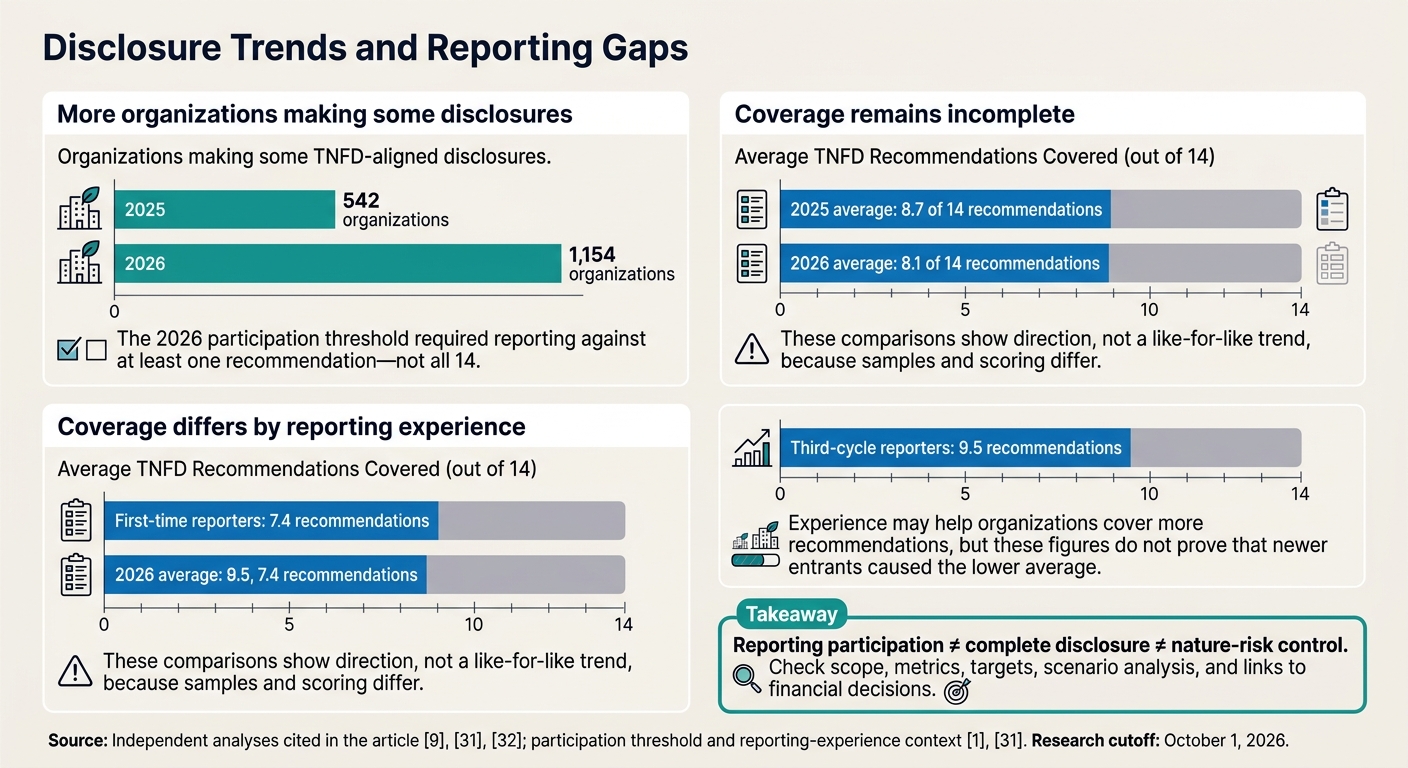
More organizations are reporting, but coverage still falls short. An independent analysis identified 1,154 organizations making some TNFD-aligned disclosures in 2026, up from 542 in 2025. Average coverage, however, fell from 8.7 to 8.1 of the 14 recommendations. These comparisons show direction, not a like-for-like trend, because samples and scoring differ.[6][20][21]
The 2026 participation threshold required reporting against at least one recommendation - not all 14. First-time reporters covered an average of 7.4 recommendations, compared with 9.5 for third-cycle reporters.[1][20] Experience may help organizations cover more recommendations, but these figures do not prove that newer entrants caused the lower average.
Earlier findings also show that metrics, targets, and scenario analysis remain underdeveloped. Readers should check whether disclosures connect nature issues to financial risks rather than assume that link exists.[5][18] For near-term risk decisions, the next step is to identify which gaps matter most.
Gaps in Scope, Metrics, Finance, and Governance
The table distinguishes documented findings from items that need organization-specific review. The decision consequences illustrate possible effects; they are not findings about every reporter.
| Gap | Supporting evidence | Decision consequence | Corrective action |
|---|---|---|---|
| Value-chain coverage | Documented: Missing asset and supplier locations require sector, regional, commodity, or modeled proxies.[16] | Material upstream exposure may be missed or overstated. | Inventory locations, prioritize material suppliers, and record exclusions and proxy assumptions. |
| Baselines and targets | Documented: Core-metric data has large gaps, with some values marked unavailable.[19] | Apparent progress may reflect changes in measurement rather than better performance. | Set baseline years, consistent calculation rules, interim targets, and procedures for explaining unavailable data. |
| Financial links | Documented: Metrics, targets, and scenario analysis remain less developed in early reporting.[18] Review needed: Whether individual reports quantify financial effects. | Nature findings may not inform investment, lending, or procurement decisions. | Connect material issues to revenue, costs, assets, liabilities, cash flows, and financing assumptions. |
| Accountability | Documented: An independent analysis found that only 12% of early adopters addressed all four pillars.[17] | Unclear ownership can delay action. | Verify board oversight, executive ownership, escalation routes, and integration into enterprise risk management. |
| Controls and assurance | Documented: Skills and data quality are implementation concerns.[4] Review needed: Control and assurance readiness. | Figures may be difficult to reproduce or review independently. | Assign control owners, retain source evidence, document calculations, and phase in assurance. |
Location Data and Metric Comparisons
Missing locations limit screening. Geocode material facilities and suppliers, record confidence in location data, and replace proxies over time. Without precise locations, water-risk screening can miss concentrations within shared watersheds. Ecosystem hotspot maps may also be too broad to guide action. The locate and evaluate steps therefore still need more precise asset-level data.
Skills and data-quality constraints are documented. Tool compatibility, ecological dataset coverage, and staff capacity need assessment within each organization.[4][16]
Compare metrics only after checking definitions, units, baselines, boundaries, methods, and reporting periods. A measure covering owned operations is not equivalent to one covering upstream suppliers or financed activities. TNFD guidance calls for measurement baselines, changes from the previous reporting period, and relevant locations.[22][23]
Before using a sector or regional average, check those details and ask which investment, procurement, or risk decision the disclosure supports. For near-term screening and financing, that means identifying which sites, suppliers, and financed exposures need action first.
Near-Term Nature-Risk Planning
Actions by Planning Horizon
Use the gaps above to plan action by time horizon. Adoption alone does not prove risk control: uptake is growing, but implementation quality varies. Treat the sequence below as flexible guidance, not a TNFD-required timetable. LEAP is voluntary, and timing should reflect material exposure, data readiness, and business needs.[24][9]
| Time horizon | Action | Accountable owner | Required evidence | Decision supported |
|---|---|---|---|---|
| Immediate: 0–3 months | Establish assessment governance and scope | Executive risk committee | Mandate, materiality criteria, activity inventory, owner register, screening results | Which activities warrant assessment |
| Near term: 3–6 months | Map locations against ecosystem and water indicators | Sustainability lead | Geographic identifiers, methods, sources, exclusions, confidence ratings | Which locations and relationships need assessment first |
| Near term: 6–12 months | Assess location-based dependencies, impacts, and financial exposure | Business-unit owner | LEAP findings, stakeholder input, assumptions, exposure estimates, response costs | Which changes to operations or investments to pursue |
| Longer term: 12+ months | Integrate nature risk into management and controls | Executive management | Targets, scenarios, action plans, control tests, assurance reports | Whether actions reduce exposure and improve resilience |
Prioritize high-integrity or fast-declining ecosystems, biodiversity-sensitive locations, and water-stressed areas.[26] Reassess the inventory as supplier networks, asset footprints, ecosystem conditions, regulations, and financing exposures change. Connect material findings to risk registers, capital planning, procurement, insurance, financing, and strategy.[2][25]
After screening priority locations, turn the findings into records that support decisions.
Connecting Location Data to Financial Decisions
Build a decision-ready inventory that links each site, supplier, asset, or financed activity to its location, financial exposure, controls, owner, and reassessment date. These records address the location, finance, and governance gaps identified above. Lenders and investors can use them in borrower engagement, underwriting, collateral assessments, loan covenants, portfolio limits, and investment analysis.[2][25]
Translate ecological findings into decision variables - not just maps or narratives.
Water stress can inform facility expansion, production scheduling, technology selection, and water-reuse investment. Ecosystem degradation can affect agricultural yields, raw-material availability, and supplier qualification. Flood, wildfire, or drought exposure can influence site design, maintenance budgets, insurance, and business continuity. Permitting or restoration requirements can affect project timelines and capital costs.[2]
When evidence is uncertain, use exposure estimates, sensitivity analysis, and response-cost ranges.[2]
Maintain a disclosure-readiness matrix covering all 14 recommended disclosures. Record status, evidence, missing data, affected business units, interim controls, owner, remediation, and completion date. Document exclusions, how much they matter, interim proxies, and improvement plans.[2][25]
Council Fire: Translating Findings into Action
Implementation support is most useful when teams need to move findings from analysis into action.
Council Fire can help turn location-based findings into concrete supply-chain, infrastructure, and investment decisions.
Research Methods and Key Takeaways
Sources and Comparison Limits
Headline figures need context. The September 2026 TNFD Status Report’s methodology was updated on September 29, before this article’s October 1 cutoff.[1] Its survey, AI-assisted reporting review, Bloomberg, and CDP evidence draw from separate datasets - not a single population.[1]
Compare results only when reporting windows, denominators, classifications, exclusions, and scoring methods match. Also check whether AI-identified alignment received independent review. TNFD’s 2025 threshold counted at least one aligned disclosure as reporting; that does not mean full disclosure.[7]
3 Priorities for Nature-Risk Planning
Coverage and quality scores tell more about decision readiness than adoption totals alone. One financial-institution analysis found average recommendation coverage of 62%, compared with an 18% disclosure-quality score. Those results apply only to that study’s sample and scoring method.[27]
Adoption totals show momentum. Governance, location data, and integration into capital decisions show readiness. These limits point to three practical priorities:
Close governance gaps: Assign board and executive owners for nature risk, materiality judgments, and data quality.
Close hotspot mapping gaps: Map sites, suppliers, portfolios, and value-chain interfaces to ecosystems. Document location-data gaps and assumptions.
Strengthen financial integration: Turn hotspot findings into lending, investment, underwriting, procurement, capex, and resilience decisions.
FAQs
How can I tell if a TNFD report is decision-ready?
A decision-ready TNFD report gives a transparent, location-specific view of how your organization depends on and affects nature. It aligns with TNFD’s four pillars: Governance, Strategy, Risk and Impact Management, and Metrics and Targets.
Look for analysis based on LEAP, assessments of both financial and impact materiality, and clear disclosure of data limitations. The report should follow the mitigation hierarchy - avoid, minimize, restore, offset - and connect nature-related findings with enterprise risk management and climate reporting.
How should I prioritize nature risks with limited data?
Start small with TNFD’s LEAP approach. Assess your operations, the upstream supply-chain segments most closely tied to nature, and the locations where your business interacts with ecosystems. If primary biodiversity data isn’t available, use reliable secondary data and proxies, and document your assumptions and data gaps.
Nature risk depends on location, so map dependencies and impacts site by site rather than relying on company-wide metrics. Use those findings to guide risk management and business strategy - not just reporting. [1][2][3]
Which TNFD reporting gaps should I address first?
Start with the data and scope gaps that prevent sound TNFD disclosures: missing site- and ecosystem-level data on nature dependencies and impacts, weak or undocumented metric baselines, and narrow value-chain boundaries. Where primary data is unavailable, use proxies and explain the methods clearly. Prioritize direct operations and the highest-risk upstream supply segments.
Then explain how governance, strategy, and risk management will address nature risks - not simply add a paragraph to climate reporting. [1][2][3]



FAQ