
Sep 30, 2026 · 18 min read
ESG Strategy
In This Article
Seven digital tools to build connected evidence for supply-chain transparency: supplier data, traceability, blockchain, risk, audits, logistics, reporting.
On this page
- Panel. Signed, sealed and delivered: the tech behind transparent supply chains
- Quick Comparison
- Side-by-Side Comparison of the 7 Tool Categories
- 1. Supplier Data Platforms
- 2. Product Traceability Software
- 3. Blockchain and Distributed-Ledger Systems
- 4. Supply-Chain Risk Mapping Tools
- 5. Digital Audit and Assessment Platforms
- 6. Shipment and Logistics Tracking Tools
- 7. Sustainability Reporting and Transparency Dashboards
- How to Evaluate Any Tool Before You Buy
- Conclusion
- FAQs
7 Digital Tools for Supply Chain Transparency
Most companies still cannot see deep into their supply chains. One 2025 survey found that only 13% of businesses said they knew their full sourcing network, and just 8% of reporting companies had traceability data beyond Tier 3.
If I want supply chain transparency, I should not look for one magic platform. I need a connected set of tools that answers seven different questions: Who are my suppliers? Where did this product come from? What risks sit in the network? What was checked? Where is the shipment? And what can I disclose with proof?
Here’s the short version:
Supplier data platforms map suppliers, sites, and upstream links
Product traceability software tracks lots, batches, and custody events
Blockchain systems share tamper-evident records across companies
Risk mapping tools flag exposure by site, route, region, and input
Digital audit platforms track findings, evidence, and corrective actions
Shipment tracking tools show shipment status, custody, and condition
Reporting dashboards pull the data together for management and disclosure
The main point: transparency is not the same as visibility or traceability. Visibility shows what is happening now. Traceability shows where a product went. Transparency adds proof, controls, and disclosure.
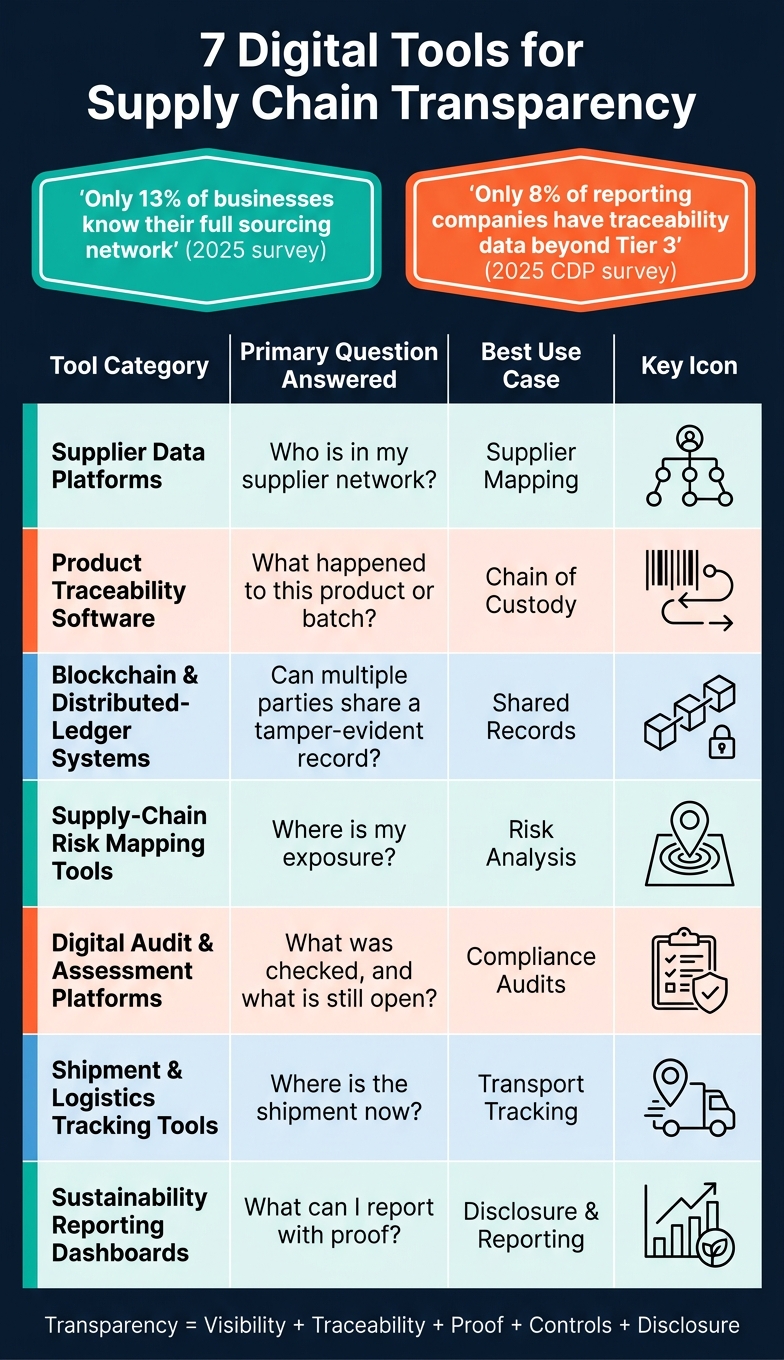
7 Digital Tools for Supply Chain Transparency: Side-by-Side Comparison
Panel. Signed, sealed and delivered: the tech behind transparent supply chains
sbb-itb-8baf5f1
Quick Comparison
| Tool | Main question it answers | Best use |
|---|---|---|
| Supplier data platforms | Who is in my supplier network? | Supplier mapping and tier records |
| Product traceability software | What happened to this product or batch? | Chain of custody and transformation tracking |
| Blockchain systems | Can multiple parties share the same event record? | Shared records across companies |
| Risk mapping tools | Where is my exposure? | Site, route, labor, climate, and geopolitical risk checks |
| Digital audit platforms | What was checked, and what is still open? | Assessments, findings, and remediation |
| Shipment tracking tools | Where is the shipment now? | Transport status, ETA, and condition monitoring |
| Reporting dashboards | What can I report with proof? | Aggregation, controls, and disclosure |
If I were choosing where to start, I’d match the tool to the evidence gap first - not the sales pitch.
Side-by-Side Comparison of the 7 Tool Categories
These seven categories are complementary tools, not a ranking. Each one answers a different supply-chain question. A supplier platform shows you who is in your network. A traceability system shows you what happened to a product. A risk-mapping tool shows you where exposure sits.
Use the table below to compare these categories by role, not by hype. It lines them up by question, value-chain fit, data, users, and the main checkpoint to test during selection.
| Tool Category | Primary Question Answered | Where It Fits | Typical Data Captured | Main Users | Key Selection Checkpoint |
|---|---|---|---|---|---|
| Supplier Data Platforms | Who are our suppliers, sites, and upstream relationships? | Supplier onboarding, sourcing, procurement, and tier mapping | Legal entities, site addresses, ownership, certifications, policies, tier relationships | Procurement, supplier management, compliance, sustainability | Can it represent multi-tier relationships and connect supplier records to ERP or procurement data? |
| Product Traceability Software | Where did a product or batch originate, and what happened to it? | Raw materials, manufacturing, processing, distribution, and post-sale custody | Product IDs, lot/batch numbers, origins, transformation events, custody transfers | Quality, operations, food/product safety, compliance | Does it capture required Critical Tracking Events (CTEs) across partners, including low-connectivity locations? |
| Blockchain & Distributed-Ledger Systems | Can multiple parties share a tamper-evident record of agreed events? | Cross-company handoffs and shared records spanning multiple stages | Dated confirmations, custody transfers, certificates, permissions | Trading partners, compliance teams, provenance owners, auditors | Is a shared ledger truly needed, and are governance, privacy, and correction rules defined? |
| Supply-Chain Risk Mapping Tools | Where are our operational, geographic, environmental, social, and geopolitical risks? | Network-wide analysis across suppliers, sites, transport routes, regions, and external risk events | Coordinates, hazard layers, sanctions data, labor-risk indicators, deforestation and water-risk data | Enterprise risk, procurement, resilience, sustainability, security | Are data sources current, geographically precise, and relevant to the company's specific commodities and sites? |
| Digital Audit & Assessment Platforms | What controls were assessed, what failed, and what corrective action is open? | Supplier qualification, site assessments, and remediation | Questionnaires, evidence files, findings, corrective-action plans, closure records | Internal audit, responsible sourcing, quality, EHS, compliance | Can it verify evidence, track remediation to closure, and block unverified self-assessments? |
| Shipment & Logistics Tracking Tools | Where is the shipment now, and is it moving as planned? | Transportation, warehousing, ports, distribution, and final delivery | GPS/telematics signals, carrier milestones, estimated arrival times, temperature, exception events | Logistics, transportation, customer service, inventory, planning | Does it integrate with carriers and distinguish estimated arrival times from confirmed delivery events? |
| Sustainability Reporting & Transparency Dashboards | What does the combined evidence show, and can we substantiate what we disclose? | Enterprise-wide aggregation for management and external disclosure | Emissions, energy, water, waste, supplier metrics, audit status, targets, calculation methods | Sustainability, finance, investor relations, executives, board members | Can every metric trace to source data, methods, and approvals? |
Transparency comes from connected records, not isolated tools. That’s the heart of it. These systems only work together when suppliers, products, locations, and events share the same identifiers across platforms.
Use this comparison as a starting point. Pick the category that matches your biggest evidence gap first, then build from there.
1. Supplier Data Platforms
A supplier data platform brings supplier records into one place: legal entities, facilities, ownership, certifications, audits, and corrective actions. It’s the starting point for almost everything that follows, because traceability, risk, audit, and reporting tools all rely on the same supplier identity.
That record only matters if it stays current, checked, and linked to the systems teams already use. In practice, this lives inside procurement and supplier management, where it supports sourcing, contracting, and day-to-day supplier oversight. Many companies begin with direct, or Tier 1, suppliers, then extend data collection upstream to contract manufacturers, raw-material processors, farms, mines, and logistics providers. That step matters. Most major supply-chain incidents happen beyond Tier 1.[6]
A central record is not the same thing as a checked one. A profile can look complete and still contain unconfirmed or old information. Good platforms make clear distinctions between self-reported data, document-backed claims, verified data, and monitored data. Each field should show where the data came from, when it was added, what evidence supports it, who checked it, and when it needs renewal. Without that chain of proof, a polished profile can still hide weak data.
Certification data needs the same level of precision. It only helps when it is tied to the exact facility and product covered by the certificate. Records should include the issuer, the covered facility, the certificate number, issue and expiration dates, and current validation status. The system should also flag any certificate that does not match the facility or product in scope. If that link is loose, the record can look fine on paper while missing the mark in practice.
Transparency also breaks down when supplier records sit apart from purchasing and reporting. Without integration with ERP, procurement, and reporting systems, the platform turns into one more silo. That’s where false confidence creeps in. An approved supplier status in the platform should show up the same way in the purchasing system, and old information should not stay active by mistake. It’s worth testing two-way sync, identity matching, and the way the system handles supplier status changes in the middle of a contract.
2. Product Traceability Software
Supplier data platforms help you see who is in the network. Product traceability software answers a different question: what happened to a specific product, material, or component from start to finish. It builds a linked record of custody changes, transformations, and movements tied to a product identifier such as a batch number, lot code, or serial number across the tiers it touches. This becomes most important at transformation points, where inputs are turned into something new.[1][7]
This software sits in the operational layer of the value chain. It connects origin data, production orders, custody transfers, and downstream movement. Its core job is to preserve the relationship between inputs and outputs, especially when raw materials are mixed, repacked, or converted into a new item.[3][8]
Traceability means reconstructing the path of a defined product, batch, lot, or serial number through recorded custody and transformation events. Visibility, by contrast, shows current status but not the full chain of custody.
When choosing a platform, the focus should stay on data integrity and system integration. A traceability system should show who entered each event, when it was entered, where the data came from, and whether anyone edited it later. It should also keep supplier claims separate from verified records and flag gaps such as missing events, quantity mismatches, or broken custody links.
Integration matters just as much. The platform should connect with ERP, warehouse management, procurement, and reporting systems through APIs, scanners, and direct connectors. For food businesses, it should also support electronic, sortable records that can be produced fast when requested. Those functions determine whether the platform can actually prove product history with connected records, rather than just store data that appears complete.[9][10]
3. Blockchain and Distributed-Ledger Systems
Where traceability software tracks product events, blockchain helps multiple organizations work from one shared, tamper-evident record. It doesn’t replace traceability software. It backs shared verification across companies. Instead of putting one company in charge of a central database, a distributed ledger gives the same time-ordered record to multiple participants across the network. Each new record connects to the one before it, so any attempt to alter the chain becomes visible.[11][13]
That setup can make cross-company traceability faster and less messy because everyone refers to the same event record. But there’s a catch: the record is only as good as the event behind it.
Blockchain does not verify physical reality on its own. A ledger preserves what was submitted. It does not prove the submission was correct. If a supplier enters the wrong origin data, or a compromised device sends false readings, the ledger will store that bad record exactly as received. That’s why physical inspections, IoT sensors, lab tests, and third-party audits still matter. They connect what happened in the field, factory, or warehouse to the digital entry.[12][2] This is the gap between digital records and physical events, and no ledger system closes that gap by itself.
Governance sits at the center of the whole setup. Before choosing a platform, decide who runs the network, who can write or validate records, how disputes get handled, and what happens when a participant leaves. A well-built ledger with weak governance can still fill up with poor data.[14][11] Privacy needs the same level of care. A common approach is to put only hashes, identifiers, or document references on-chain, while keeping the source files in a controlled off-chain system.[16]
A ledger also has to work with the systems teams already use day to day. That means linking it to ERP, procurement, logistics, and reporting tools through APIs and standard identifiers.[15][17] Before making a big commitment, test whether the ledger improves evidence quality rather than just giving you another place to store records. Start with a narrow pilot - say, a high-risk ingredient - and track a few plain metrics:
trace time
supplier participation
audit effort
That kind of pilot shows pretty fast whether the ledger is helping the process or just adding another layer of admin.
4. Supply-Chain Risk Mapping Tools
Once you've mapped the network, the next job is simple in theory and messy in practice: find where exposure piles up.
Risk mapping tools help you see which suppliers, sites, and routes face risk across the extended network. They pull supplier, site, route, and outside risk data into a single map.[4][18] But the map can't just look good. Every relationship should show its source, date, confidence level, and verification status, so the tool works as an evidence-quality layer, not just a visual overlay.[20]
One sample analysis shows why this matters. When supplier-address data and trade data were layered together, the process surfaced 929 additional sites beyond the client's mapped network, including many in countries that had not appeared in the original view.[23]
Use facility-level data rather than headquarters addresses. Each site should include:
A unique facility identifier
Legal entity
Full address
Latitude and longitude
Facility type
Ownership
Operating status
That geolocation data links a specific factory to a flood zone, wildfire area, or conflict zone, instead of leaving you with a broad country-level flag.[5][19] Geography is only part of the picture, though. Concentration risk matters just as much. A company may seem to have three separate Tier 1 suppliers, yet still carry single-source exposure if all three depend on the same specialty input from one upstream plant.[20][22]
The map should also layer in labor and human-rights indicators, climate and water-stress hazards, sanctions and restricted-party lists, political instability, and logistics disruptions. The OECD's due-diligence framework makes the point plainly: these signals should be ranked by severity and likelihood of harm, not treated like one long alert feed.[4][18] An unrest alert means little on its own. It matters when it connects to a specific facility, a critical component, and the available backup capacity.
This tool also needs clean data exchange with the systems your team already uses. That includes ERP and procurement systems for supplier IDs and spend data, logistics systems for routes and shipment lanes, and reporting systems for due-diligence evidence and disclosures.[20][21]
Use this tool to prioritize investigations; do not use it as proof of compliance.
Once hotspots are mapped, audit tools can focus first on the suppliers with the highest risk.
5. Digital Audit and Assessment Platforms
Risk maps show where exposure tends to cluster. Audit platforms help you check what’s happening at those suppliers and sites. In practice, that means starting with the locations your risk map flags first.
These platforms pull supplier questionnaires, on-site assessment records, certifications, findings, corrective-action plans, and supporting evidence into one system. In the value chain, they usually sit between procurement or supplier management and the teams handling sustainability, compliance, and risk. Companies use them during onboarding, routine monitoring, and corrective-action follow-up. At the center is a simple question: Does the evidence show that a supplier or site meets the social, environmental, quality, or ethical standards you set - and what is still open?
A well-set-up platform should do far more than act like a folder full of PDFs. It should record findings in a structured way, assign severity ratings, give each finding an owner and deadline, request specific proof of remediation, and track whether that proof was independently reviewed or only submitted by the supplier. That distinction matters. The platform organizes evidence; it does not prove the evidence is true. Keep supplier-submitted plans separate from verified closure.
Worker voice is often the area where these platforms can help most, and it’s also where many teams miss the mark. Confidential or anonymous surveys, SMS reporting, and off-site interviews can reveal conditions that a scheduled site visit may never catch, especially with sensitive issues such as forced labor, abuse, or retaliation. As the record shows, short audits are limited samples, not proof of compliance.[24][26] A clean audit means the method did not identify forced labor - not that it is absent.[25] That’s a big difference. Worker feedback should connect to grievance procedures, not just sit in an audit file.
When you’re choosing a platform, start with integrations. Check that it connects with your ERP, procurement, and sustainability systems so verified findings can update supplier status, approval decisions, and disclosures without manual re-entry. If a finding is high severity, it should be able to affect supplier approval or purchasing controls. If closure is verified, your risk score should update automatically.
Audits are snapshots, nothing more. They cover one facility, one visit window, and a limited sample of workers and records. Announced visits also give suppliers time to prepare. That’s why audit results work best when paired with grievance data, worker feedback, payroll records, and unannounced or risk-based follow-ups. If you publish a compliance score, report the coverage and the limits right alongside it.
6. Shipment and Logistics Tracking Tools
Shipment and logistics tracking tools show what happens to goods after they leave a supplier or plant. They tell you where a shipment is, what has happened along the way, when it is expected to arrive, and whether handling conditions stayed within spec. In practice, they pull carrier updates, booking and dispatch records, port or terminal events, customs milestones, warehouse scans, delivery confirmations, and ETA changes into one event timeline - from shipment booking through final delivery. When teams use that timeline well, it helps with exception management, custody checks, and faster proof of delivery.
These tools sit in the transportation and distribution layer of the value chain, between supplier or manufacturing sites and the end customer. That covers ocean, air, rail, truckload, parcel, and last-mile moves. Coverage and refresh rates differ by mode and region, so it helps to map the transport legs that matter most before you compare platforms. A system may look strong on paper, then fall short on the lanes you depend on every day.
For temperature-sensitive goods - pharmaceuticals, fresh food, and chemicals - the better platforms do more than show location. They also take in sensor readings for temperature and handling conditions. If a cold-chain excursion happens, the system should log the time, location, duration, and severity, then trigger a documented response. That sounds simple, but it matters. If a pallet of medicine sits too long outside its temperature range, a plain “delayed” label is not enough.
Still, more visibility does not automatically mean more transparency.
These tools can improve ETA accuracy, cut down on status inquiries, and strengthen delivery performance, but they do not prove sourcing compliance.
That line matters. For transparency work, shipment data should confirm movement and custody - not labor or ethics claims. Its role is evidentiary. Shipment records can support claims, but they cannot stand in for them. The backing for those claims has to come from supplier disclosures, facility assessments, worker-engagement mechanisms, certifications, grievance records, and corrective-action verification.
Before choosing a platform, ask vendors for a data-source inventory that shows where each event comes from. At a minimum, that should separate:
carrier-reported events
GPS-generated events
sensor-generated events
manually entered events
algorithmically inferred events
Not all events carry the same weight. A carrier-reported departure, a temperature sensor alert, and an inferred ETA update are not the same thing, even if they appear side by side on a dashboard.
You should also confirm that the platform keeps a full auditable event history with timestamps, source identity, and corrections, rather than only showing a current status label. And it should connect to ERP, TMS, WMS, and reporting systems so the tracking record is not stuck in a silo.
7. Sustainability Reporting and Transparency Dashboards
The first six tools help teams run the work day to day. This one answers the executive-level question: what does the full evidence set show?
At this stage, the aim is not to pile on more data. It is to create one clear view of evidence across the value chain. These platforms sit at the aggregation and decision layer. They pull in supplier records, traceability events, audit findings, risk maps, and logistics data, then turn that mix into metrics that procurement, sustainability, finance, and executive teams can use without squinting at ten different systems. Leaders should be able to filter the view by supplier, product, facility, geography, business unit, risk type, reporting period, and value-chain stage.
What makes a dashboard useful is not the polish of the charts. It is data credibility. Every metric should show where it came from and how much confidence users should place in it. Is the figure supplier-reported or modeled? Verified or estimated? A tiered confidence model helps here: verified primary data, supplier-reported data, validated secondary data, and estimates, with each one tagged for coverage and gaps. Without that distinction, a neat-looking dashboard can hide thin evidence in plain sight. IFRS S2 states that entities should prioritize verified Scope 3 data and explains that verification can increase confidence that information is complete, neutral, and accurate.[27][28]
For disclosure readiness, the dashboard should map metrics to required frameworks and export approved outputs for reports, filings, board materials, and investor disclosures. It also needs audit-ready controls, including:
role-based approvals
time-stamped records
evidence attachments
version control
exportable audit trails
On the integration side, the platform should have documented connections to ERP and finance systems for spend and vendor data, procurement platforms for sourcing and contract records, and logistics systems for shipment, mode, and carrier data.
Next, evaluate tools by data lineage, integrations, governance, and reporting output.
How to Evaluate Any Tool Before You Buy
Start with the decision the tool must support. Maybe you need to block a supplier with unresolved forced-labor indicators. Maybe you need to produce a chain-of-custody record for a customer inquiry. That first call sets the tone for every question after it. It also helps keep your review grounded, because each tool should face the same evidence standard from start to finish.
Next, ask the vendor to trace one real product from your network through Tier 1–3 and back to raw-material sources. This is where weak systems tend to show their limits. A platform that only stores direct-supplier questionnaires may give you Tier 1 visibility, but that does not prove where a high-risk mineral, agricultural input, or component came from.
Data quality is the next test, and it is the hardest one to fake. Each field should show its source, date, and validation status - supplier-reported, document-verified, audited, or inferred. Then ask to inspect the audit log live. You should be able to see the original value, the revised value, who made the change, when it changed, and what evidence supports it. [29] If the vendor hesitates during the demo, that hesitation tells you plenty.
Integration deserves a hard test too. Require documented, versioned APIs, then run a live import/export test without manual rekeying. If that workflow fails in the demo, it will not get easier after purchase. It will turn into a steady drain on time, money, and internal support.
Once integration is in place, check whether the tool affects decisions rather than just producing dashboards. The system should do more than display risk. It should help your team act on it.
Generate configurable alerts
Assign remediation owners
Set due dates
Track corrective-action closure
For sourcing decisions, procurement users should be able to filter suppliers by verified origin, risk level, or corrective-action status. To compare vendors, use a weighted rubric that puts the most weight on value-chain coverage, evidence quality, interoperability, supplier usability, workflow automation, and total cost of ownership. Before a full rollout, run a controlled pilot with one product line, one region, or 20–50 priority suppliers. That smaller test will show you how the system performs when real teams have to use it under normal conditions.
Conclusion
Put these seven tool types side by side, and the message is clear: transparency is an evidence system, not a software purchase. A 2025 CDP survey found that only 8% of reporting companies had traceability data from suppliers beyond Tier 3.[30] That gap points to a software-first mindset rather than a connected operating model.
The strongest setup links these tools so data can move across them. When shared identifiers are missing, systems stay cut off from one another. Each tool then produces its own partial view of the same supply chain. Connected properly, those same tools turn scattered data into evidence a team can use.
For leaders, the practical takeaway is simple: pick tools based on the decisions you need to make, the evidence you may need to defend, and the value-chain tiers you actually need to see. A dashboard that cannot support sourcing decisions, back up disclosures, or reach beyond Tier 1 is not a transparency solution.
Transparency comes from connected evidence, not isolated tools.
FAQs
Where should I start first?
Start with the decision that needs fixing, and make it specific. Don’t shop for software first. Pin down the business question, name the person who owns the data, and set a clear internal workflow for how that data gets collected, checked, and used.
From there, map your value chain so you can see where products move, where handoffs happen, and where data should be recorded. That groundwork matters. Tech comes after the basics - not before them.
Do I need all seven tools?
No. The right tool depends on the business decision you need to make right now.
Most sustainability software supports four main goals: audit-ready reporting, emissions reduction, responsible sourcing, and risk management. Start with the tool that matches your top priority. Bigger enterprises may later move to an all-in-one suite, but specialist tools are often faster to put to work and cost less when you need to solve one immediate problem.
How do I verify the data?
Verify supply chain data with both digital controls and direct checks. Start with system guardrails: automated validation rules, change logs, role-based access, approval workflows, Lot IDs, and documented Critical Tracking Events with precise timestamps and standardized units. These tools help keep records clean, traceable, and easier to review when something looks off.
Then test that data against outside sources. Cross-check it with procurement records, supplier questionnaires, and third-party databases so you’re not relying on a single stream of information. In high-risk areas, go further with on-site assessments, worker voice programs, satellite monitoring, and, where possible, blockchain systems that create a shared, tamper-proof record.



FAQ