In This Article
Track five metrics—review time, cost, coverage, corrective-action closure, and spend screened—to validate supplier ESG software ROI.
On this page
- Set a Baseline Before Implementation
- 1. Review Time per Supplier Assessment
- 2. Cost per Supplier Assessment
- 3. Supplier ESG Risk Coverage
- 4. On-Time Corrective-Action Closure
- 5. Purchasing Spend Screened
- Calculate ROI and Separate Software Gains
- Review Metrics Monthly and ROI Quarterly
- Conclusion: Measure Efficiency, Coverage, and Remediation
- FAQs
Supplier ESG Risk Software ROI: 5 Metrics to Track
I measure supplier ESG risk software ROI by verified results - not more assessments or alerts. I start with at least three months of baseline data, then track five metrics:
Review time per supplier assessment: Are staff spending fewer hours without cutting review quality?
Cost per supplier assessment: Are costs lower for work with the same scope and requirements?
Supplier ESG risk coverage: Are more in-scope suppliers covered by current, accepted assessments?
On-time corrective-action closure: Are issues resolved by their due dates with verified proof?
Purchasing spend screened: What percentage of eligible purchasing dollars reaches suppliers with current ESG screening?
I compare similar supplier groups and separate software gains from staffing, policy, and supplier-mix changes. For ROI, I count each dollar once, include software and rollout costs, and keep freed staff time separate from cash savings.
<u>My rule: review these metrics monthly and validate ROI with finance quarterly.</u> Better coverage and faster reviews matter, but they do not prove financial returns on their own.
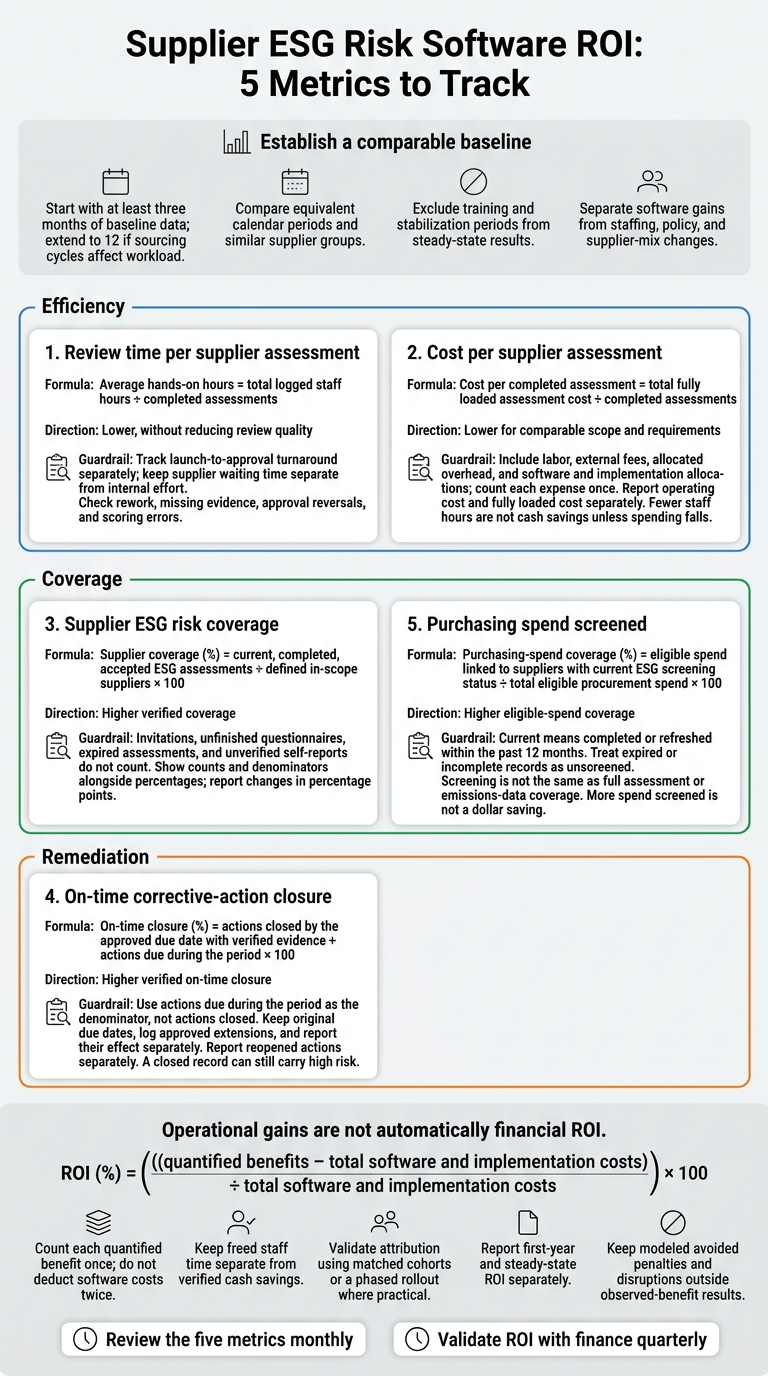
Supplier ESG Risk Software ROI: 5 Metrics to Track
Set a Baseline Before Implementation
Record a go-live date for each rollout cohort, and leave training and stabilization periods out of steady-state results. Compare equivalent calendar periods. Extend the baseline to 12 months if sourcing cycles, renewals, or audit seasons affect workload. These controls help keep baseline and post-launch comparisons consistent.
Create a data dictionary that defines active suppliers, eligible spend, risk tiers, and assessment completion. Document required questionnaires, evidence, verification steps, and reassessment rules. For corrective actions, set owners, severity levels, deadlines, escalation steps, and closure evidence. Keep screening separate from full assessment.
Save a dated extract of supplier master, purchasing, finance, questionnaire, and audit records for later ROI comparisons. Connect records using distinct supplier IDs. Include assessment volume, review timestamps, labor hours by role, loaded rates, external fees, valid assessments, open actions, and eligible spend in U.S. dollars. Reconcile supplier counts and spend with procurement and finance. Flag missing or unreliable records, and keep the original snapshot unchanged.
Use the comparison record below to measure review time, cost, coverage, closure, and spend screened consistently:
| Comparison factor | Baseline record | Post-launch comparison and controls |
|---|---|---|
| Timing | Calendar months, seasonal peaks, reporting deadlines | Compare equivalent months; identify launch and stabilization periods |
| Cohorts | Supplier IDs, risk tiers, regions, categories, active status | Track the same suppliers; report new and inactive suppliers separately |
| Scope | Questionnaires, evidence requirements, completion rules | Flag changes to policies, risk thresholds, or required evidence |
| Staffing | Reviewer hours, experience, outsourcing, systems | Account for hiring, training, integrations, and outsourced work when comparing time and cost |
| Responsiveness | Response times, incomplete submissions, follow-up effort | Separate supplier waiting time from internal review time |
| Data quality | Duplicates, missing fields, evidence age, spend mapping | Identify cleanup effects; apply consistent validity and currency-conversion rules |
| Remediation | Backlog age, severity, due dates, response plans | Account for escalation changes, regulatory requirements, and deadline-driven workload |
This record helps the five ROI metrics separate software gains from changes to the program itself.
Do not attribute every improvement to software. Keep a dated change register, with an owner assigned to each change. Retain a similar cohort awaiting rollout as a comparison group, and track program changes separately before reviewing the five metrics.
sbb-itb-8baf5f1
1. Review Time per Supplier Assessment
Calculate Effort and Turnaround Separately
With the baseline set, start with staff time. Average hands-on hours = total logged staff hours ÷ completed assessments. Count time spent on distribution, follow-up, evidence validation, scoring, and approval.
Track turnaround separately, from launch to final approval. Use either business days or calendar days consistently. State whether weekends, holidays, supplier waiting time, and paused assessments count. Keep supplier waiting time separate from internal effort.
Compare Baseline and Current Results
Compare averages with averages and medians with medians. The median helps describe typical performance when complex cases skew the results; the average supports labor planning.
| Measure | Baseline | Current | Change | Cohort changes to document |
|---|---|---|---|---|
| Hands-on hours per completed assessment | Logged hours ÷ completed assessments | Same calculation | Absolute and percentage change | Reviewer staffing and questionnaire length |
| Turnaround per completed assessment | Average launch-to-approval time | Same clock and calculation | Absolute and percentage change | Supplier response delays and pauses |
| Cohort mix affecting review time | Counts by risk, geography, category, and assessment type | Counts using the same groups | Absolute and percentage change | Onboarding, reassessment, and triggered review mix |
Segment by Risk and Scope
A shift toward simpler assessments can look like a software-driven productivity gain. Break out results by risk tier, geography, purchasing category, and assessment type, and include sample sizes and completion rates.
Report onboarding separately from reassessments. Likewise, keep questionnaire-only reviews separate from reviews that include evidence validation.
Attribute Savings Without Sacrificing Quality
Estimate gross hours saved as (baseline average hours − current average hours) × current completed assessments. Use medians only to describe typical performance, not to calculate total savings. Account for non-software changes and broader sustainability consulting initiatives before assigning value to the software.
Check rework, missing evidence, approval reversals, and scoring errors alongside speed. Treat vendor savings claims as benchmarks only, and verify results against staff time logs and case files. If quality drops, the time gain is not an ROI gain.
2. Cost per Supplier Assessment
Calculate Fully Loaded Cost
Cost per completed assessment = total fully loaded assessment cost ÷ completed assessments.
Count an assessment as complete only when all required evidence has arrived, the review is finished, data issues are resolved or documented, and a final risk outcome is assigned. Exclude drafts, duplicates, abandoned requests, and assessments still waiting on supplier evidence.
Price staff hours at role-specific rates that include salary, benefits, payroll taxes, and applicable overhead. Include allocated overhead, but count each expense only once.
Compare Baseline and Current Costs
Keep the comparison consistent: use identical periods, assessment definitions, risk tiers, supplier populations, evidence rules, and currency. Reconcile both periods to finance records. Include existing tools and systems in the baseline and the software allocation in the current period.
| Cost component | Baseline | Current | Organizational changes to document |
|---|---|---|---|
| Internal assessment labor | Hours × fully loaded rate | Hours × fully loaded rate | New roles, staffing changes, or reassigned work |
| Verification and audit | Third-party fees | Third-party fees | Changed sampling or assurance requirements |
| Data and subscriptions | External data purchases | Platform data and subscriptions | New data sources or discontinued tools |
| Translation and supplier support | Translation and outreach costs | Translation and outreach costs | New countries, languages, or supplier mix |
| Rework and quality fixes | Repeated requests and manual cleanup | Exceptions, escalations, and remediation | Changes in questionnaire or evidence standards |
| Software and implementation | Existing tools and systems | License, implementation, integration, training, and support allocation | Phased rollout or added modules |
| Cost per assessment | Total costs ÷ completed assessments | Total costs ÷ completed assessments | Volume or scope change |
Separate recurring operating costs from one-time implementation spending. Amortize implementation costs over the evaluation period, such as three years. Report both operating cost per assessment and fully loaded cost per assessment.[2][4]
Document acquisitions, offboarding, regulatory changes, centralized ESG staffing, outsourcing, wage shifts, and any questionnaire revisions.[3][5]
Compare Equivalent Risk and Scope
Unit costs tell a useful story only when the assessment mix is comparable. Compare low-, medium-, and high-risk suppliers separately. Then break out questionnaire-only, evidence-verified, and audit-supported assessments.
A lower portfolio average does not prove savings if fewer suppliers now require audits. Publish completed-assessment counts for each segment so readers can see what sits behind the average.
Attribute the Cost Change
Finance should separate actual cash savings from capacity gains. Fewer staff hours do not count as cash savings unless spending falls.
Before crediting the software, document changes in wages, outsourcing, assessment volume, and verification requirements. If fully loaded unit-cost savings feed into the broader ROI calculation, reconcile the software costs already included so they are not deducted twice.
With cost isolated, the next question is whether the software expands coverage and speeds remediation.
3. Supplier ESG Risk Coverage
Cost savings matter only if the software also extends verified supplier coverage.
Calculate Coverage
Supplier coverage (%) = current, completed, accepted ESG assessments ÷ defined in-scope suppliers × 100.
Set a written validity period for each risk tier. Count assessments only when they meet the required evidence and approval rules. Invitations, unfinished questionnaires, expired assessments, and unverified self-reports do not count as coverage. Report both counts and percentages for current, expired, incomplete, unverified, duplicate, and unassessed suppliers.[11][7][10]
Compare Baseline and Current Coverage
Record the baseline immediately before implementation. Use the same supplier master, scope rules, assessment definition, and validity period before and after launch. Show counts alongside percentages, and express changes in percentage points.[9][12]
| Measure | Denominator | Baseline percentage | Current percentage | Percentage-point change | Scope changes to document |
|---|---|---|---|---|---|
| Overall supplier coverage | All defined in-scope suppliers | Valid assessed suppliers ÷ baseline in-scope population × 100 | Valid assessed suppliers ÷ current in-scope population × 100 | Current % − baseline % | Acquisitions, exclusions, newly included suppliers |
Segment by Risk and Scope
Define active suppliers as those with purchasing activity during the reporting period. Report direct and indirect suppliers separately, but do not treat these categories as supplier tiers.[9][6]
Break down results by risk tier, geography, category, and supplier tier. This keeps the headline coverage figure from hiding gaps among higher-risk suppliers. Require stronger evidence from high-risk suppliers and use lighter questionnaires for lower-risk suppliers.[8][1]
Attribute Software Gains
Document the implementation date, automation features enabled, supplier population, assessment rules, staffing, outreach campaigns, policy changes, and supplier onboarding volumes. Where possible, compare rollout groups with suppliers still using the old process.[6][7]
Credit the software only when coverage gains align with automated reminders, portal completion, duplicate matching, validation, or reassessment alerts. Label gains from added staff, expanded scope, new contract terms, acquisitions, or one-time cleanup separately.[6][7]
4. On-Time Corrective-Action Closure
After coverage, the next test is whether issues close on time. Verified closure shows remediation, not just a completed task.
Calculate On-Time Closure
On-time closure (%) = actions closed by the approved due date with verified evidence ÷ actions due during the period × 100. Count an action as closed only when its evidence meets the acceptance criteria and required verification.[14][15]
Keep original due dates, log approved extensions, and report their effect separately. Report reopened actions separately, too.
Compare Baseline and Current Results
Use the baseline defined earlier and compare equal-length periods. Keep actions due separate from actions closed during each period. Late closures increase throughput but do not improve the on-time rate.
| Measure | Baseline period | Current period |
|---|---|---|
| Opened, due, closed, and reopened actions | Counts for each | Same counts, with scope changes noted |
| Verified on-time closure | Verified on-time closures ÷ actions due × 100 | Same calculation; change in percentage points |
| Overdue open backlog | Count and percentage of open actions | Same measures at period-end |
| Median days to closure | Median days from issue to verified closure | Same measure, by severity |
Segment by Risk and Scope
Break down results by severity, supplier risk tier, facility, geography, business unit, issue category, and assessment or audit source. Group overdue actions into 0–30, 31–60, 61–90, and more than 90 days.
Track repeat findings within the defined review window, the effectiveness verification rate, and remaining risk by severity level. Keep temporary containment separate from permanent correction: a closed record can still carry high risk.[14][15]
Attribute Software Gains
Use an attribution log to separate software-driven reminders, evidence tracking, and workflow tracking from supplier engagement, follow-up audits, management escalation, and added remediation resources.
Where practical, compare similar suppliers across phased rollout groups. Credit software only for reduced tracking effort or faster escalation supported by records.
5. Purchasing Spend Screened
Supplier counts can hide exposure. Spend coverage shows whether screening reaches the suppliers that account for the most purchasing dollars.
Calculate Spend Coverage
This metric measures financial exposure, not supplier count:
Purchasing-spend coverage (%) = eligible spend linked to suppliers with current ESG screening status ÷ total eligible procurement spend × 100.
Define “current” as completed or refreshed within the past 12 months. Treat expired or incomplete records as unscreened.
Include direct materials, in-scope indirect goods and services, and one-time purchases relevant to Scope 3. Disclose exclusions. Exclude inactive suppliers only after confirming they had no transactions during the reporting period.
Reconcile supplier IDs, duplicate records, parent-subsidiary links, purchase orders, accounts-payable transactions, assessment records, and the general ledger. Apply parent screening to subsidiaries only when the assessment covers them.
Compare screened and unscreened spend using the same transaction basis.
Compare Baseline and Current Spend
Use the latest complete 12-month transaction window as the baseline. Keep transaction-to-supplier mapping and screening-validity rules consistent. If the denominator changes, explain why rather than treating the change as better screening.
| Measure | Baseline | Current period |
|---|---|---|
| Screened eligible spend | USD linked to valid screening | Same calculation |
| Unscreened eligible spend | USD without valid screening | Same calculation |
| Total eligible spend | Screened + unscreened | Screened + unscreened |
| Spend coverage | Screened ÷ total × 100 | Same calculation; report percentage-point change |
| Scope changes | Included categories and exclusions | Added or removed categories, entities, and exclusions |
Segment Risk and Scope
Break out screened and unscreened spend by category, business unit, geography, risk tier, and Scope 3 relevance. Use screening gaps to target procurement controls at high-dollar suppliers. Escalate high-spend suppliers whose screening is overdue.
Keep ESG screening separate from emissions-data coverage. A current assessment does not establish supplier-level emissions data, though spend-based screening can flag likely Scope 3 hotspots before supplier-specific data collection.[16][17]
Attribute Software Gains
Separate software gains from portfolio shifts before crediting a coverage increase. Report actual coverage alongside like-for-like coverage and newly added scope.
Log spending shifts, acquisitions, supplier consolidation, policy changes, currency effects, and outreach separately. Each can change the numerator or denominator without software improving screening.
Credit software only when records show better supplier matching or assessment-status tracking. More spend screened is not a dollar saving; link gains to less manual work or faster procurement decisions.
Calculate ROI and Separate Software Gains
Use the five metrics above to translate measured gains into ROI.
ROI (%) = ((quantified benefits − total software and implementation costs) ÷ total software and implementation costs) × 100.
Report first-year and steady-state ROI separately.[18][19] Before comparing benefits with costs, apply the same baseline and cohort rules used in the prior sections.
Count each quantified benefit once. Value freed staff time at loaded hourly rates, but report it separately from verified cash savings. Do not count the same hours twice or deduct software costs twice.
Check the calculation against finance records. Maintain a benefits ledger that records each benefit’s owner, source, formula, baseline, current value, adjustment, and attribution confidence.
| Item | Baseline period | Current period | Normalization and ROI treatment |
|---|---|---|---|
| Assessment labor | Review hours × loaded hourly rate | Same calculation | Normalize workload and wage rates |
| Contractor costs | Paid assessment invoices | Comparable paid invoices | Count verified reductions; remove overlap with labor benefits |
| Workload normalization | Assessment count, risk tiers, evidence requirements | Same measures | Recalculate baseline effort for the current workload |
| Program costs | $0 | Subscription, integration, configuration, migration, onboarding, training, internal project labor, administration, support, and measurement costs | Include once |
| Net benefits | - | Attributable benefits minus total program costs | Use as the ROI numerator |
Next, separate software-driven gains from changes in staffing, policy, and scope.
Test attribution with matched cohorts or a phased rollout. Compare migrated suppliers with similar suppliers that have not yet migrated. Match them by risk tier, region, spend, assessment type, and baseline review time. Measure change over the same period rather than comparing end-state totals. Document other changes and any remaining differences, and credit only software-driven gains to ROI.[21]
Treat avoided penalties and disruptions as modeled scenarios - not realized savings. State the event probability, financial impact, and assumed software-attributable reduction in exposure. Keep these modeled benefits outside the observed-benefit result, and show conservative, base, and upside cases. Report gross quantified benefits, total costs, net benefits, ROI, freed staff time, and verified cash savings separately so readers can see where uncertain assumptions affect the results.[18][19][20]
Review Metrics Monthly and ROI Quarterly
After calculating ROI, set a fixed schedule: review the five metrics monthly and ROI quarterly. Procurement operations can own review time and assessment cost, drawing on workflow logs and finance records. The supplier risk management team can own supplier coverage and corrective-action closure, using the ESG platform and supplier master data. Procurement finance can own purchasing spend screened, using ERP purchase order and accounts payable data. For each metric, document its formula, scope, population, evidence standard, approval path, and data-quality owner.[23][24]
Keep the report date separate from the measurement period. Pull results from approved records; don’t present estimates as actuals. Use the dashboard below to keep every metric tied to the same baseline, scope, and approval rules.[23][24]
| Metric | Baseline | Current result | Target | Change | Cohort | Measurement period | Scope changes |
|---|---|---|---|---|---|---|---|
| Review time per assessment | Baseline minutes per assessment | Current minutes per assessment | Approved time target | Minutes saved and % reduction | Same risk tier and assessment type | Current reporting month | Questionnaire or workflow changes |
| Cost per assessment | Baseline cost in U.S. dollars | Current cost in U.S. dollars | Approved cost target | Dollar reduction and % reduction | Same assessment population | Current reporting month | Updated labor rate |
| Supplier ESG risk coverage | Assessed suppliers ÷ suppliers in scope | Count, denominator, and % | Coverage target | Percentage-point change | Defined active-supplier population | Current reporting month | New suppliers, regions, or risk tiers |
| On-time corrective-action closure | Verified on-time closures ÷ actions due | Count, denominator, and % | Closure-rate target | Percentage-point change | Actions due in the reporting period | Current reporting month | Changed deadlines or closure requirements |
| Purchasing spend screened | Screened dollars ÷ addressable spend | Screened dollars, denominator, and % | Spend-coverage target | Percentage-point change and dollars added | Defined purchasing categories | Current reporting month | Added business units or spend categories |
Monthly meetings should assign actions, not just review results. Check completeness, investigate missed targets, and give each follow-up an owner, due date, and evidence requirement. Track recurring findings separately.[13][14]
Attach a data-quality note that identifies actual, estimated, and provisional values, along with missing timestamps, duplicate supplier records, unverifiable self-attestations, and off-platform assessments. State the affected share and likely direction of bias, then lock the approved reporting extract.[24]
Review ROI quarterly with finance, alongside coverage and remediation. This view reduces distortion from seasonality, supplier campaigns, staffing changes, and complex cases. Use the meeting to verify that gains have held, approve validated benefits, update unresolved attribution assumptions, and check whether lower costs come at the expense of evidence quality.
Where possible, compare the implementation cohort with a phased rollout or control group rather than relying only on before-and-after results. Record staffing, policy, and supplier-mix changes so quarterly ROI doesn’t give the software more credit than it deserves.[22] Keep projected savings labeled as estimates until finance validates them.[25]
Conclusion: Measure Efficiency, Coverage, and Remediation
The five metrics answer three questions. Review time and cost per assessment measure efficiency. Supplier coverage and purchasing spend screened show how far screening reaches. Verified on-time closure measures remediation - not just task completion. Track recurring findings to check whether fixes last.[13][14]
Before rollout, lock in the baseline method defined above.[26]
Read the metrics together. Higher unit costs may be justified if they expand verified high-risk coverage and improve remediation. Faster processing alone isn't success. The goal is efficient, evidence-backed screening that produces lasting improvements. Claim ROI only for verified benefits that can be attributed to the work.
FAQs
How can I measure ROI without reliable baseline data?
Start with an initial supplier assessment to establish a baseline for current performance. Normalize the data by spend or output, then store it in a central register to keep records consistent.
If historical records are scattered or missing, focus on migrating the most recent two years. This supports trend analysis while keeping the rollout within scope. Before importing data, standardize units and definitions so business units can make consistent comparisons.
How do I set realistic targets for each metric?
Build your baseline from initial assessment scores and collected data. Normalize the figures by spend or output, then store them in a central register. Tie targets to your organization’s sustainability commitments, such as net-zero goals or human rights priorities.
Set targets with suppliers, not for them. Agree on objectives and timelines that reflect each supplier’s current capacity and maturity - and what it can realistically deliver.
How can I isolate software gains without a control group?
Document a baseline for a clearly defined workflow. Use metrics such as cost per assessment or review time, normalized by spend or output. Compare that same workflow before and after implementation.
Track data preparation, migration, integration, and day-to-day tasks separately. This helps distinguish software efficiencies from process changes and staff effort. Record your baseline assumptions, then check them against actual spending and staff effort during quarterly business reviews.




FAQ