Sep 25, 2026 · 9 min read
Governance
In This Article
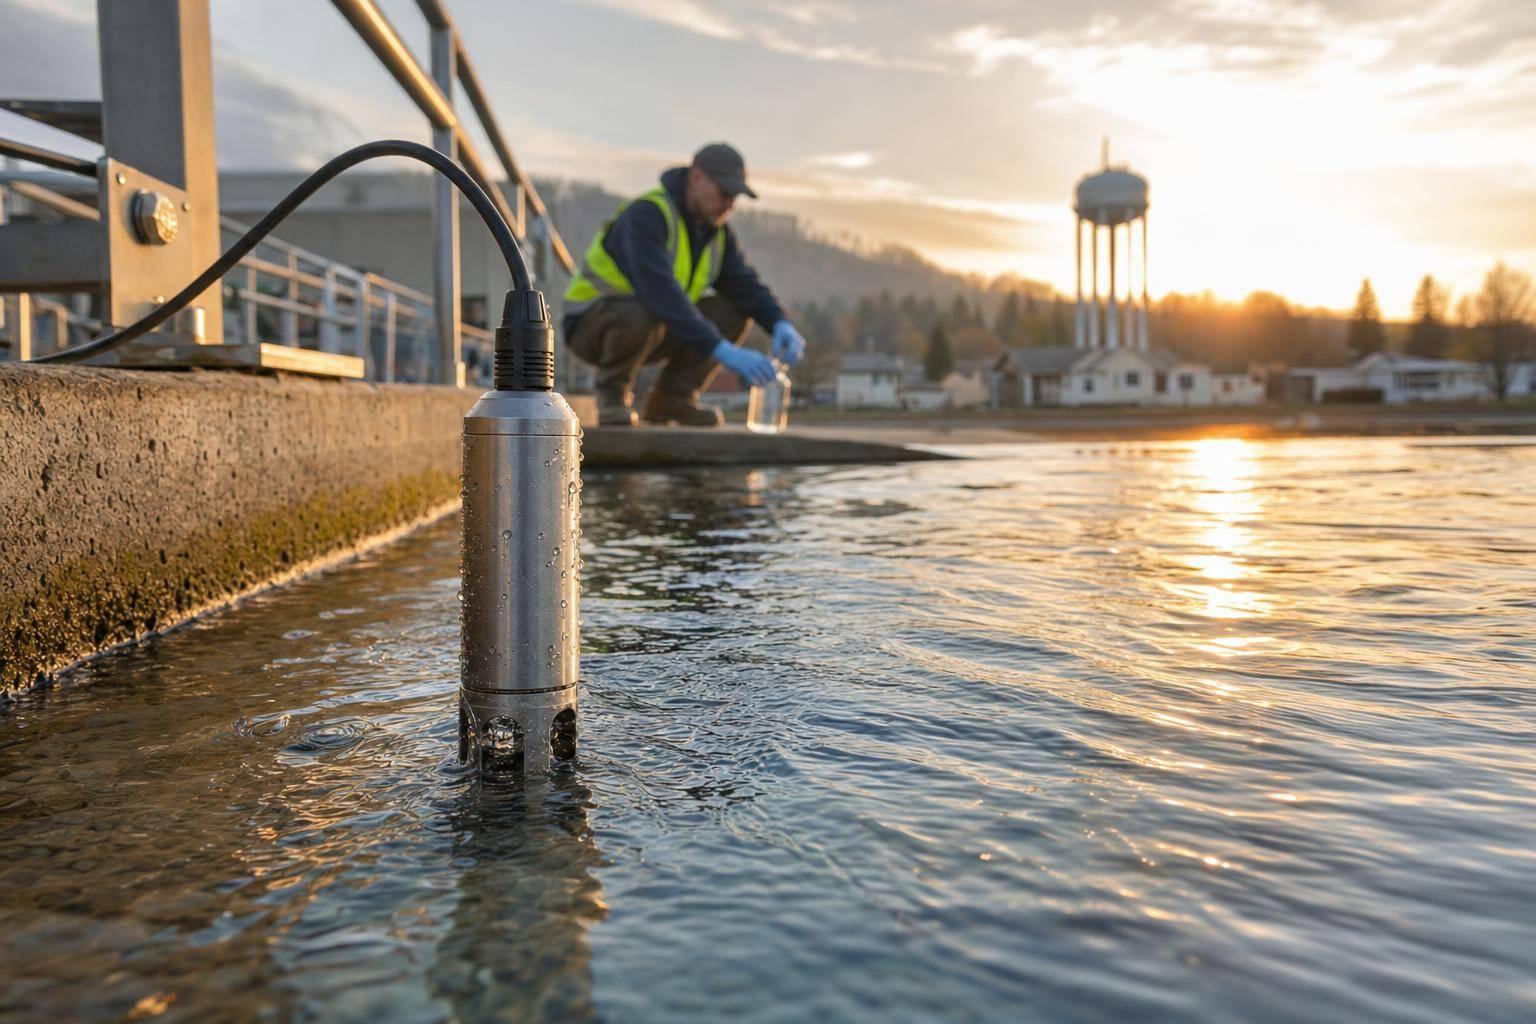
Continuous sensors catch short events between lab tests, speed alerts, and close coverage gaps when paired with maintenance and confirmatory sampling.
Smart Water Monitoring for Community Systems
A water problem can start and move through a system before the next lab result comes back. I see the core point this way: smart monitoring helps community water systems spot trouble sooner, watch more parts of the network, cut manual reporting delays, and support faster response - but it still depends on maintenance, staff training, alarm rules, cybersecurity, and lab confirmation.
If I boil the article down, it says five things matter most:
Periodic sampling leaves gaps between tests, so short events can be missed.
Connected sensors add constant visibility across source water, treatment, storage, and distribution.
Sensor alerts are early warnings, not proof, so follow-up sampling and lab work still matter.
Good results depend on setup, including sensor placement, threshold rules, calibration, and alert routing.
Rollout should start with risk, especially in older systems and underserved areas with weaker redundancy.
A few facts stand out:
Grab sampling may happen only weekly or monthly, while sensors can report in real time.
Manual processes can add days or even weeks before results are reviewed and shared.
Coverage often stays strongest near treatment sites, leaving tanks, dead ends, and low-flow zones with less visibility.
Quick comparison
| Area | Periodic sampling | Smart monitoring |
|---|---|---|
| Data timing | Scheduled | Continuous |
| Detection | After testing | Early warning |
| Coverage | Limited points | More distributed points |
| Reporting | Manual or delayed | Automated alerts |
| Role in compliance | Formal testing | Support tool; needs confirmation |
For me, the article’s message is simple: smart water monitoring does not replace lab testing - it fills the blind spots between tests and helps staff act faster when conditions shift.
Where Standard Monitoring Falls Short in Community Systems
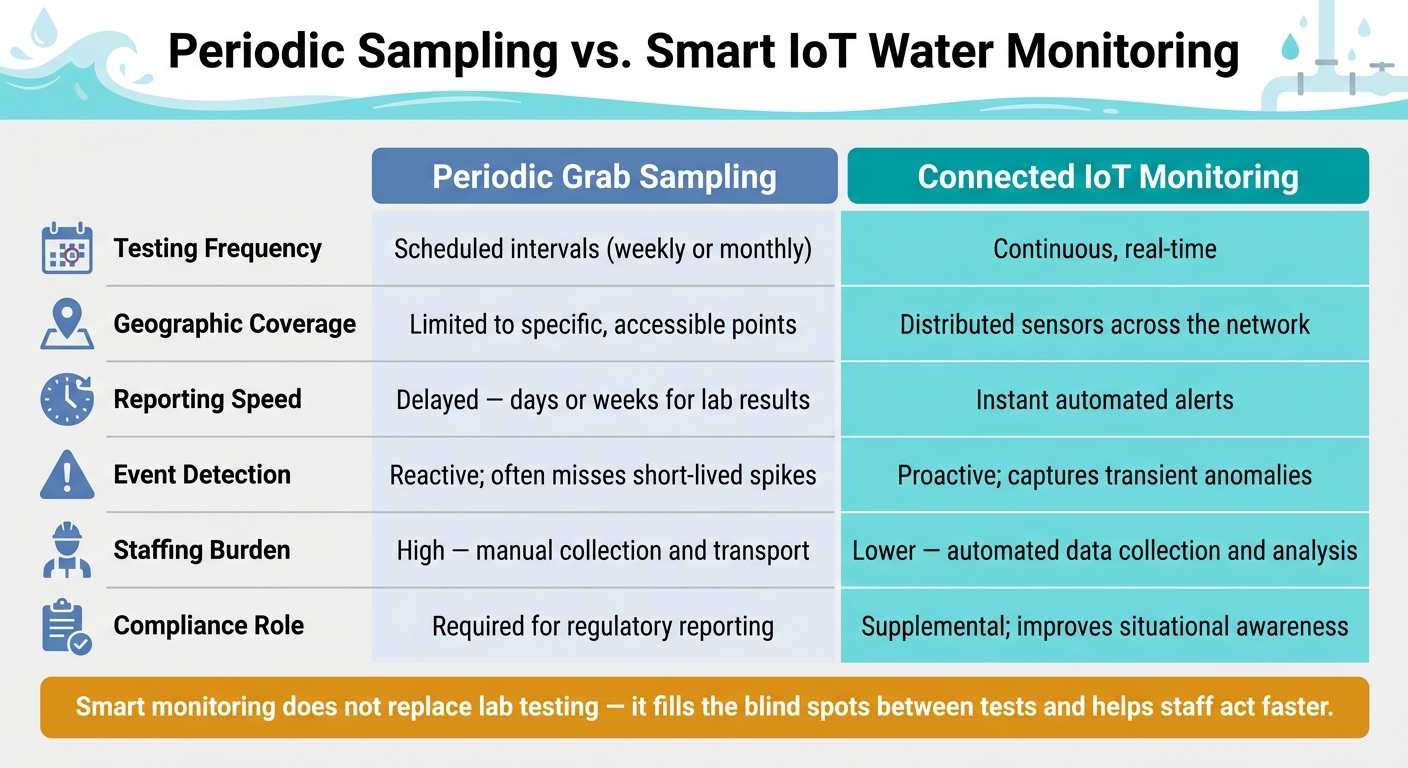
Periodic Sampling vs. Smart IoT Water Monitoring: Key Differences
Periodic sampling leaves gaps, and the trouble often starts between scheduled tests. That’s the weak point.
Why Periodic Sampling Misses Short-Lived Events
A grab sample shows one moment in time. If turbidity spikes or chlorine drops between tests, that event can come and go before anyone sees it. The clock starts ticking as soon as the sample is collected: transport, logging, processing, and reporting can take days. By then, that water may already have moved through the system and reached customers.
There’s another issue, too. Handwritten readings and manual data entry can introduce transcription mistakes and slow down escalation when time matters.
Even when the sampling itself is accurate, it can still miss what’s happening in the places that matter most.
How Limited Sampling Points Create Uneven Coverage
Limited sampling points leave whole parts of the network with little to no visibility. In plain terms, sparse sampling creates blind spots across the distribution system. For understaffed utilities, the problem gets worse. With limited personnel, crews can only reach so many sites on a set schedule. In practice, coverage often follows what’s easy to access, not what carries the most risk.
That gap becomes even clearer in day-to-day operations.
Periodic Sampling vs. Connected Monitoring: A Direct Comparison
The table below shows how the two approaches differ.
| Feature | Periodic Grab Sampling | Connected IoT Monitoring |
|---|---|---|
| Testing Frequency | Scheduled intervals (e.g., weekly/monthly) | Continuous, real-time |
| Geographic Coverage | Limited to specific, accessible points | Distributed sensors across the network |
| Reporting Speed | Delayed (days or weeks for lab results) | Instant automated alerts |
| Event Detection | Reactive; often misses short-lived spikes | Proactive; captures transient anomalies |
| Staffing Burden | High; requires manual collection and transport | Lower; automated data collection and analysis |
| Compliance Role | Required for regulatory reporting | Supplemental; improves situational awareness |
Connected monitoring improves situational awareness, but it does not replace lab confirmation. Sensors can flag a problem fast. Labs confirm what happened. A sensor alert still needs laboratory confirmation before it supports a formal compliance action.
That’s why the strongest setup uses both: connected monitoring for continuous visibility, and lab testing for confirmation.
sbb-itb-8baf5f1
How IoT Water Monitoring Works in Practice
Once the coverage gap is clear, the next step is simple: turn data into action. Smart water monitoring works as a data-to-response system. Sensors collect field readings, software spots trouble, and operators step in fast. That flow helps cut down on delayed testing, manual reporting, and service gaps, including nights, weekends, and thinly staffed shifts.
The Monitoring Chain: From Sensors to Response
Sensors track flow, pressure, pH, and turbidity. That data feeds into a dashboard, where staff can review system conditions in real time and measure readings against set thresholds. Some platforms also use predictive models to flag leaks, anticipate demand shifts, and detect equipment trouble earlier.
When a reading crosses a limit, the system sends an automatic alert. Operators then verify the alert and carry out the response plan. The point is action, not just more notifications.
Placement plays a big role here. If sensors are in the wrong spots, even a well-built workflow can miss the problems that matter most.
Sensor Placement Strategies That Close Coverage Gaps
A risk-based approach should cover source water, treatment, storage, and distribution. Utilities need to focus first on critical infrastructure and low-flow areas, where issues are more likely to build over time. Placement decisions should reflect both asset risk and climate exposure.
Tools like the [EPA's Climate Resilience Evaluation and Awareness Tool](https://www.epa.gov/system/files/documents/2024-08/r9-rtoc-epa-factsheet-creat-building-water-utility-resilience.pdf) (CREAT) can help utilities decide where monitoring will matter most. Pairing historical storm data with climate projections makes it easier to place sensors where future risk is highest. That means protecting the most vulnerable parts of the community system, not just the easiest assets to watch.
Turning Sensor Data Into Safe Decisions
Smart monitoring pays off only when operators trust the data and know what to do next. Detection is just the first step. Governance is what turns a signal into action.
Without clear operating procedures behind the sensors, the same old problems can stick around: slow testing, uneven coverage, manual reporting, and service gaps. Hardware alone doesn’t fix that. If validation is weak or alarm handling is sloppy, action on water safety risks can stall right when communities need a fast, dependable response.
Validation, Thresholds, and Maintenance Requirements
Set thresholds by site and by operating condition, then review them on a regular basis. That helps cut false alarms and keeps alerts worth paying attention to.
Operators should also document calibration, cleaning, inspection, and replacement schedules. Sensors drift over time, and one missed maintenance step can turn a dependable device into a source of bad data. Alarm signals should be treated as screening signals, not final proof, and confirmed before response.
Alarm Management, Data Quality, and Cybersecurity
Once thresholds are in place, the next challenge is how operators handle alerts and data. If every alert looks equally urgent, people start tuning out the ones that matter most. A tiered alarm structure helps keep that from happening:
Advisory-level alerts for minor deviations
Action-level alerts for issues that need a faster response
Critical alerts for situations that call for immediate escalation
Each tier should have named recipients and a documented escalation path.
Data quality controls matter just as much as the alarms. Missing data and sensor drift can leave blind spots, so operators need routines that flag those issues and logs that record maintenance. Access controls, software updates, and incident-response procedures should be part of the setup too. These controls decide whether a pilot delivers usable data or just adds more noise.
Implementation Roadmap for Resilient Community Systems
A Staged Rollout: From Risk Assessment to Pilot Deployment
Once thresholds, alarms, and maintenance plans are set, the next step is deployment planning. This is where rollout decisions help cut testing delays, fill coverage gaps, and shrink response lag.
Begin with a hazard assessment and baseline testing before buying sensors. Map the distribution system for aging infrastructure, pressure dead zones, and areas with low redundancy. Prioritize sites that serve vulnerable residents, then place sensors where failures would reach those communities first. At the same time, document staffing capacity, communication systems, and backup power at each potential site.
Next, choose monitoring parameters and sensor locations based on the risks found in the assessment. Pilot the system at representative sites, and tie sensor alerts to sampling plans and incident response protocols from day one. Those connections need to be built before the pilot goes live.
Prerequisites, Controls, and Success Measures for Scaling
Scaling rests on a few nonnegotiables. A weak spot in any one of them can hurt program performance.
| Implementation Prerequisite | Operational Risk | Control / Mitigation | Success Measure |
|---|---|---|---|
| Reliable Power & Comms | Data gaps during outages or extreme weather | Redundant power (solar/battery) and cellular/satellite backups | No critical data gaps during outage events |
| Calibration Capacity | Sensor drift causing false alarms or missed events | Scheduled field calibration and automated drift detection software | Monthly validation against lab-confirmed samples |
| Data Governance & Cybersecurity | Unauthorized access or data corruption | Integrate encryption, MFA, and role-based access before launch | Zero unauthorized access incidents per year |
| Trained Operators | Misinterpretation of alerts or improper maintenance | Specialized workforce training and decision support tools | All alerts acknowledged within the response window |
| Confirmatory Sampling | Over-reliance on sensors without validation | Trigger confirmatory samples from sensor thresholds | Sensor alerts consistently matched against lab results |
Equity needs direct attention here. Underserved neighborhoods often have the oldest infrastructure and the least redundancy. In plain terms, they need the most coverage, yet they often get the least. Building equity criteria into site selection from the start is what helps make the program resilient.
Conclusion: What Smart Monitoring Solves - and What It Still Requires
Smart water monitoring does cut detection delays, close coverage gaps, speed up reporting, and strengthen incident response. Those gains matter, especially when compared with periodic manual testing alone.
Still, the system only works as intended when it is paired with validated thresholds, steady maintenance, trained operators, laboratory confirmation, and clear accountability at every tier. Sensors do their job only when governance, maintenance, and response systems are already in place.
FAQs
How do smart sensors improve response time?
Smart sensors cut response time because they deliver a steady stream of real-time data instead of relying on slow manual reporting. That shift matters. When operators can see what’s happening as it happens, they don’t have to wait for someone to notice a problem and file a report.
By tracking flow, pressure, and water quality, these sensors spot trouble fast - whether that’s a leak, a drop in performance, or equipment starting to fail. And when readings cross set thresholds, the system sends automatic alerts so teams can act right away.
There’s another layer here, too. Predictive analytics helps operators see where things may be headed, not just where they are now. That makes it easier to schedule maintenance, prepare emergency actions, and deal with issues before they grow into bigger disruptions.
Which water quality issues can sensors catch first?
Smart water monitoring sensors help utilities spot trouble early. They keep a constant watch on key indicators like pH, turbidity, and total organic carbon, all of which can jump during heavy rainfall.
They also pick up unusual water use, shifts in flow, and pressure drops that may point to leaks or equipment trouble. That gives communities a chance to act fast, before a small issue turns into a bigger one.
What does a utility need before rolling this out?
Before rollout, a utility needs aligned governance across water, wastewater, and planning teams. That shared structure helps prevent silos, cuts duplicated effort, and keeps everyone working from the same playbook.
It also needs to finish a risk assessment grounded in operational data, climate signals, and basin analysis. From there, the best move is to test the approach with a small group first, then set clear alert thresholds so monitoring data can guide long-term resilience planning.

FAQ