
Jun 28, 2026
How to Measure and Communicate Collective Impact for Maritime & Logistics Companies
ESG Strategy
In This Article
Shared measurement—same outcomes, one method, clear data ownership—makes maritime impact claims credible.
How to Measure and Communicate Collective Impact for Maritime & Logistics Companies
If you cannot show who did what, how it was measured, and what changed, your impact claim will not hold up. In maritime and logistics, one shipment can touch carriers, ports, inland partners, and shippers at the same time. That means emissions, safety results, service levels, and community effects are shared across many companies - not owned by one.
I’d boil the article down to this: pick a short list of shared outcomes, use the same rules across partners, assign data owners, and report results with a baseline, method, scope, and time frame. That matters because shipping accounts for about 2.9% of global greenhouse gas emissions, and many shippers now expect better data before they award freight business.
Here’s the plain-English version:
Start with shared outcomes, not software
Focus on a few material topics across emissions, people, and service
Use one method per metric so partners do not report the same move in different ways
Set boundaries, baselines, and targets before public reporting
Assign ownership for recording, sending, and checking data
Match shared data to reporting rules like EU MRV, IMO DCS, GRI, SASB, and ISSB
Write proof-based claims, not broad promises
A few points stand out to me:
Scope 1 for a carrier can also show up as Scope 3, Category 4 for a shipper
For many retail and manufacturing firms, indirect emissions can be more than 80% of total footprint
Primary vessel data can differ by up to 35% from industry-average estimates
Hub activity like loading, unloading, and warehouse dwell can add 5% to 20% to shipment totals
The core message is simple: shared work needs shared measurement. If you want your reporting to stand up with customers, investors, lenders, and regulators, you need numbers that are defined the same way across the network and explained in plain terms.
Sustainability Across the Shipping Supply Chain | SSI| Oceans of Opportunity
Define shared outcomes and material topics before selecting tools
Before you open a dashboard or choose a framework, get clear on the small set of outcomes that matter across your network. That step sounds simple, but it saves a lot of drift later. One study of major port sustainability reports found 151 environmental and social indicators in use. Don’t treat that as a shopping list. Treat it as a warning: too many indicators can blur focus. Start with material topics, then pick the metrics and tools that let partners track them in the same way.
Prioritize environmental, social, and operational outcomes
In maritime and logistics, the topics that matter most tend to fall into three buckets.
Environmental outcomes such as decarbonization progress and climate resilience
Social outcomes such as worker safety, labor conditions, and community impacts
Operational outcomes such as service reliability across the network
Those priorities should match the network’s biggest risks and the places where joint action can produce measurable change. If a topic doesn’t help partners manage shared exposure or improve shared performance, it probably doesn’t belong on the short list.
Map stakeholders and align on shared priorities
Once the outcome categories are set, the next question is practical: whose data and priorities need to be part of the picture? Port authorities, carriers, shippers, suppliers, labor groups, and local communities all see different parts of the system. Each group also brings its own expectations. That’s the line between internal reporting and network-wide impact.
One useful move is to put data-sharing requirements directly into RFPs. That sends a clear signal to carriers and other partners: collective impact measurement is a business expectation, not a nice extra. And that matters more now that the industry is moving away from rough averages and toward voyage-level data, using metrics such as the Annual Efficiency Ratio (AER). As that shift continues, precise data that partners can share and use across the network becomes more important [1].
Align collective metrics with GRI, SASB, and ISSB expectations
Disclosure rules are shifting from voluntary to mandatory. The EU Corporate Sustainability Reporting Directive (CSRD) and U.S. SEC climate rules are pushing companies toward more consistent reporting [2][1]. If your collective metrics line up with GRI, SASB, and ISSB, partners can map shared results to reporting standards they already know.
For operators covered by EU MRV or IMO DCS, shared emissions data should line up with those systems. Put plainly: the emissions data used across the network should match the data reported under those programs.
Regulatory Framework | Scope | Primary Obligation |
|---|---|---|
EU MRV Maritime | Voyages to/from/within EEA ports | Report and verify emissions data |
EU ETS (Maritime) | Voyages to/from/within EEA ports | Surrender emission allowances |
IMO DCS | Global (international shipping) | Report fuel consumption data to flag state |
With outcomes and standards set, the next step is choosing metrics and tools that can track performance across the network.
Choose metrics and tools that work across partners
Once outcomes and standards line up, the next job is more practical: pick metrics that partners can collect and use without piling on extra reporting work. The best place to start is with metrics tied to the same voyage, shipment, or port call. That keeps the data grounded in one shared event instead of a rough estimate spread across many activities.
Environmental and resilience metrics for shared performance
For emissions, use voyage-specific data and one standard allocation method across partners: (Your Cargo Weight ÷ Total Cargo Weight) × Total Voyage Emissions. That gives each partner a clear share of the total. Use shipment-specific data instead of blended estimates for credible reporting [1].
For resilience, stick with operational metrics that every partner can define in the same way and report the same way. If one carrier counts a delay one way and a port counts it another way, the data falls apart fast.
Safety, workforce, and community outcome measures
The same rule applies here: one metric, one definition, one owner. For social outcomes, track measures such as total recordable incident rate, lost-time injuries, training completion, grievance closure time, and local community impact measures.
This may sound simple, but it saves a lot of back-and-forth. When each metric has a clear meaning and a clear owner, teams spend less time arguing over numbers and more time using them.
Dashboards, data architecture, and partner scorecards
A network ESG dashboard pulls shared performance data into one place across shippers, carriers, ports, and suppliers - from voyage emissions to safety incidents to service reliability. A partner scorecard, by contrast, tracks the KPIs tied to one partner relationship.
That split matters. A dashboard shows the whole network. A scorecard shows how one relationship is doing. You need both. Without shared rules, partners can’t trust the numbers or act on them. Next, lock these metrics into boundaries, baselines, targets, and data owners so partners report them the same way.
Build a shared measurement system step by step
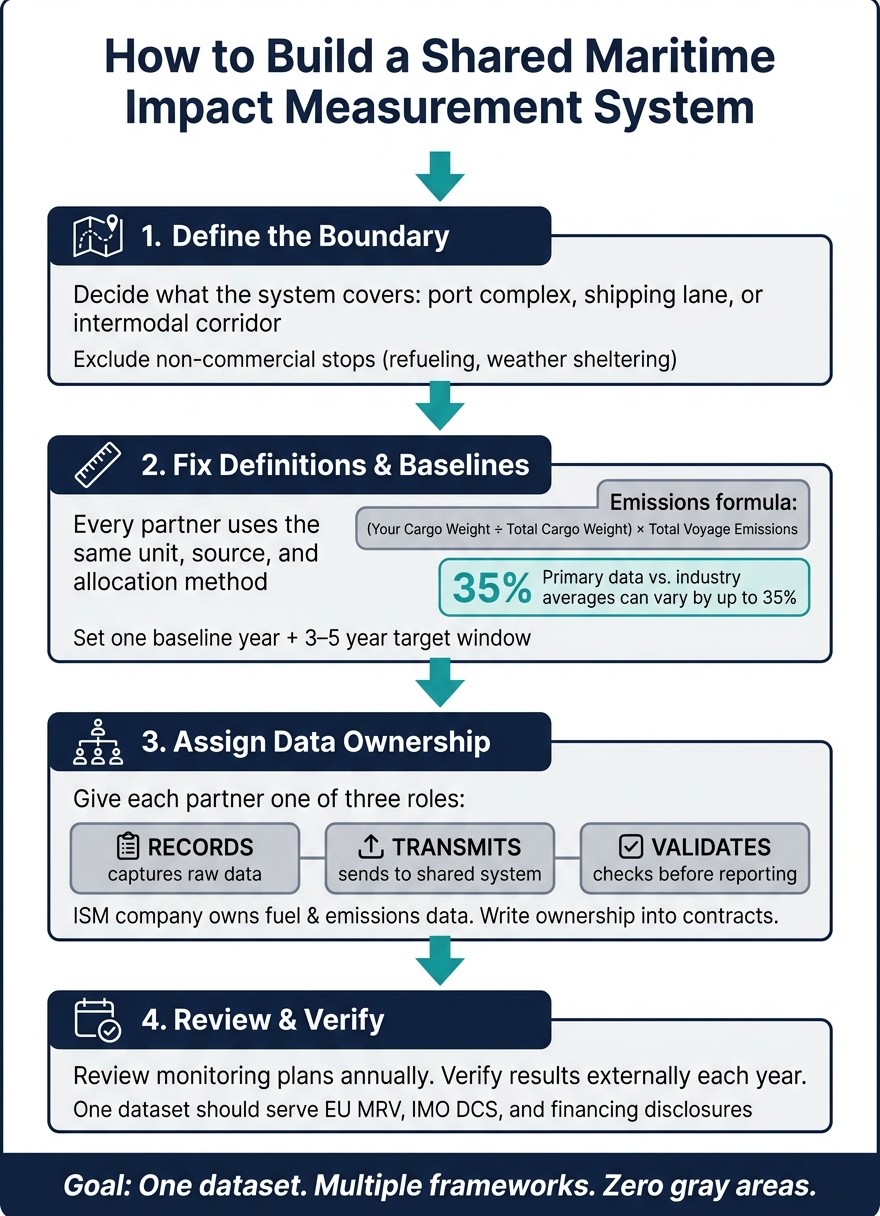
How to Build a Shared Maritime Impact Measurement System
Shared metrics only mean something when everyone plays by the same rules. If partners use different definitions, different baselines, or fuzzy ownership, they can report the same activity in different ways. That’s when comparisons start to fall apart, and trust in the numbers goes with them.
With shared metrics in place, the next job is governance. That’s what keeps the data aligned across partners and over time.
Set boundaries, definitions, baselines, and targets
Start with the boundary. Decide exactly what the system covers: a port complex, a shipping lane, or an intermodal corridor. Leave out non-commercial stops like refueling calls or weather sheltering so the data reflects actual operating performance.
After that, fix the definitions. Every partner should use the same unit, the same source, and the same allocation method. For emissions, that means using primary vessel data and one allocation method across the board. AER-based data is more dependable than industry averages. In practice, primary data can show a variance of up to 35% compared with industry-average estimates [1].
Set one baseline year, then pair it with a 3- to 5-year target window. Review results monthly or quarterly so teams can stay lined up with targets, reporting deadlines, and data checks.
Assign roles for data collection and review
Once the rules are set, assign clear ownership for each step in the data process. In maritime operations, the ISM company - the shipowner or operator with operating responsibility - usually owns fuel and emissions data. Across the rest of the network, ownership should be written into contracts so there’s no gray area.
A simple governance model gives each partner one of three jobs across shippers, carriers, ports, and suppliers:
who records the data
who transmits it into one system
who validates it before it goes into reporting or scorecards
Review monitoring plans every year to reflect fleet changes or method updates, and verify results externally each year. More shippers now treat data-sharing as a formal requirement in Request for Proposal (RFP) processes so carriers provide the AER data needed for Scope 3 reporting [1].
It also helps to design one dataset that can serve EU MRV, IMO DCS, and financing disclosures. That reduces reporting work across the network and makes it much easier to add new partners without rebuilding the data architecture from scratch.
Once governance is in place, the numbers are in a much better position to support credible reporting.
Communicate collective results with evidence, not slogans
Once governance is set and the data can be trusted, the next step is simpler to describe and harder to do well: communication. The numbers stay the same. What changes is the focus for each audience.
Tailor messages for investors, customers, regulators, and partners
Use the same verified figures, but shift the emphasis based on who is reading. Investors look for material ESG results linked to risk reduction and access to financing. Metrics such as Annual Efficiency Ratio (AER) improvement and alignment with Science Based Targets initiative (SBTi) commitments tend to matter most [1]. Customers want plain baselines and a clear method they can use in procurement and reporting. Regulators and port authorities respond best to reporting that is ready for compliance review, with scope and assumptions spelled out. Operating partners need to see the method, the boundary, and how the results were worked out.
A simple structure helps keep reporting sharp: figure, baseline, time frame, scope.
Write stronger impact statements instead of vague claims
Vague claims fall apart because no one can check them. Strong statements do the opposite. They spell out the scope, the method, the partners involved, and the result.
Use this structure: scope, baseline, result, method.
Statement Type | Vague Claim | Strong Impact Statement |
|---|---|---|
Scope & Methodology | "We are committed to green shipping across our entire global network." | "In FY2025, we reduced Scope 3 Cat 4 emissions by 12% vs. a 2023 WTW baseline, covering 95% of ocean lanes using GLEC Tier 2 carrier-reported data." |
Partner Contribution | "Our partners help us achieve low-carbon logistics." | "By selecting carriers with an AER 15% better than the IMO average, we avoided 2,500 tonnes of CO2e in our Shanghai–Rotterdam corridor in 2025." |
This is where many reports get shaky. Hub emissions - loading, unloading, and warehousing dwell - can add 5% to 20% to a shipment's total inventory and are often left out [3]. When you include them, you show rigor. When you leave them out, people start asking questions.
Conclusion: The essentials of collective impact reporting
Once the message fits the audience, finish with what the data can prove. Define shared outcomes, measure them the same way each time, govern the data, and report the results in a form each audience can use.
Companies that follow this sequence build the kind of trust that stands up when investors review green financing, customers make procurement choices, and regulators check compliance. That is the business case for evidence-based reporting.
FAQs
How do we start measuring collective impact with limited partner data?
Start with clear goals and firm boundaries for what you plan to measure. That early step keeps the work focused and helps you avoid a messy, apples-to-oranges data set later on.
If primary data isn't available, use secondary data such as industry-average emission factors from sources like the Clean Cargo Working Group. Just be explicit about it. Label those figures as estimates so no one mistakes them for measured results.
Over time, the aim is to get better data, not just more data. One practical move is to make data-sharing requests a formal part of your RFP process. That sets expectations up front and gives suppliers less room to sidestep the ask.
Frameworks like the GLEC Framework can help here, too. It ranks data quality from primary measured data down to spend-based proxies, which gives teams a simple way to judge how strong their inputs are and where they still need work.
Which shared metrics matter most for maritime and logistics reporting?
Focus on shared metrics that link day-to-day operations with reporting needs. That starts with Scope 1, 2, and 3 emissions, emissions intensity metrics such as grams of CO2e per tonne-nautical mile or per shipment, and AER for vessel performance.
The same approach should cover energy use by source, NOx and SOx, packaging waste and recyclability, workforce safety, accident rates, driver working conditions, and supplier evaluation processes. When teams rely on standardized primary data, reporting stays consistent and easier to trust.
How can we make collective impact claims credible to customers and regulators?
Prioritize data transparency, a rigorous method, and independent verification. Use recognized standards like the GLEC Framework, ISO 14083, and the GHG Protocol Scope 3 Standard so reporting stays consistent, comparable, and defensible.
It also helps to seek independent assurance for environmental KPIs and work with partners to share primary activity data instead of estimates. That gives customers, regulators, and investors more confidence in the numbers and cuts down on vague or unsupported claims.
Related Blog Posts
How to Integrate ESG into Core Business Operations for Maritime & Logistics Companies
How to Measure and Report ESG Impact Effectively for Maritime & Logistics Companies
How to Align Stakeholders Around a Shared ESG Vision for Maritime & Logistics Companies
How to Communicate ESG Progress Credibly for Maritime & Logistics Companies
Latest Articles
©2025

Narrative Change and Power Building: The Missing Half of Advocacy
Narrative change is the process of disrupting dominant narratives that normalize inequity and advancing new narratives from historically marginalized communities.

Funding Resilience Without Federal Grants
BRIC is unreliable and FEMA is shrinking. Here's how cities fund climate resilience with dedicated revenue, blended finance, and a coordinating authority.

The ESG Blind Spot: How AI Is Finding Risks in Companies Nobody Else Is Watching
Norway's sovereign wealth fund uses AI to screen 7,200 portfolio companies for forced labor and corruption within 24 hours. The real story is the emerging-market coverage gap that traditional ESG data vendors miss — and what it means for any company with a global supply chain.
Narrative Change and Power Building: The Missing Half of Advocacy
Narrative change is the process of disrupting dominant narratives that normalize inequity and advancing new narratives from historically marginalized communities.
Funding Resilience Without Federal Grants
BRIC is unreliable and FEMA is shrinking. Here's how cities fund climate resilience with dedicated revenue, blended finance, and a coordinating authority.
The ESG Blind Spot: How AI Is Finding Risks in Companies Nobody Else Is Watching
Norway's sovereign wealth fund uses AI to screen 7,200 portfolio companies for forced labor and corruption within 24 hours. The real story is the emerging-market coverage gap that traditional ESG data vendors miss — and what it means for any company with a global supply chain.
FAQ
01
What does it really mean to “redefine profit”?
02
What makes Council Fire different?
03
Who does Council Fire work with?
04
What does working with Council Fire actually look like?
05
How does Council Fire help organizations turn big goals into action?
06
How does Council Fire define and measure success?
Jun 28, 2026
How to Measure and Communicate Collective Impact for Maritime & Logistics Companies
ESG Strategy
In This Article
Shared measurement—same outcomes, one method, clear data ownership—makes maritime impact claims credible.
How to Measure and Communicate Collective Impact for Maritime & Logistics Companies
If you cannot show who did what, how it was measured, and what changed, your impact claim will not hold up. In maritime and logistics, one shipment can touch carriers, ports, inland partners, and shippers at the same time. That means emissions, safety results, service levels, and community effects are shared across many companies - not owned by one.
I’d boil the article down to this: pick a short list of shared outcomes, use the same rules across partners, assign data owners, and report results with a baseline, method, scope, and time frame. That matters because shipping accounts for about 2.9% of global greenhouse gas emissions, and many shippers now expect better data before they award freight business.
Here’s the plain-English version:
Start with shared outcomes, not software
Focus on a few material topics across emissions, people, and service
Use one method per metric so partners do not report the same move in different ways
Set boundaries, baselines, and targets before public reporting
Assign ownership for recording, sending, and checking data
Match shared data to reporting rules like EU MRV, IMO DCS, GRI, SASB, and ISSB
Write proof-based claims, not broad promises
A few points stand out to me:
Scope 1 for a carrier can also show up as Scope 3, Category 4 for a shipper
For many retail and manufacturing firms, indirect emissions can be more than 80% of total footprint
Primary vessel data can differ by up to 35% from industry-average estimates
Hub activity like loading, unloading, and warehouse dwell can add 5% to 20% to shipment totals
The core message is simple: shared work needs shared measurement. If you want your reporting to stand up with customers, investors, lenders, and regulators, you need numbers that are defined the same way across the network and explained in plain terms.
Sustainability Across the Shipping Supply Chain | SSI| Oceans of Opportunity
Define shared outcomes and material topics before selecting tools
Before you open a dashboard or choose a framework, get clear on the small set of outcomes that matter across your network. That step sounds simple, but it saves a lot of drift later. One study of major port sustainability reports found 151 environmental and social indicators in use. Don’t treat that as a shopping list. Treat it as a warning: too many indicators can blur focus. Start with material topics, then pick the metrics and tools that let partners track them in the same way.
Prioritize environmental, social, and operational outcomes
In maritime and logistics, the topics that matter most tend to fall into three buckets.
Environmental outcomes such as decarbonization progress and climate resilience
Social outcomes such as worker safety, labor conditions, and community impacts
Operational outcomes such as service reliability across the network
Those priorities should match the network’s biggest risks and the places where joint action can produce measurable change. If a topic doesn’t help partners manage shared exposure or improve shared performance, it probably doesn’t belong on the short list.
Map stakeholders and align on shared priorities
Once the outcome categories are set, the next question is practical: whose data and priorities need to be part of the picture? Port authorities, carriers, shippers, suppliers, labor groups, and local communities all see different parts of the system. Each group also brings its own expectations. That’s the line between internal reporting and network-wide impact.
One useful move is to put data-sharing requirements directly into RFPs. That sends a clear signal to carriers and other partners: collective impact measurement is a business expectation, not a nice extra. And that matters more now that the industry is moving away from rough averages and toward voyage-level data, using metrics such as the Annual Efficiency Ratio (AER). As that shift continues, precise data that partners can share and use across the network becomes more important [1].
Align collective metrics with GRI, SASB, and ISSB expectations
Disclosure rules are shifting from voluntary to mandatory. The EU Corporate Sustainability Reporting Directive (CSRD) and U.S. SEC climate rules are pushing companies toward more consistent reporting [2][1]. If your collective metrics line up with GRI, SASB, and ISSB, partners can map shared results to reporting standards they already know.
For operators covered by EU MRV or IMO DCS, shared emissions data should line up with those systems. Put plainly: the emissions data used across the network should match the data reported under those programs.
Regulatory Framework | Scope | Primary Obligation |
|---|---|---|
EU MRV Maritime | Voyages to/from/within EEA ports | Report and verify emissions data |
EU ETS (Maritime) | Voyages to/from/within EEA ports | Surrender emission allowances |
IMO DCS | Global (international shipping) | Report fuel consumption data to flag state |
With outcomes and standards set, the next step is choosing metrics and tools that can track performance across the network.
Choose metrics and tools that work across partners
Once outcomes and standards line up, the next job is more practical: pick metrics that partners can collect and use without piling on extra reporting work. The best place to start is with metrics tied to the same voyage, shipment, or port call. That keeps the data grounded in one shared event instead of a rough estimate spread across many activities.
Environmental and resilience metrics for shared performance
For emissions, use voyage-specific data and one standard allocation method across partners: (Your Cargo Weight ÷ Total Cargo Weight) × Total Voyage Emissions. That gives each partner a clear share of the total. Use shipment-specific data instead of blended estimates for credible reporting [1].
For resilience, stick with operational metrics that every partner can define in the same way and report the same way. If one carrier counts a delay one way and a port counts it another way, the data falls apart fast.
Safety, workforce, and community outcome measures
The same rule applies here: one metric, one definition, one owner. For social outcomes, track measures such as total recordable incident rate, lost-time injuries, training completion, grievance closure time, and local community impact measures.
This may sound simple, but it saves a lot of back-and-forth. When each metric has a clear meaning and a clear owner, teams spend less time arguing over numbers and more time using them.
Dashboards, data architecture, and partner scorecards
A network ESG dashboard pulls shared performance data into one place across shippers, carriers, ports, and suppliers - from voyage emissions to safety incidents to service reliability. A partner scorecard, by contrast, tracks the KPIs tied to one partner relationship.
That split matters. A dashboard shows the whole network. A scorecard shows how one relationship is doing. You need both. Without shared rules, partners can’t trust the numbers or act on them. Next, lock these metrics into boundaries, baselines, targets, and data owners so partners report them the same way.
Build a shared measurement system step by step
How to Build a Shared Maritime Impact Measurement System
Shared metrics only mean something when everyone plays by the same rules. If partners use different definitions, different baselines, or fuzzy ownership, they can report the same activity in different ways. That’s when comparisons start to fall apart, and trust in the numbers goes with them.
With shared metrics in place, the next job is governance. That’s what keeps the data aligned across partners and over time.
Set boundaries, definitions, baselines, and targets
Start with the boundary. Decide exactly what the system covers: a port complex, a shipping lane, or an intermodal corridor. Leave out non-commercial stops like refueling calls or weather sheltering so the data reflects actual operating performance.
After that, fix the definitions. Every partner should use the same unit, the same source, and the same allocation method. For emissions, that means using primary vessel data and one allocation method across the board. AER-based data is more dependable than industry averages. In practice, primary data can show a variance of up to 35% compared with industry-average estimates [1].
Set one baseline year, then pair it with a 3- to 5-year target window. Review results monthly or quarterly so teams can stay lined up with targets, reporting deadlines, and data checks.
Assign roles for data collection and review
Once the rules are set, assign clear ownership for each step in the data process. In maritime operations, the ISM company - the shipowner or operator with operating responsibility - usually owns fuel and emissions data. Across the rest of the network, ownership should be written into contracts so there’s no gray area.
A simple governance model gives each partner one of three jobs across shippers, carriers, ports, and suppliers:
who records the data
who transmits it into one system
who validates it before it goes into reporting or scorecards
Review monitoring plans every year to reflect fleet changes or method updates, and verify results externally each year. More shippers now treat data-sharing as a formal requirement in Request for Proposal (RFP) processes so carriers provide the AER data needed for Scope 3 reporting [1].
It also helps to design one dataset that can serve EU MRV, IMO DCS, and financing disclosures. That reduces reporting work across the network and makes it much easier to add new partners without rebuilding the data architecture from scratch.
Once governance is in place, the numbers are in a much better position to support credible reporting.
Communicate collective results with evidence, not slogans
Once governance is set and the data can be trusted, the next step is simpler to describe and harder to do well: communication. The numbers stay the same. What changes is the focus for each audience.
Tailor messages for investors, customers, regulators, and partners
Use the same verified figures, but shift the emphasis based on who is reading. Investors look for material ESG results linked to risk reduction and access to financing. Metrics such as Annual Efficiency Ratio (AER) improvement and alignment with Science Based Targets initiative (SBTi) commitments tend to matter most [1]. Customers want plain baselines and a clear method they can use in procurement and reporting. Regulators and port authorities respond best to reporting that is ready for compliance review, with scope and assumptions spelled out. Operating partners need to see the method, the boundary, and how the results were worked out.
A simple structure helps keep reporting sharp: figure, baseline, time frame, scope.
Write stronger impact statements instead of vague claims
Vague claims fall apart because no one can check them. Strong statements do the opposite. They spell out the scope, the method, the partners involved, and the result.
Use this structure: scope, baseline, result, method.
Statement Type | Vague Claim | Strong Impact Statement |
|---|---|---|
Scope & Methodology | "We are committed to green shipping across our entire global network." | "In FY2025, we reduced Scope 3 Cat 4 emissions by 12% vs. a 2023 WTW baseline, covering 95% of ocean lanes using GLEC Tier 2 carrier-reported data." |
Partner Contribution | "Our partners help us achieve low-carbon logistics." | "By selecting carriers with an AER 15% better than the IMO average, we avoided 2,500 tonnes of CO2e in our Shanghai–Rotterdam corridor in 2025." |
This is where many reports get shaky. Hub emissions - loading, unloading, and warehousing dwell - can add 5% to 20% to a shipment's total inventory and are often left out [3]. When you include them, you show rigor. When you leave them out, people start asking questions.
Conclusion: The essentials of collective impact reporting
Once the message fits the audience, finish with what the data can prove. Define shared outcomes, measure them the same way each time, govern the data, and report the results in a form each audience can use.
Companies that follow this sequence build the kind of trust that stands up when investors review green financing, customers make procurement choices, and regulators check compliance. That is the business case for evidence-based reporting.
FAQs
How do we start measuring collective impact with limited partner data?
Start with clear goals and firm boundaries for what you plan to measure. That early step keeps the work focused and helps you avoid a messy, apples-to-oranges data set later on.
If primary data isn't available, use secondary data such as industry-average emission factors from sources like the Clean Cargo Working Group. Just be explicit about it. Label those figures as estimates so no one mistakes them for measured results.
Over time, the aim is to get better data, not just more data. One practical move is to make data-sharing requests a formal part of your RFP process. That sets expectations up front and gives suppliers less room to sidestep the ask.
Frameworks like the GLEC Framework can help here, too. It ranks data quality from primary measured data down to spend-based proxies, which gives teams a simple way to judge how strong their inputs are and where they still need work.
Which shared metrics matter most for maritime and logistics reporting?
Focus on shared metrics that link day-to-day operations with reporting needs. That starts with Scope 1, 2, and 3 emissions, emissions intensity metrics such as grams of CO2e per tonne-nautical mile or per shipment, and AER for vessel performance.
The same approach should cover energy use by source, NOx and SOx, packaging waste and recyclability, workforce safety, accident rates, driver working conditions, and supplier evaluation processes. When teams rely on standardized primary data, reporting stays consistent and easier to trust.
How can we make collective impact claims credible to customers and regulators?
Prioritize data transparency, a rigorous method, and independent verification. Use recognized standards like the GLEC Framework, ISO 14083, and the GHG Protocol Scope 3 Standard so reporting stays consistent, comparable, and defensible.
It also helps to seek independent assurance for environmental KPIs and work with partners to share primary activity data instead of estimates. That gives customers, regulators, and investors more confidence in the numbers and cuts down on vague or unsupported claims.
Related Blog Posts
How to Integrate ESG into Core Business Operations for Maritime & Logistics Companies
How to Measure and Report ESG Impact Effectively for Maritime & Logistics Companies
How to Align Stakeholders Around a Shared ESG Vision for Maritime & Logistics Companies
How to Communicate ESG Progress Credibly for Maritime & Logistics Companies
Latest Articles
©2025
Narrative Change and Power Building: The Missing Half of Advocacy
Narrative change is the process of disrupting dominant narratives that normalize inequity and advancing new narratives from historically marginalized communities.
Funding Resilience Without Federal Grants
BRIC is unreliable and FEMA is shrinking. Here's how cities fund climate resilience with dedicated revenue, blended finance, and a coordinating authority.
The ESG Blind Spot: How AI Is Finding Risks in Companies Nobody Else Is Watching
Norway's sovereign wealth fund uses AI to screen 7,200 portfolio companies for forced labor and corruption within 24 hours. The real story is the emerging-market coverage gap that traditional ESG data vendors miss — and what it means for any company with a global supply chain.
FAQ
01
What does it really mean to “redefine profit”?
02
What makes Council Fire different?
03
Who does Council Fire work with?
04
What does working with Council Fire actually look like?
05
How does Council Fire help organizations turn big goals into action?
06
How does Council Fire define and measure success?
Jun 28, 2026
How to Measure and Communicate Collective Impact for Maritime & Logistics Companies
ESG Strategy
In This Article
Shared measurement—same outcomes, one method, clear data ownership—makes maritime impact claims credible.
How to Measure and Communicate Collective Impact for Maritime & Logistics Companies
If you cannot show who did what, how it was measured, and what changed, your impact claim will not hold up. In maritime and logistics, one shipment can touch carriers, ports, inland partners, and shippers at the same time. That means emissions, safety results, service levels, and community effects are shared across many companies - not owned by one.
I’d boil the article down to this: pick a short list of shared outcomes, use the same rules across partners, assign data owners, and report results with a baseline, method, scope, and time frame. That matters because shipping accounts for about 2.9% of global greenhouse gas emissions, and many shippers now expect better data before they award freight business.
Here’s the plain-English version:
Start with shared outcomes, not software
Focus on a few material topics across emissions, people, and service
Use one method per metric so partners do not report the same move in different ways
Set boundaries, baselines, and targets before public reporting
Assign ownership for recording, sending, and checking data
Match shared data to reporting rules like EU MRV, IMO DCS, GRI, SASB, and ISSB
Write proof-based claims, not broad promises
A few points stand out to me:
Scope 1 for a carrier can also show up as Scope 3, Category 4 for a shipper
For many retail and manufacturing firms, indirect emissions can be more than 80% of total footprint
Primary vessel data can differ by up to 35% from industry-average estimates
Hub activity like loading, unloading, and warehouse dwell can add 5% to 20% to shipment totals
The core message is simple: shared work needs shared measurement. If you want your reporting to stand up with customers, investors, lenders, and regulators, you need numbers that are defined the same way across the network and explained in plain terms.
Sustainability Across the Shipping Supply Chain | SSI| Oceans of Opportunity
Define shared outcomes and material topics before selecting tools
Before you open a dashboard or choose a framework, get clear on the small set of outcomes that matter across your network. That step sounds simple, but it saves a lot of drift later. One study of major port sustainability reports found 151 environmental and social indicators in use. Don’t treat that as a shopping list. Treat it as a warning: too many indicators can blur focus. Start with material topics, then pick the metrics and tools that let partners track them in the same way.
Prioritize environmental, social, and operational outcomes
In maritime and logistics, the topics that matter most tend to fall into three buckets.
Environmental outcomes such as decarbonization progress and climate resilience
Social outcomes such as worker safety, labor conditions, and community impacts
Operational outcomes such as service reliability across the network
Those priorities should match the network’s biggest risks and the places where joint action can produce measurable change. If a topic doesn’t help partners manage shared exposure or improve shared performance, it probably doesn’t belong on the short list.
Map stakeholders and align on shared priorities
Once the outcome categories are set, the next question is practical: whose data and priorities need to be part of the picture? Port authorities, carriers, shippers, suppliers, labor groups, and local communities all see different parts of the system. Each group also brings its own expectations. That’s the line between internal reporting and network-wide impact.
One useful move is to put data-sharing requirements directly into RFPs. That sends a clear signal to carriers and other partners: collective impact measurement is a business expectation, not a nice extra. And that matters more now that the industry is moving away from rough averages and toward voyage-level data, using metrics such as the Annual Efficiency Ratio (AER). As that shift continues, precise data that partners can share and use across the network becomes more important [1].
Align collective metrics with GRI, SASB, and ISSB expectations
Disclosure rules are shifting from voluntary to mandatory. The EU Corporate Sustainability Reporting Directive (CSRD) and U.S. SEC climate rules are pushing companies toward more consistent reporting [2][1]. If your collective metrics line up with GRI, SASB, and ISSB, partners can map shared results to reporting standards they already know.
For operators covered by EU MRV or IMO DCS, shared emissions data should line up with those systems. Put plainly: the emissions data used across the network should match the data reported under those programs.
Regulatory Framework | Scope | Primary Obligation |
|---|---|---|
EU MRV Maritime | Voyages to/from/within EEA ports | Report and verify emissions data |
EU ETS (Maritime) | Voyages to/from/within EEA ports | Surrender emission allowances |
IMO DCS | Global (international shipping) | Report fuel consumption data to flag state |
With outcomes and standards set, the next step is choosing metrics and tools that can track performance across the network.
Choose metrics and tools that work across partners
Once outcomes and standards line up, the next job is more practical: pick metrics that partners can collect and use without piling on extra reporting work. The best place to start is with metrics tied to the same voyage, shipment, or port call. That keeps the data grounded in one shared event instead of a rough estimate spread across many activities.
Environmental and resilience metrics for shared performance
For emissions, use voyage-specific data and one standard allocation method across partners: (Your Cargo Weight ÷ Total Cargo Weight) × Total Voyage Emissions. That gives each partner a clear share of the total. Use shipment-specific data instead of blended estimates for credible reporting [1].
For resilience, stick with operational metrics that every partner can define in the same way and report the same way. If one carrier counts a delay one way and a port counts it another way, the data falls apart fast.
Safety, workforce, and community outcome measures
The same rule applies here: one metric, one definition, one owner. For social outcomes, track measures such as total recordable incident rate, lost-time injuries, training completion, grievance closure time, and local community impact measures.
This may sound simple, but it saves a lot of back-and-forth. When each metric has a clear meaning and a clear owner, teams spend less time arguing over numbers and more time using them.
Dashboards, data architecture, and partner scorecards
A network ESG dashboard pulls shared performance data into one place across shippers, carriers, ports, and suppliers - from voyage emissions to safety incidents to service reliability. A partner scorecard, by contrast, tracks the KPIs tied to one partner relationship.
That split matters. A dashboard shows the whole network. A scorecard shows how one relationship is doing. You need both. Without shared rules, partners can’t trust the numbers or act on them. Next, lock these metrics into boundaries, baselines, targets, and data owners so partners report them the same way.
Build a shared measurement system step by step
How to Build a Shared Maritime Impact Measurement System
Shared metrics only mean something when everyone plays by the same rules. If partners use different definitions, different baselines, or fuzzy ownership, they can report the same activity in different ways. That’s when comparisons start to fall apart, and trust in the numbers goes with them.
With shared metrics in place, the next job is governance. That’s what keeps the data aligned across partners and over time.
Set boundaries, definitions, baselines, and targets
Start with the boundary. Decide exactly what the system covers: a port complex, a shipping lane, or an intermodal corridor. Leave out non-commercial stops like refueling calls or weather sheltering so the data reflects actual operating performance.
After that, fix the definitions. Every partner should use the same unit, the same source, and the same allocation method. For emissions, that means using primary vessel data and one allocation method across the board. AER-based data is more dependable than industry averages. In practice, primary data can show a variance of up to 35% compared with industry-average estimates [1].
Set one baseline year, then pair it with a 3- to 5-year target window. Review results monthly or quarterly so teams can stay lined up with targets, reporting deadlines, and data checks.
Assign roles for data collection and review
Once the rules are set, assign clear ownership for each step in the data process. In maritime operations, the ISM company - the shipowner or operator with operating responsibility - usually owns fuel and emissions data. Across the rest of the network, ownership should be written into contracts so there’s no gray area.
A simple governance model gives each partner one of three jobs across shippers, carriers, ports, and suppliers:
who records the data
who transmits it into one system
who validates it before it goes into reporting or scorecards
Review monitoring plans every year to reflect fleet changes or method updates, and verify results externally each year. More shippers now treat data-sharing as a formal requirement in Request for Proposal (RFP) processes so carriers provide the AER data needed for Scope 3 reporting [1].
It also helps to design one dataset that can serve EU MRV, IMO DCS, and financing disclosures. That reduces reporting work across the network and makes it much easier to add new partners without rebuilding the data architecture from scratch.
Once governance is in place, the numbers are in a much better position to support credible reporting.
Communicate collective results with evidence, not slogans
Once governance is set and the data can be trusted, the next step is simpler to describe and harder to do well: communication. The numbers stay the same. What changes is the focus for each audience.
Tailor messages for investors, customers, regulators, and partners
Use the same verified figures, but shift the emphasis based on who is reading. Investors look for material ESG results linked to risk reduction and access to financing. Metrics such as Annual Efficiency Ratio (AER) improvement and alignment with Science Based Targets initiative (SBTi) commitments tend to matter most [1]. Customers want plain baselines and a clear method they can use in procurement and reporting. Regulators and port authorities respond best to reporting that is ready for compliance review, with scope and assumptions spelled out. Operating partners need to see the method, the boundary, and how the results were worked out.
A simple structure helps keep reporting sharp: figure, baseline, time frame, scope.
Write stronger impact statements instead of vague claims
Vague claims fall apart because no one can check them. Strong statements do the opposite. They spell out the scope, the method, the partners involved, and the result.
Use this structure: scope, baseline, result, method.
Statement Type | Vague Claim | Strong Impact Statement |
|---|---|---|
Scope & Methodology | "We are committed to green shipping across our entire global network." | "In FY2025, we reduced Scope 3 Cat 4 emissions by 12% vs. a 2023 WTW baseline, covering 95% of ocean lanes using GLEC Tier 2 carrier-reported data." |
Partner Contribution | "Our partners help us achieve low-carbon logistics." | "By selecting carriers with an AER 15% better than the IMO average, we avoided 2,500 tonnes of CO2e in our Shanghai–Rotterdam corridor in 2025." |
This is where many reports get shaky. Hub emissions - loading, unloading, and warehousing dwell - can add 5% to 20% to a shipment's total inventory and are often left out [3]. When you include them, you show rigor. When you leave them out, people start asking questions.
Conclusion: The essentials of collective impact reporting
Once the message fits the audience, finish with what the data can prove. Define shared outcomes, measure them the same way each time, govern the data, and report the results in a form each audience can use.
Companies that follow this sequence build the kind of trust that stands up when investors review green financing, customers make procurement choices, and regulators check compliance. That is the business case for evidence-based reporting.
FAQs
How do we start measuring collective impact with limited partner data?
Start with clear goals and firm boundaries for what you plan to measure. That early step keeps the work focused and helps you avoid a messy, apples-to-oranges data set later on.
If primary data isn't available, use secondary data such as industry-average emission factors from sources like the Clean Cargo Working Group. Just be explicit about it. Label those figures as estimates so no one mistakes them for measured results.
Over time, the aim is to get better data, not just more data. One practical move is to make data-sharing requests a formal part of your RFP process. That sets expectations up front and gives suppliers less room to sidestep the ask.
Frameworks like the GLEC Framework can help here, too. It ranks data quality from primary measured data down to spend-based proxies, which gives teams a simple way to judge how strong their inputs are and where they still need work.
Which shared metrics matter most for maritime and logistics reporting?
Focus on shared metrics that link day-to-day operations with reporting needs. That starts with Scope 1, 2, and 3 emissions, emissions intensity metrics such as grams of CO2e per tonne-nautical mile or per shipment, and AER for vessel performance.
The same approach should cover energy use by source, NOx and SOx, packaging waste and recyclability, workforce safety, accident rates, driver working conditions, and supplier evaluation processes. When teams rely on standardized primary data, reporting stays consistent and easier to trust.
How can we make collective impact claims credible to customers and regulators?
Prioritize data transparency, a rigorous method, and independent verification. Use recognized standards like the GLEC Framework, ISO 14083, and the GHG Protocol Scope 3 Standard so reporting stays consistent, comparable, and defensible.
It also helps to seek independent assurance for environmental KPIs and work with partners to share primary activity data instead of estimates. That gives customers, regulators, and investors more confidence in the numbers and cuts down on vague or unsupported claims.
Related Blog Posts
How to Integrate ESG into Core Business Operations for Maritime & Logistics Companies
How to Measure and Report ESG Impact Effectively for Maritime & Logistics Companies
How to Align Stakeholders Around a Shared ESG Vision for Maritime & Logistics Companies
How to Communicate ESG Progress Credibly for Maritime & Logistics Companies
Latest Articles
©2025
Narrative Change and Power Building: The Missing Half of Advocacy
Narrative change is the process of disrupting dominant narratives that normalize inequity and advancing new narratives from historically marginalized communities.
Funding Resilience Without Federal Grants
BRIC is unreliable and FEMA is shrinking. Here's how cities fund climate resilience with dedicated revenue, blended finance, and a coordinating authority.
The ESG Blind Spot: How AI Is Finding Risks in Companies Nobody Else Is Watching
Norway's sovereign wealth fund uses AI to screen 7,200 portfolio companies for forced labor and corruption within 24 hours. The real story is the emerging-market coverage gap that traditional ESG data vendors miss — and what it means for any company with a global supply chain.
FAQ
What does it really mean to “redefine profit”?
What makes Council Fire different?
Who does Council Fire work with?
What does working with Council Fire actually look like?
How does Council Fire help organizations turn big goals into action?
How does Council Fire define and measure success?