
Oct 10, 2026 · 10 min read
ESG Strategy
In This Article
Evaluates how stakeholder participation shapes materiality assessments—coverage, biases, evidence, and linking input to decisions.
Study Summary: Stakeholder Engagement in Materiality Assessment
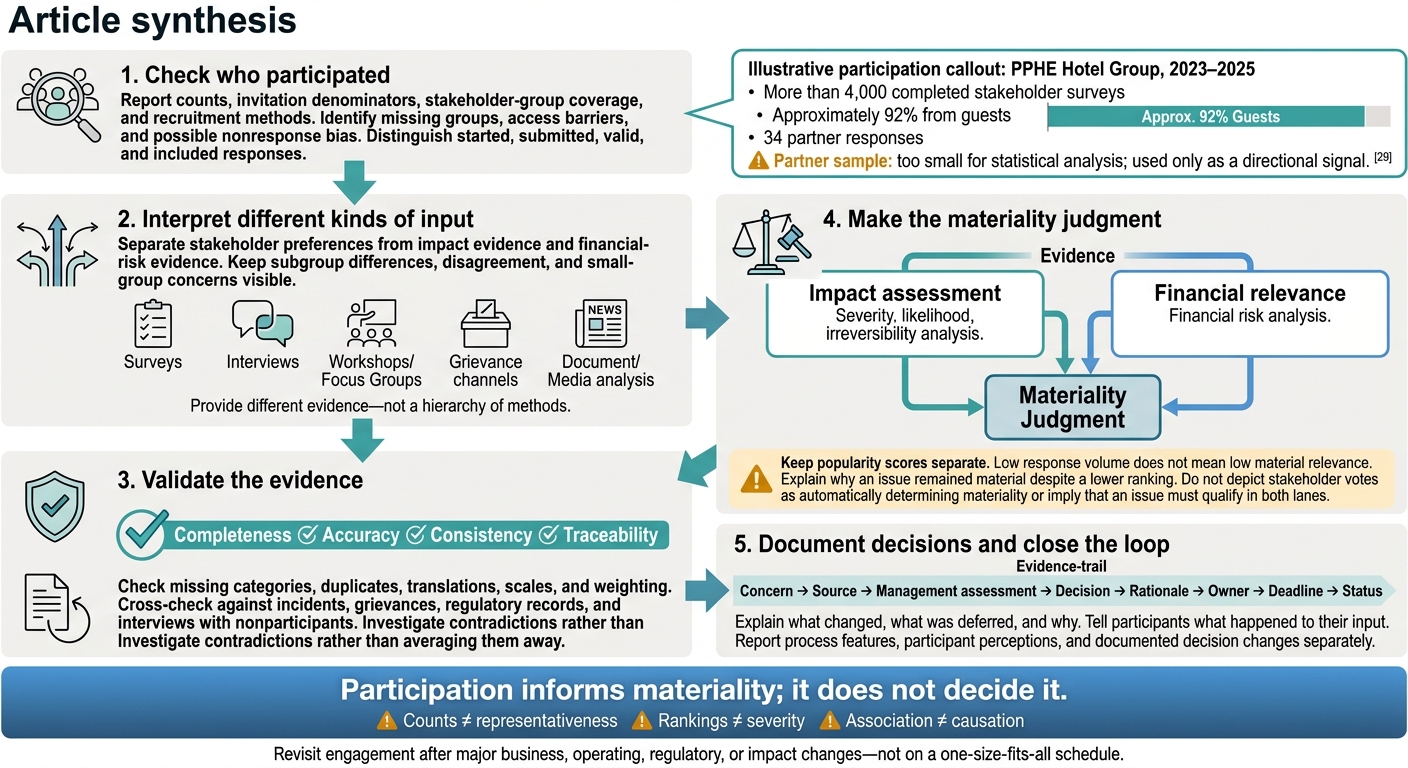
I would judge stakeholder engagement by whose views shaped the decision - not by how many people responded. PPHE Hotel Group reported more than 4,000 completed surveys in 2023–2025, but about 92% came from guests, with only 34 partner responses. That gap shows why counts need context.
In this review, I focus on three questions you can use to assess the findings:
Who took part - and who was missing? Check group coverage, response rates, access barriers, and possible nonresponse bias.
What did the input tell us? Separate stakeholder preferences from impact severity and financial risk. Keep disagreement and small-group concerns visible.
What changed? Trace input through data checks, final judgments, and actions. Report participant perceptions separately from process claims.
My takeaway: <u>participation informs materiality; it does not decide it</u>. Surveys, interviews, and other methods provide different kinds of input, and research linking engagement to stronger assessments shows association - not proof of cause.
Stakeholder Engagement: From Input to Materiality Decisions
Materiality Assessments – Building Trust with systematic stakeholder engagement
sbb-itb-8baf5f1
Participation Patterns and Response Rates
Participation data help show whether materiality findings draw on a broad enough base of stakeholder input to trust.
Response Counts, Coverage, and Nonresponse
In 2023–2025, PPHE Hotel Group reported more than 4,000 completed stakeholder surveys, approximately 92% from guests and only 34 from partners; PPHE said the partner sample was too small for statistical analysis and was used only as a directional signal.[15] These counts highlight uneven stakeholder coverage and shape how much weight each group can carry in later rankings.
Compare participation across stakeholder categories. Record missing materially affected groups, refusals, undeliverable invitations, partial responses, and withdrawals. If data on respondents and nonrespondents are unavailable, state that nonresponse bias could not be assessed.
Document invitation sources, intermediaries, prior ties, language options, translation support, accessibility features, completion time, and survey mode. These may create barriers, but they are not proven causes of participation gaps. Recruiting through established contacts may improve access while overrepresenting people already engaged with the organization.
What Participation Metrics Tell Us
Participation metrics are evidence of sample quality - not proof of materiality.
| Metric | What it can show | What it cannot establish |
|---|---|---|
| Response rate | Share of an invited or eligible sample that completed the stated response type | Representativeness, balanced stakeholder influence, or trust |
| Completed responses | Number meeting the study’s completion rule | Whether affected or less-visible groups were included |
| Stakeholder-group coverage | Which identified categories participated and how responses are distributed among them | Whether every materially affected group was reached or adequately represented |
| Interview or workshop participation | Attendance, completed sessions, and opportunities for dialogue | Population-wide agreement or representativeness |
| Repeat-engagement rate | Share returning for a later stage | Trust, satisfaction, or independence |
Publish invitation denominators, recruitment methods, stakeholder categories, completion definitions, and the assessment stage alongside these metrics. Distinguish started, submitted, valid, and included responses, and explain exclusions and how missing data were handled. Report survey counts separately from interview and workshop attendance. For repeat engagement, clarify whether the denominator includes previous participants, eligible follow-up participants, or everyone originally invited.[13][14]
Long surveys, unfamiliar terms, forced-response items, and complex ranking tasks can reduce participation. Describe dropout patterns without treating them as proof of cause. Where data allow, check patterns by language, device, disability access needs, and survey mode to identify gaps that may weaken confidence in issue rankings. Then examine whether the groups that responded ranked the same issues as material.
How Stakeholder Priorities Differ
Once stakeholders have participated, the next step is to interpret their input. Each group brings a different kind of evidence.
What Each Stakeholder Group Can Contribute
Priorities reflect each group’s relationship with the organization - not a universal ranking. Research does not support one comparable ranking across stakeholder groups or sectors.[12] The table below is an analytical framework, not an empirical finding. Its categories overlap, and people within the same group may disagree.
Read stakeholder input by the type of evidence it provides, not by the number of votes it receives.
| Stakeholder group | What the group adds | Main blind spot | Communication takeaway |
|---|---|---|---|
| Management and internal functions | Operational incidents, controls, and dependencies | External impacts beyond internal metrics | Show how external evidence challenged internal conclusions |
| Employees and workers’ representatives | Workplace safety, pay, and labor conditions | Differences across sites, roles, and employment status | Report coverage and subgroup differences |
| Affected communities | Firsthand evidence of health, land, water, and livelihood impacts | Experiences silenced by access barriers or fear of retaliation | Highlight severe or irreversible harms, even in small groups |
| Investors and lenders | Financial risks and access to capital | Impacts not reflected in financial outcomes | Separate financial-risk evidence from impact evidence |
| Customers and users | Product safety, accessibility, and privacy | Heavy users may not represent excluded or vulnerable users | Distinguish preferences from impact evidence |
| Suppliers and value-chain partners | Upstream conditions and sourcing risks | Disclosure constrained by commercial dependence | Explain confidentiality protections and corroboration |
| Regulators and public authorities | Legal duties and public-risk evidence | Emerging impacts outside their mandates | Distinguish compliance from assessment completeness |
| Civil society and subject-matter experts | Specialist research and underrepresented perspectives | Coverage limited by defined mandates | Explain expertise, representation limits, and cross-checks |
These differences matter because materiality rests on severity and evidence, not average preference.
Define assessment quality before measuring it. Studies may rely on disclosure scores, reviewer judgments, or completeness checks. Better disclosure alone does not prove better identification of impacts. Useful checks include coverage of affected groups, consistent assessment criteria, preservation of minority concerns, and documented changes made after engagement.
One empirical study reported a positive association between stakeholder engagement and the materiality level at the 5% significance level.[19]
That finding shows an association - not proof that engagement caused the improvement. Larger, more mature, better-resourced, or more sustainability-oriented organizations may both engage more stakeholders and produce stronger assessments. Reverse causality is also possible.
Why Rankings Do Not Establish Materiality
Averages can hide disagreement and dilute severe harm affecting fewer people. Keep popularity scores separate from severity, likelihood, irreversibility, and financial analysis.[6][11][18][20] Communication teams should connect each decision to affected groups, supporting evidence, impact criteria, and financial analysis where relevant. They should also explain why an issue remained material despite a lower ranking.
Separate guidance from legal duties. EFRAG’s nonbinding implementation guidance explains how affected-stakeholder input can inform and validate impact assessments.[10][17] ESRS and EFRAG set disclosure expectations, but they do not prescribe a single engagement method; reporting duties depend on the applicable regime.[7][16][18] Communication teams should show how each stakeholder view shaped the final judgment.
Trust Signals and Data Quality
Response counts show reach; trust signals show whether participants trusted the process and whether their input supports the findings.
Clear Processes, Access, and Feedback
Disclosure alone does not prove trust. Report process features, stakeholder perceptions, and documented decision changes separately. A defensible materiality call needs reliable input that can be traced to its source. Ask participants directly whether they felt safe, understood the purpose, felt the process treated them fairly, believed their views were represented accurately, and would participate again. Report respondent counts, scales, missing answers, and differences between subgroups.
State whether consultation serves issue discovery, impact assessment, ranking, or validation. Identify the stakeholder categories invited and those that participated, along with selection criteria and dates. Explain rating-scale endpoints, time horizons, and what higher scores mean.
Make data protections clear: whether responses are confidential or anonymous, who can access raw data, how long records are kept, and how quotes are protected. Describe safeguards against retaliation.
AA1000 guidance treats responsiveness as acting on stakeholder issues through decisions, actions, performance, and communication.[21] For recordkeeping, maintain a response matrix that links each concern to its source, management assessment, decision, rationale, owner, deadline, and status. Separate stakeholder statements from management interpretations, and record both agreement and dissent. State what changed, what was deferred, and why.
Method Strengths, Biases, and Cross-Checks
Choose methods for the evidence you need - not to place one method above another. Each has limits and reveals different kinds of evidence. Grievance records and media coverage can expose overlooked harms, but neither replaces representative engagement. Access, safety, awareness, publicity, and power all shape what becomes visible.
| Method | Strongest use | Principal bias | Evidence produced | Triangulation role |
|---|---|---|---|---|
| Surveys | Comparable ratings across a defined population | Nonresponse, self-selection, wording, literacy, and mode effects | Ratings, subgroup patterns, comments | Checks how widely themes occur and supports subgroup comparisons |
| Interviews | Sensitive experiences and detailed explanations | Selective recruitment and interviewer interpretation effects | Narratives, mechanisms, emerging concerns | Explains survey patterns and identifies omitted issues |
| Workshops | Shared issue framing and proposed actions | Dominant voices and facilitator influence | Priority rationales, disagreements, proposals | Tests priorities through discussion |
| Focus groups | Group norms and shared perceptions | Conformity and limited confidentiality | Interactive themes and differing views | Adds social context to individual responses |
| Grievance channels | Specific harms and unresolved complaints | Underreporting, retaliation fears, uneven access | Allegations, case status, recurrence data | Flags concerns requiring investigation |
| Document or media analysis | Historical context and external scrutiny | Source selection, publicity bias, outdated records | Records, public claims, issue chronology | Checks primary evidence and identifies gaps |
Before publication, confirm that each ranking can be traced to source evidence. Test completeness, accuracy, consistency, and traceability. Check for missing categories, incomplete responses, duplicate records, inconsistent translations, changed scales, unexplained weighting, and merged responses from groups with different interests.
Record how topics were preselected and whether participants could add concerns. Preserve questions, scale definitions, weighting rules, and dissent. Explain normalization choices and test alternative weights.
Cross-check findings against incidents, grievances, regulatory records, and interviews with nonparticipants. Investigate contradictions rather than averaging them away. Keep enough source records to reconstruct the final ranking.
What the Findings Mean for Communication Teams
Report Participation and Its Role in Decisions
Report coverage, not just counts. Publish response counts and denominators for each stakeholder group. Include methods, geographic or organizational coverage, and participation timing. State who was not reached and who was reached only through intermediaries or desk research.[22][12]
Examples include workers consulted through unions, communities represented by NGOs, or stakeholders represented only through desk research.
Show where groups disagreed. Combining responses can hide important differences.[22][12]
Link participation to decisions and actions. Show how participation data moved through interpretation, the evidence used, the final materiality judgment, and disclosure. Explain whether stakeholder input identified a concern, changed its priority, or confirmed an existing conclusion - and what actions followed. Under double materiality, stakeholder input informs the assessment but does not determine the final decision.[22][25]
Assign clear review roles. Sustainability teams assess impacts; risk and finance assess financial relevance; data teams manage sampling and quality; legal reviews claims and confidentiality; and communications explains the process and its limits. Cross-functional review must distinguish low response volume from low material relevance. Metrics alone do not prove materiality.
What the Research Cannot Establish
Participation data provides context, not proof. The research has limits that communication teams need to make clear.
Response rates do not measure quality. Comparisons work only when the sampling frame, recruitment method, denominator, eligibility rules, timing, incentives, and completion definition match. Large counts and high rates do not establish representative coverage. Rankings reflect respondents’ priorities, not impact severity or financial importance.[12]
Self-reported disclosures establish what organizations claim - not whether participation was candid or decisions changed. Keep missing groups, proxy representation, unresolved disagreement, and weak links to decisions visible. Regulatory guidance is not evidence of better engagement outcomes.[23][24][22]
Conclusion: 3 Takeaways for Communication Teams
The evidence points to three priorities for communication teams.
Put participation counts in context: Include coverage, nonresponse, and access details. Explain language accommodations and steps taken to address barriers tied to culture and power.[8]
Keep disagreement visible: Show where stakeholder groups differ, especially those most affected. If direct consultation isn’t possible, identify the trusted proxies who contributed and explain why they were selected.[9]
Link input to documented decisions: Keep an evidence trail connecting stakeholder concerns to data, criteria, decisions, and owners. Then tell participants what changed, what didn’t, and why.[1][4][5]
Revisit engagement after major business, operating, regulatory, or impact changes. Let risk and changes among stakeholders guide the timing - not a one-size-fits-all schedule.[26]
FAQs
How should we weight unequal stakeholder responses?
Use a systematic approach, rather than relying on anecdotes or personal judgment [1]. Look for recurring themes, areas of agreement, and disagreements across groups [2][1]. Weigh each group’s standing - for example, whether input comes from a directly affected community or a distant industry association [1].
Prioritize inputs using your materiality assessment criteria, including impact severity, financial magnitude, and likelihood [2]. Document trade-offs openly in your disclosures so readers can see how you handled competing perspectives [2][1].
What if stakeholders disagree on a material issue?
Disagreement is normal. The goal is understanding, not consensus: consider each perspective and how it relates to your materiality objectives. Use established criteria - impact severity, financial magnitude, and likelihood - to set priorities you can justify.
Document disagreements openly. In your disclosures, explain how you weighed competing views and reached final decisions. Follow up with participants and acknowledge differences to build trust and maintain the quality of engagement.
How can we verify that engagement changed decisions?
Keep a centralized engagement log that records participants, topics discussed, and outcomes [1][2]. Make the connection clear between stakeholder input and business priorities or materiality determinations [3].
Close the feedback loop by explaining how that input shaped decisions - and, when you chose a different direction, why [1][2][3]. This transparency builds trust and provides evidence that assurance providers and regulators can review and verify [1][2][3][4][5].



FAQ