In This Article
How industrial symbiosis matches surplus water, heat, gypsum and residues to users—check fit, costs, contracts, and measurements.
On this page
Kalundborg Symbiosis Turns Waste Streams Into Inputs
I see Kalundborg’s main lesson this way: match surplus resources to a buyer’s needs before building the connection. Water, steam, heat, gypsum, refinery gas, and biological residues can replace purchased inputs - but only when quality, delivery, contracts, and legal requirements line up.
The scale matters: Kalundborg Refinery’s 2024 report lists annual network savings of about 1.06 billion gallons of groundwater, alongside 586,000 metric tons of CO₂ avoided and 62,000 metric tons of waste materials recycled. These reported figures are separate from older modeled cost savings.
For your own project, I’d start with three checks:
Confirm the fit: Match supply, quality, timing, and permits to the receiver’s needs.
Count the full cost: Include treatment, transport, maintenance, infrastructure, and backup supply.
Verify the result: Track accepted, rejected, stored, and disposed quantities separately.
My takeaway: <u>moving a byproduct does not prove waste reduction</u>. Measure what it replaces - and what still needs disposal - before calling the exchange a success.
Industrial symbiosis in Kalundborg: turning waste into a resource
sbb-itb-8baf5f1
Documented Resource Flows Between Partners
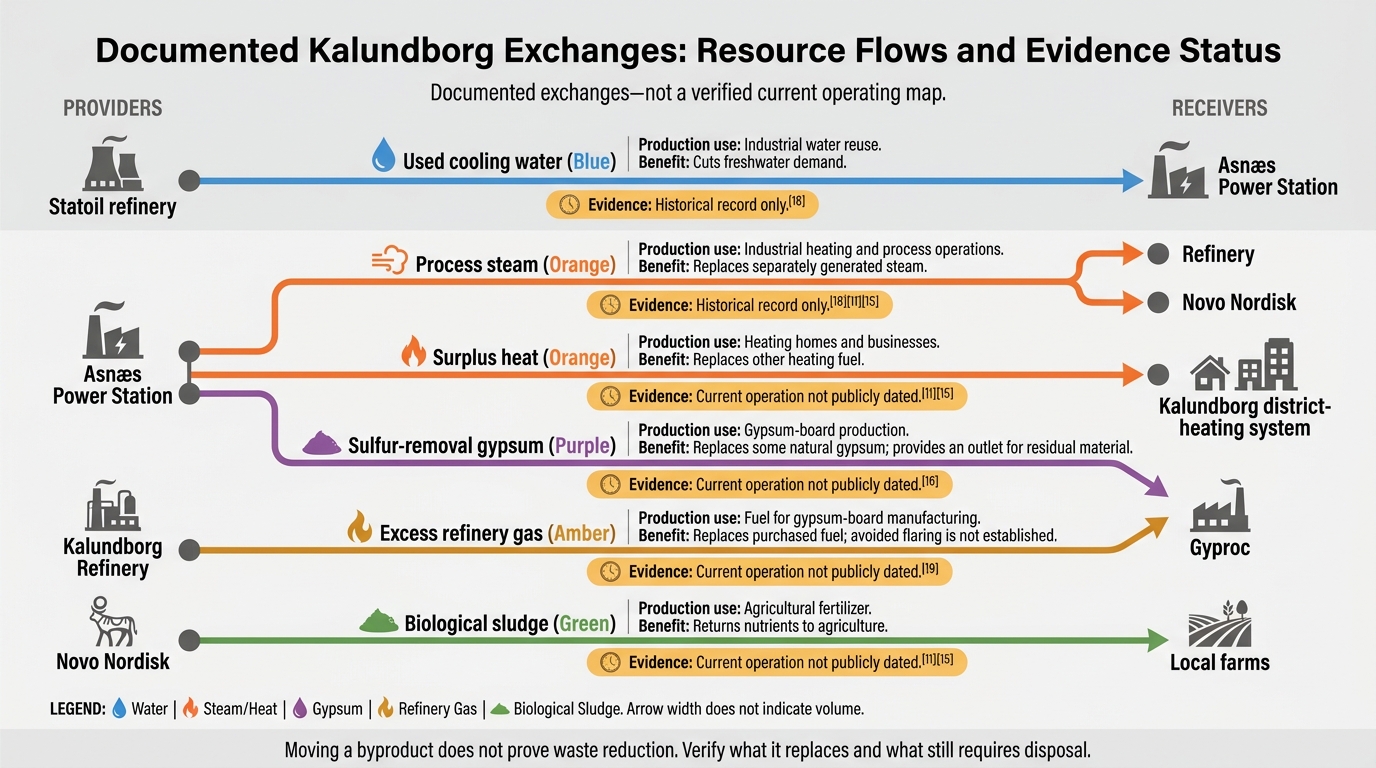
Kalundborg Symbiosis: How Resource Exchanges Work
The table separates documented exchanges from pathways without publicly dated confirmation of current use. Each row shows how one partner’s surplus serves as another’s input. Putting these streams to use means matching them with a plant that needs the right volume and quality at the right time.
| Provider | Resource stream | Receiving partner | Production use | Input reduction or disposal benefit | Evidence and operating status |
|---|---|---|---|---|---|
| Statoil refinery | Used cooling water | Asnæs Power Station | Industrial water reuse | Cuts freshwater demand | Historical record only.[10] |
| Asnæs Power Station | Process steam | Refinery and Novo Nordisk | Industrial heating and process operations | Replaces separately generated steam | Historical record only.[10][6][8] |
| Asnæs Power Station | Surplus heat | Kalundborg district-heating system | Heating homes and businesses | Replaces other heating fuel | Current operation not publicly dated.[6][8] |
| Asnæs Power Station | Sulfur-removal gypsum | Gyproc | Gypsum-board production | Replaces some natural gypsum; provides an outlet for residual material | Current operation not publicly dated.[9] |
| Kalundborg Refinery | Excess refinery gas | Gyproc | Fuel for gypsum-board manufacturing | Replaces purchased fuel; avoided flaring is not established | Current operation not publicly dated.[11] |
| Novo Nordisk | Biological sludge | Local farms | Agricultural fertilizer | Returns nutrients to agriculture | Current operation not publicly dated.[6][8] |
Water, Steam, and Surplus Heat
These exchanges reduce the need for freshwater and purchased energy. District heating is a use case, not a disposal claim. Material exchanges require stricter quality checks than energy exchanges.
Gypsum, Mineral Materials, and Refinery Gas
Reused gypsum replaces mineral inputs in production, while burning refinery gas supplies fuel.[9][11]
Biological Residues and Process Materials
Acceptance depends on nutrient content, contaminants, permits, handling, and agricultural demand. Record these conditions with the receiving farm or organization: they determine which exchanges can grow in scale and which remain local byproduct uses.
Matching Resource Supply With Demand
Kalundborg’s exchanges grew gradually among nearby industrial and public-sector partners.[12][13] For the documented streams, replacing virgin inputs and cutting disposal depends on matching supply and demand with delivery conditions.
Volume, Timing, and Delivery Infrastructure
Compare the supplier’s stream composition, quantity, temperature, variability, and location with the receiver’s input needs and production schedule. Where data is available, gather at least 12 months of measurements covering peak flows, seasonal changes, maintenance shutdowns, and outages. This helps separate dependable supply from occasional surplus. Annual totals alone won’t tell you whether daily deliveries will be reliable. These measurements establish whether a stream is technically usable before money goes into the exchange.
Map the actual pipeline or road route, connection points, access rights, and treatment needs. The investment estimate should cover pumps, metering, storage, transport, maintenance, and backup capacity. Storage can bridge timing gaps, but it can’t turn an unreliable stream into a dependable one. Size infrastructure around committed deliveries, not maximum theoretical output, unless a sound expansion plan supports the extra capacity.
Contracts and Partner Coordination
Weigh savings from avoided disposal charges and replacement purchases, along with supply-security benefits, against treatment, delivery, infrastructure, and backup costs. Agreements should spell out pricing, investment ownership, maintenance duties, delivery quantities and schedules, measurement rules, change notices, and dispute resolution.
Partners should agree on what data to share, protect sensitive production information, and use the same sampling and metering methods. Update supply and demand records whenever facilities expand, processes change, or streams disappear. Once the exchange is defined, check whether the material meets the receiver’s quality, safety, and permit limits.
Quality Requirements, Supply Risks, and Remaining Waste
Matching volume and timing is only part of the job. Each stream must also meet the receiver’s technical and legal limits.
Input Specifications and Legal Requirements
Each stream needs its own acceptance criteria. Water and steam may need set limits for temperature, pressure, flow rate, treatment level, and chemical composition. Mineral inputs such as gypsum may need limits on moisture, particle size, impurities, and composition. Biological residues may need checks on nutrient content, pathogen controls, contaminant limits, and consistent application characteristics. Operators verify these criteria; published limits are not available for every exchange.[6][14]
Some partners pre-treat wastewater before sending it to Kalundborg Utility for final treatment.[16]
Under the EU Waste Framework Directive, by-product status requires all four conditions: a specific intended use, direct use without processing beyond normal industrial practice, production as an integral part of a process, and lawful use without overall environmental or health harm.[15][17]
Risk Controls and Backup Supply
A disrupted exchange affects both partners: the receiver may lose an input, while the supplier loses an outlet.[18] For Kalundborg’s documented water, steam, gypsum, gas, and biological-residue exchanges, quality, continuity, and legal status determine whether resources remain usable or need treatment or disposal.
Technical suitability is the first test. Reliable supply is the next.
| Risk | Operational effect | Management control | Evidence status |
|---|---|---|---|
| Quality variation or contamination | Rejected inputs, unstable processes, extra treatment, or downtime | Specifications; sampling and testing; pre-treatment; acceptance and rejection procedures | Wastewater pre-treatment is documented; a universal rejection protocol is not. |
| Supply interruption or volume fluctuation | Receiver loses input; supplier accumulates surplus | Outage alerts; backup inputs or outlets; standby supply; emergency storage | Dependency and standby-supply risks are documented; backup capacity needs verification. |
| Infrastructure failure | Pipelines, treatment, storage, or transfer systems become unavailable | Preventive maintenance; isolation; temporary transport; spare capacity | Shared treatment infrastructure is documented; redundancy needs verification. |
| Regulatory noncompliance or misclassification | Stopped shipments, permit breaches, treatment obligations, or liability disputes | Classification checks; permits; traceability; testing; assigned responsibility | EU by-product conditions and regulatory coordination are documented; permit details are stream- and facility-specific. |
| Rejected, excess, or unusable material | Residuals need treatment, recycling, storage, or disposal | Assigned costs and responsibility; approved disposal routes; mass-balance reporting | Disruption can turn a by-product back into waste; public aggregate remaining-waste data are unavailable. |
Avoided disposal does not equal zero waste. Accepted, rejected, stored, and disposed quantities must be tracked separately. Public sources provide neither a consolidated rejection rate nor a remaining-waste total, so they do not support a zero-waste claim.
The next section measures how these exchanges translate into resource savings and financial results.
Measuring Resource Savings and Financial Results
Baselines, Dates, and Reported Results
Once resource flows are mapped, separate savings by source, year, and accounting method. The 2018 life-cycle assessment used 2015 flows as its modeling baseline; its estimates are not current audited results. It estimated DKK 182 million in annual company savings and DKK 106 million in annual societal benefits, including avoided public-sector waste-management costs. Keep these categories separate rather than adding them together.[7][5]
Kalundborg Refinery’s 2024 sustainability report offers a later, separate snapshot. It reports annual network metrics of approximately 4 million cubic meters of groundwater saved - about 1.06 billion U.S. gallons - 586,000 metric tons of CO₂ avoided, and 62,000 metric tons of recycled waste materials.[19]
Resource categories also need clear boundaries. A technical summary of the 2015-based assessment reports more than 3.6 million cubic meters of drinking-water savings. Only about 343,000 cubic meters is attributed to exchanges, co-production, and avoided process cooling. The summary separately reports nearly 90,000 metric tons diverted from landfill and just under 18,000 MWh saved through mutual resource use.[5]
For each exchange, record its volume, year, displaced input or disposal route, and whether the result is measured, calculated, or modeled. Calculate net savings after treatment, transport, maintenance, backup supply, and infrastructure costs, then assign costs and benefits to each partner. Network totals alone cannot show which exchanges paid back and which did not; that requires exchange-level records.[7][5]
The next question is which design and governance choices help these savings last.
Conclusion: What Makes Resource Exchanges Work
Kalundborg’s lesson is simple: byproducts become inputs only when technical fit, logistics, and governance line up.[4][3] For water, steam, gypsum, refinery gas, and biological residues, the receiver’s process determines whether the surplus can be used.
Track results for each exchange. Record the source, quantity, composition, receiver, date range, and avoided disposal route. Verify actual use, and account separately for accepted, rejected, stored, and disposed material - including any new residual waste. Moving material alone does not prove that disposal has decreased.
Steps for Regional Planning
Map material streams, test quality, run pilots, set contracts, and monitor shared operating data. Start small, check performance, and scale only exchanges that have proved they work.
FAQs
Can small businesses use industrial symbiosis?
Yes. Small businesses can start with one exchange and an anchor tenant with a steady waste stream, rather than invest in large infrastructure projects [1]. In the United States, regional manufacturing extension partnerships and utility collaborations can help connect businesses with partners [1].
Making these exchanges work requires auditing waste streams, finding nearby partners, and meeting agreed-upon material quality and offtake requirements - the terms for accepting materials. These steps help keep exchanges reliable and repeatable [1][2].
How do I find a reliable byproduct buyer?
Start with a waste stream audit: record how much waste you produce, what it contains, and when it becomes available. Then look for buyers in local industrial clusters or regional manufacturing networks. Digital platforms can match producers with buyers based on material specifications, transport distance, and whether the exchange makes financial sense.
Regional development agencies or industrial symbiosis facilitators can help vet partners, agree on quality standards, and put formal agreements in place for reliable, long-term exchanges.
Can Kalundborg’s model work under U.S. waste laws?
Yes, but U.S. firms need to make major adjustments. They face fragmented infrastructure, fierce competition, and overlapping federal and state regulations that often classify useful byproducts as waste.
Local approaches include policy advocacy, state-level grants, tax incentives, and simpler permitting processes. To put the model into practice, firms can identify secondary materials that meet specific quality standards and use digital tools to match supply with demand.
FAQ