Sep 29, 2026 · 14 min read
Sustainability Strategy
In This Article
Explains the EU's 2023 circular economy monitoring: 11 indicators across five dimensions, shifting focus to footprints, emissions, and resilience.
EU Circular Economy Policy: Indicator Review
The short answer: the EU’s 2023 circular economy framework is not just about recycling anymore. It now tracks 11 indicators across 5 dimensions, and the big shift is this: the EU moved from looking mostly at waste and recycled materials to also looking at material footprint, consumption footprint, production-related greenhouse-gas emissions, resource productivity, and import dependence.
If I had to boil the article down for you, I’d say this:
2018 framework: 10 indicators in 4 dimensions
2023 framework: 11 indicators in 5 dimensions
Main change: the EU added a new dimension on global sustainability and resilience
Main lesson: these indicators show trends, not legal compliance
Best local use: build a small dashboard tied to decisions, owners, data quality, and update timing
What matters most is not the number of indicators. It’s the shift in what the EU is trying to measure. The framework now asks:
Are we generating less waste?
Are we recycling more?
Are recycled materials replacing virgin inputs?
Are jobs, patents, and investment linked to circular activity?
How much material demand sits behind consumption, including imports?
How exposed is the economy to imported materials?
How do production-related emissions fit into the picture?
That is the core point: the EU now treats circular economy policy as a materials, trade, emissions, and resilience issue, not only a waste issue.
A few points stand out right away:
A high recycling rate does not prove strong circular performance
GDP-based efficiency ratios can improve even when total material use does not fall
Some EU indicators are modeled and may only be available at the EU-wide level
Repair, reuse, durability, and product life extension are still weak spots in the framework
Local U.S. programs should use the logic of the EU model, not copy every measure line by line
#EUCircularTalks: Measuring Circular Economy Impacts in Cities and Regions
sbb-itb-8baf5f1
Quick comparison
| Version | Indicator count | Dimension count | Main focus |
|---|---|---|---|
| 2018 | 10 | 4 | Production/consumption, waste, secondary materials, jobs/innovation |
| 2023 | 11 | 5 | All 2018 areas plus footprints, emissions, and material dependence |
For me, the biggest takeaway is simple: good monitoring is not the same as proving compliance. If you’re building a local or company-level system, you need both a trend dashboard and a separate record of legal duties, proof, deadlines, and follow-up actions.
That’s the lens I’d use to read the full article.
How the EU monitoring framework evolved
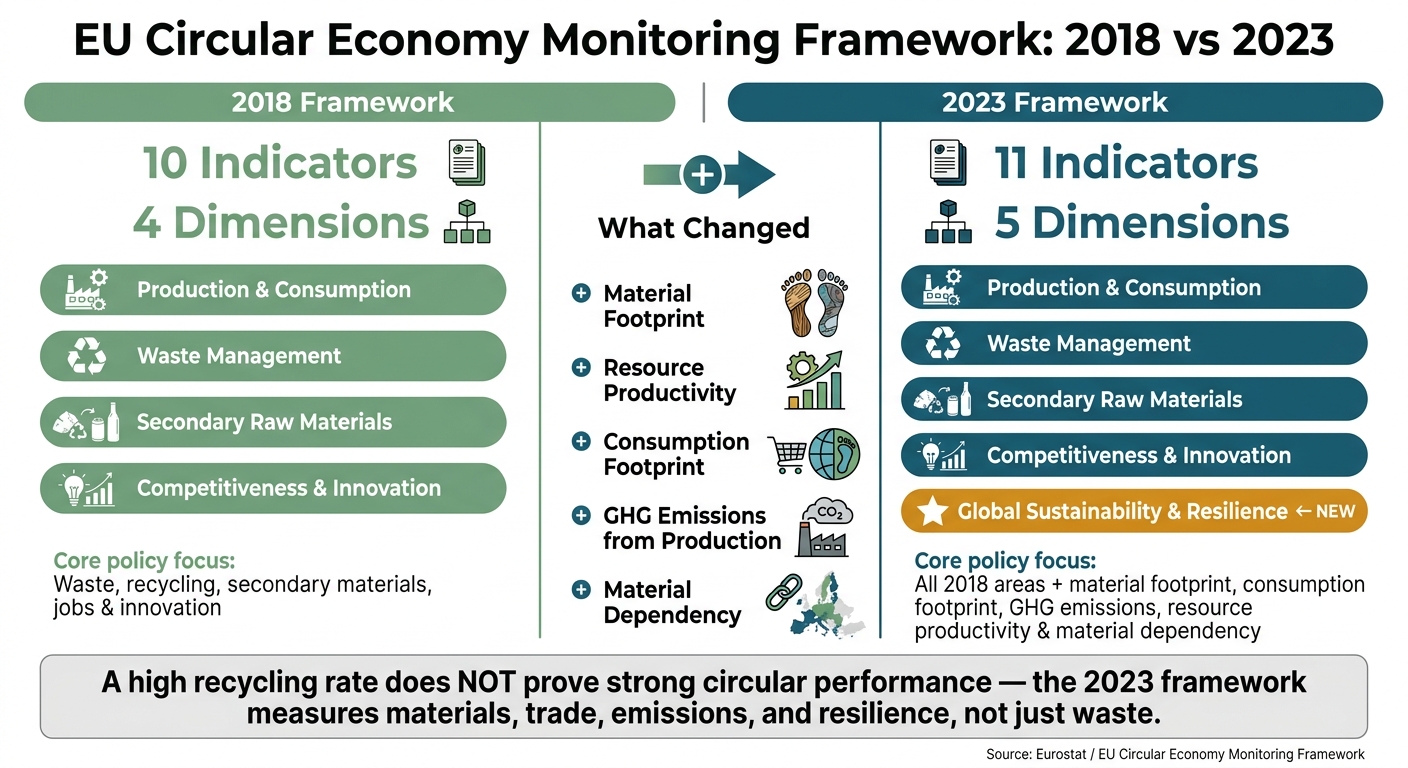
EU Circular Economy Framework: 2018 vs 2023 Indicator Comparison
From 2018 to 2023: framework comparison
The change in the EU framework comes into focus when you line up the 2018 and 2023 versions side by side. The 2018 framework set the starting point: 10 indicators grouped into four practical areas of the circular economy.[6][4] In 2023, the EU kept those four areas and added a fifth - global sustainability and resilience - which brought the total to 11 indicators.[1][7] The comparison below shows the shift clearly:
| Framework | Indicators | Dimensions | Core policy questions |
|---|---|---|---|
| 2018 | 10 | Production and consumption; waste management; secondary raw materials; competitiveness and innovation | Are production and consumption systems generating less waste? Is recycling improving? Are secondary materials being used? Is circularity supporting jobs, value added, and innovation? |
| 2023 | 11 | The four 2018 dimensions plus global sustainability and resilience | In addition to the 2018 questions, what are the EU's total material and consumption footprints? How does circularity contribute to climate objectives, supply security, and resilience? |
At first glance, adding just one indicator may look minor. It wasn’t. That single-step increase came with a much broader lens. Five indicators - material footprint, resource productivity, consumption footprint, greenhouse-gas emissions from production activities, and material dependency - moved the framework beyond domestic waste flows and into the larger environmental and strategic effects of resource use.[1][7] In plain terms, the EU was no longer asking only, Are we recycling more? It was also asking what resource use means for emissions, imports, supply chains, and economic security.
That marks a deeper shift in how circular economy performance is defined. The framework no longer treats circularity as mainly a waste and recycling issue. It treats it as part of a bigger system tied to materials, trade, production, and resilience.
Policy aims behind the indicators
Each indicator exists to answer a policy question. Waste reduction and recycling still sit at the center, but the 2023 revision pushed the framework further. Resource productivity looks at how much GDP the EU produces for each unit of material used.[1] That gives policymakers a way to track whether economic output is becoming less material-intensive.
The material dependency indicator asks a different kind of question: how much of the EU’s material supply comes from imports.[1] That links circularity to supply security and open strategic autonomy. It’s not just about using fewer materials. It’s also about where those materials come from and how exposed the EU may be if supply chains are hit.
The greenhouse-gas emissions from production activities indicator ties circular economy policy to climate neutrality goals, while the footprint indicators widen the view to imported goods, supply chains, and consumption-related effects.[1] So the framework now tracks more than recycling. It tracks how resource use connects to emissions, trade dependence, and the EU’s place in a tighter, more uncertain global system.
The next section explains how those indicators are structured and how to read the evidence they produce.
Indicator structure: what is measured and how to read it
The five dimensions and their core data categories
The 2023 framework includes 11 indicators across five dimensions: production and consumption, waste management, secondary raw materials, competitiveness and innovation, and global sustainability and resilience.[1][3] The right way to read these dimensions is as a set of signals, not a single score. A country or city can post better recycling numbers while its total material footprint stays flat - or even climbs.
That’s why each indicator needs to be read for what it does measure, and just as much for what it cannot prove.
Evidence notes for each indicator
The table below shows each indicator’s unit, the policy question behind it, and its main limit. These indicators track progress. They do not prove legal compliance.
| Indicator | Type | Unit | Policy question | Key limitation |
|---|---|---|---|---|
| Material footprint | Proxy / pressure | Tonnes per capita | How much raw-material demand is embedded in consumption, including imports? | Modelled, not directly measured; hard to attribute locally.[1] |
| Resource productivity | Proxy / efficiency | Dollars of GDP per kilogram of material used | Is economic output becoming less material-intensive? | GDP growth can improve the ratio without reducing total material use.[1] |
| Waste generation | Direct outcome | kg per capita; kg per dollar of GDP | Is waste prevention improving? | Affected by tourism, commercial activity, and reporting boundaries |
| Food waste | Direct outcome | kg per capita | Where are avoidable food losses occurring? | Measurement methods vary across supply-chain stages |
| Municipal-waste recycling rate | Direct outcome | Percent | Is collection and treatment performance improving? | Does not show material quality or whether recycled input replaced virgin material |
| Circular material use rate | Outcome / proxy | Percent of total material use | How much material input comes from recycled sources? | Does not capture repair, reuse, or products still in service |
| Trade in recyclable raw materials | Input / flow | Volume or value | How do secondary-material markets move across borders? | Trade volumes don't confirm actual recycling or equivalent-quality use |
| Investment and employment | Input / enabling | Dollars and job counts | Is circular-sector economic capacity growing? | Sector definitions may include activities with limited circular benefit.[1] |
| Patents | Enabling | Count | Is innovation activity in circular sectors increasing? | Patent counts measure inventive activity, not adoption or impact in practice |
| Consumption footprint | Proxy / outcome | Index (2010 = reference year) | What are the life-cycle impacts of consumption, including imported goods? | Depends on life-cycle assessment models and boundary assumptions.[1] |
| Production-related GHG emissions | Context / outcome | kg per capita | How do production sectors contribute to climate objectives? | Excludes household emissions; not a full economy-wide climate measure.[1] |
| Material dependency | Proxy / context | Share of imported materials in overall material use | How exposed is the economy to external supply risks? | Lower dependency doesn't automatically mean lower environmental impact.[1] |
Each indicator should also come with a data owner, baseline year, update frequency, and reporting-lag note. Without that metadata, even a clean-looking figure can mislead. Eurostat also notes that some indicators are available only for the EU as a whole, not for each individual EU country, so local programs should not claim a level of precision the dataset cannot support.[2][8]
What the evidence can and cannot show
The revised framework improves cross-country comparability, expands life-cycle coverage, and deals with imported materials more directly.[1][7] Those are meaningful gains. Still, every gain brings a matching risk if the data gets read too far.
| Framework strength | Interpretation risk |
|---|---|
| Cross-country comparability | Comparable definitions can still conceal differences in infrastructure, enforcement, or waste composition |
| Broader life-cycle coverage | Modeled footprints depend on assumptions and may not support precise local attribution |
| Better treatment of imported materials | Import-related estimates may carry time lags and uncertain supply-chain detail |
| Combination of environmental and economic indicators | Enabling measures like patents or investment are not evidence of completed environmental improvement |
The European Environment Agency has also pointed to a stubborn blind spot: the framework still does not adequately cover whether products keep their value longer through design for circularity, repair, reuse, or durability.[9] High recycling rates do not prove circularity. They show collection and processing. They do not show product life extension, repair, or reuse.
That gap matters when local programs pick indicators for action rather than simple reporting. A dashboard can look strong on paper and still miss the part that tells you whether products stay in use longer or just move through the waste system more efficiently.
That limits-first approach is what makes the framework useful for local measurement design.
Applying EU indicator logic to local programs
Build a usable local measurement system
EU indicators are good at showing trends, but they do not tell you whether a local program is meeting local rules. That’s why local programs need a smaller system tied to day-to-day decisions. What matters in the EU framework is how the indicators are built, not whether a city or agency copies the EU’s exact numbers. The logic is simple: map incoming materials, losses, recovery paths, and the decisions tied to them. A municipality, agency, nonprofit, or company can use that same logic on a smaller scale. The aim is operational monitoring, not legal proof.
Before picking indicators, set the basics: geography, organizational boundary, included flows, and exclusions. Then build a small indicator core instead of trying to mirror every EU measure. A practical starting set includes total waste, waste per resident, recycling and composting, organics diversion, reuse or repair, recycled-content procurement, and one broader material-flow measure.
Report both total tons and intensity measures, such as kilograms per resident or tons per $1 million of output. Absolute figures show the scale of impact. Intensity figures help you tell the difference between actual improvement and changes driven by population or economic growth.
Set a baseline year and record population, output, service coverage, and data quality. That same structure - scope, baseline, owner, frequency, decision use - makes local data easier to compare and easier to use. If older data are limited, mark earlier figures as estimates instead of presenting them as directly comparable to later years.
Match indicators to decisions and interventions
Every indicator should connect to a decision. The strongest local systems use an indicator-to-decision register. Each measure names the intervention it informs, the person responsible for the decision, the expected direction of change, and the action triggered by the result.
Each outcome indicator should also be paired with at least one action indicator. That’s where the system starts doing its job. A city might show high separate-collection coverage while total waste per resident stays flat. That points to a prevention issue, not a collection issue. A company might buy more recycled-content material while total material use keeps climbing. Pairing the outcome with the action measure helps surface that gap early.
For example:
Pair recycling rate with households receiving separate collection
Pair construction-waste recovery with projects screened for salvage or required to complete pre-demolition audits
Pair recycled-content purchasing with the percentage of eligible contracts containing a minimum recycled-content requirement
It also helps to split monthly operational metrics from annual outcome measures. Track collection tonnage, contamination, throughput, and procurement monthly so teams can catch problems early. Measures like material consumption, waste intensity, circularity, and resource productivity need full-year data, seasonal adjustment, and supplier reconciliation before they can be trusted.
A practical adaptation model for organizations
Each local measure should answer the same three questions built into the EU framework: what changed, why it matters, and what decision comes next. The table below turns that logic into a local reporting structure. Each measure should be adjusted to fit local authority, material flows, and decision-making roles.
| EU indicator logic | Local adaptation | Required data | Reporting frequency | Responsible owner | Decision use |
|---|---|---|---|---|---|
| Production and consumption: material use | Material purchased or consumed per resident or per $1 million of activity | Procurement records, material invoices, population or financial denominator | Monthly or quarterly operational data; annual outcome | Procurement or finance lead | Set purchasing standards; compare departments |
| Production and consumption: waste prevention | Total waste generated; waste per resident or employee | Scale tickets, hauler reports, facility records | Monthly; annual trend review | Waste or operations lead | Redesign services; target high-generation sites |
| Waste management: recycling and treatment | Collection, contamination, recovery, composting, and landfill disposal by stream | Weights, composition studies, processor certificates, disposal records | Monthly or quarterly | Solid-waste or facilities lead | Adjust collection systems, contracts, and outreach |
| Waste management: construction and demolition recovery | Materials screened for salvage, reused, recycled, or disposed | Project audits, inventories, manifests, contractor reports | Per project; quarterly portfolio review | Capital-projects or building official | Require pre-demolition audits; prioritize reuse in design |
| Secondary raw materials: circular material use | Verified recovered material used in local purchasing or production | Supplier declarations, bills of materials, processor records | Quarterly; annual verification | Procurement and supply-chain lead | Increase recycled-content purchasing; reduce virgin-material dependence |
| Competitiveness and innovation: circular capacity | Repair providers, reuse enterprises, circular contracts, jobs, and investment | Business surveys, contracts, grants, workforce data | Semiannual or annual | Economic-development or sustainability lead | Fund service gaps, workforce programs, and innovation pilots |
| Global sustainability and resilience: material dependence | Exposure to imported or vulnerable materials; estimated life-cycle emissions | Supplier geography, material categories, emissions factors | Annual, with project-level updates | Sustainability, risk, or supply-chain lead | Diversify supply; align with climate planning |
| Cross-cutting implementation discipline | Percentage of targets with named owners, verified data, and documented corrective action | Governance records, audits, action logs, data-quality assessments | Quarterly | Program manager or chief sustainability officer | Escalate gaps; keep reporting connected to decisions |
One rule cuts across every row: prevent double counting. A ton of recovered wood should not be counted as salvaged material, reused material, and recycled material unless the reporting framework clearly separates those stages. Count each material flow once, by stage, and do not add stages together as if they were separate outcomes.
Putting this model to work takes coordinated planning, consistent definitions, stakeholder alignment, and measurable implementation. The result is a reporting system built for action, not just measurement.
Conclusion: Key lessons from the EU approach
The main lesson is pretty simple: indicators matter only when they’re tied to governance. The 2023 framework groups 11 indicators across five dimensions.[2][1] On its own, a recycling rate is just a number. It becomes useful when someone owns it, knows what decisions it should shape, and follows up on the result.
That same logic helps draw a clean line between monitoring and compliance. Monitoring shows trends. Compliance shows whether legal rules were met.[5][1] Keeping those functions separate - with different fields for indicator result, legal requirement, compliance evidence, and follow-up action - helps avoid a reporting mistake that shows up all too often and can cost a lot to fix.
Documentation is what keeps a reporting system trustworthy over time. Each indicator needs a recorded definition, system boundary, data source, calculation method, and a plain note on data quality. Eurostat points out that some circular economy indicators are available only at the EU level, not for individual countries.[8] That’s why every result should be tagged as measured, estimated, modeled, or unavailable. That label belongs inside the monitoring system itself, not buried in a note somewhere else.
Once the reporting system can stand on its own feet, the next issue is balance. The revised 2023 framework adds indicators for material footprint, resource productivity, consumption footprint, greenhouse-gas emissions from production activities, and material dependency.[1][10] A balanced local set should track more than diversion. It should also cover waste prevention, resource productivity, jobs, innovation, emissions, and material dependence.
The EU framework works well as a reference point, but it shouldn’t be copied line for line. Local programs need indicators that fit local conditions, along with clear ownership and scheduled reviews. In day-to-day work, that means coming back to the indicator set as policy, operations, and data get better.
FAQs
Why did the EU add a fifth dimension in 2023?
The available sources do not say the EU added a fifth dimension to its circular economy policy in 2023.
Instead, they describe the Circular Economy Monitoring Framework as tracking 10 indicators across four categories:
production
consumption
waste management
secondary materials
That distinction matters. It’s easy for small wording shifts to change the meaning, and in policy writing, those shifts can send readers down the wrong path fast.
How do monitoring indicators differ from compliance metrics?
Monitoring indicators show how work is progressing, spot patterns over time, and help teams adjust day-to-day decisions as they move toward long-term circularity goals.
Compliance metrics are required, standardized benchmarks that organizations must meet to satisfy regulatory rules. Put simply, monitoring indicators help with steady improvement, while compliance metrics define the minimum bar and can lead to penalties if an organization falls short.
Which EU indicators can local U.S. programs realistically adapt?
Local U.S. programs can use EU-style circular economy indicators without copying them line for line. The smart move is to focus on a small set of high-impact metrics tied to material flows and resource efficiency. That keeps measurement grounded in what’s actually moving through the local economy, not just what looks good in a report.
A practical mix might include:
Waste diversion and waste reduction
Recycled content in public construction and procurement
Per-capita food waste reduction
Material circularity
Product-as-a-service or repair activity
The starting point should be Material Flow Accounting. It gives local programs a baseline for what materials come in, how they’re used, and where they end up. From there, teams can track change over time with tools like EPA WARM and Sankey diagrams. EPA WARM helps estimate the impact of waste management choices, while Sankey diagrams make flows easier to see at a glance - almost like watching the local materials story unfold on one page.
This kind of setup helps cities and regional programs move from broad intent to clear tracking. Instead of trying to measure everything, they can zero in on the indicators that show whether materials are being used longer, wasted less, and cycled back into the economy through procurement, repair, and reuse.



FAQ