
Oct 5, 2026 · 22 min read
Sustainability Strategy
In This Article
Stage-by-stage KPIs to track retained value, routing accuracy, costs, and resource impacts across the product lifecycle.
Circular Supply Chain Metrics by Stage
I measure circular supply chains by what each route delivers - not just how many items move through it. Start with eight stage-specific checks, then compare cost, retained value, useful service, and resource use.
Here’s what I track at each stage:
Sourcing: Recovered-material share, cost per usable pound, and supplier data.
Use: Active service life, utilization, failures, and resource use.
Return: Eligible units received, collection cost, timing, and condition.
Sort: Grading accuracy, safe routing, and downstream acceptance.
Repair: Restored function, total repair cost, and durability.
Remanufacture: Saleable output, reused parts, test results, and warranty claims.
Resale: Sell-through, net margin, returns, and verified continued use.
Recycling: Usable material yield, purity, buyer acceptance, and final destination.
I treat these as connected routes, not a fixed sequence. A returned product may go straight to resale, need repair, or require material recovery.
For each percentage, I state the denominator, reporting period, and exclusions. I also separate measured results from estimates: a sale does not prove continued use, and collected weight does not prove recovery. Repair follow-ups at 30 and 90 days help check whether restored function lasts.
My starting point is <u>one product family with linked records from source to final outcome</u>. That lets you compare routes on the same service basis before expanding your scorecard.
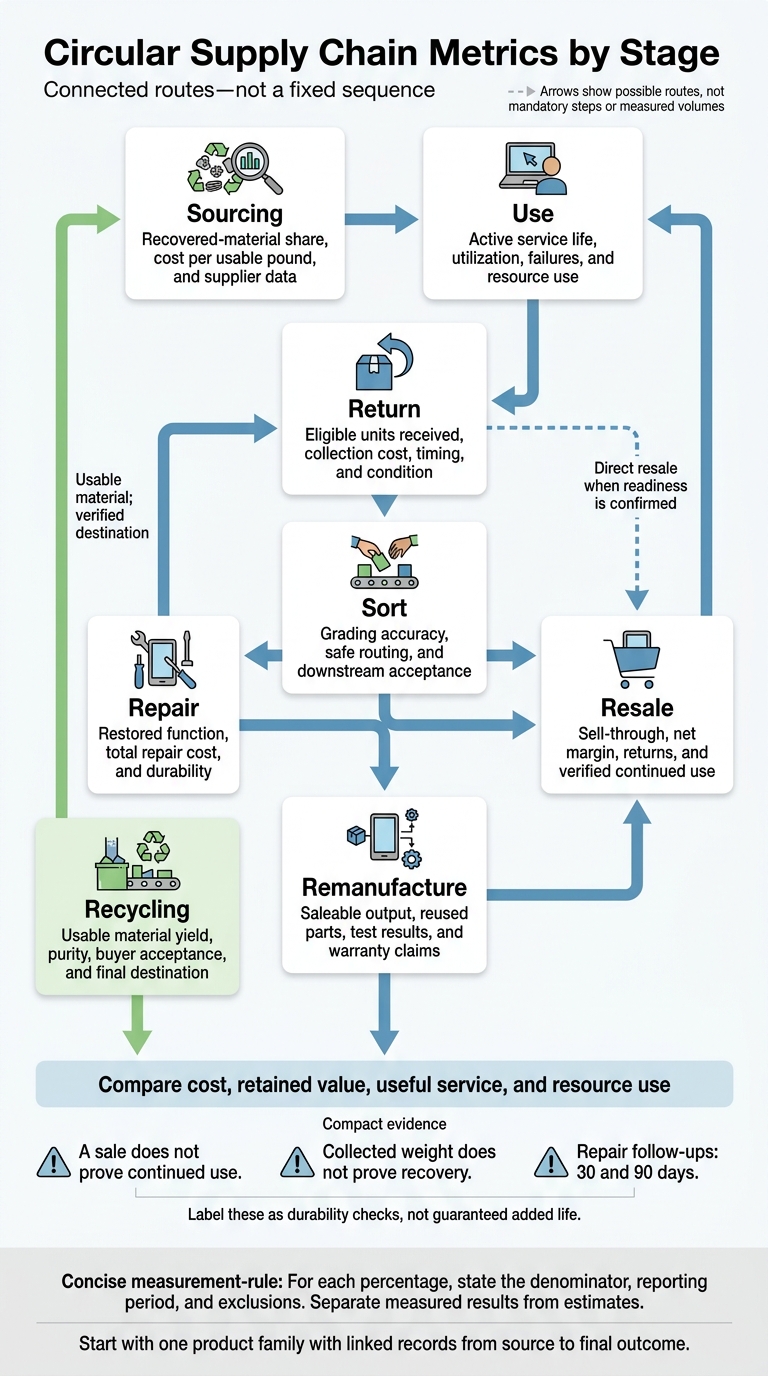
Circular Supply Chain Metrics by Stage
1. Sourcing
Process Priorities
Measure recovered content as recovered mass divided by total input mass, with separate shares for postconsumer and postindustrial material. State whether the claim relies on physical segregation or mass balance. Track production scrap as a share of purchased material, along with the share returned to production. More recycled content does not necessarily mean better performance if rejection rates increase or products wear out sooner.
Sourcing data should also support designs that make recovery easier. Material composition and ease of separation affect repair, remanufacture, and recycling later on. Track the share of product mass covered by material specifications and the share of components removable with common tools. Require suppliers to disclose coatings, additives, and adhesives so buyers can avoid incompatible blends and specify accessible fasteners.
Value and Resource Outcomes
Compare cost per usable pound, not just purchase price. Add purchase, freight, preprocessing, testing, and related sourcing costs, then divide by accepted usable pounds.
Compare supplier emissions on that same usable-pound basis, using supplier-specific cradle-to-gate data when available. Calculate total cradle-to-gate emissions as purchased quantity × supplier-specific emissions factor. When primary data is unavailable, clearly label secondary estimates.[2][3]
Data Visibility
Maintain one supplier-batch record containing the facility, material ID, lot number, production date, quantity, composition, recovered-content evidence, and emissions data. Link that record to purchase orders and bills of materials so procurement teams can enforce thresholds and designers can assess future recovery.
Track the percentage of purchases linked to complete batch records and the share of sourcing emissions calculated from supplier-specific data. Unknown values are not zero. Prioritize data collection from high-volume and high-emission suppliers.[2][3]
sbb-itb-8baf5f1
Building a circular supply chain
2. Use
After sourcing, move the focus from material inputs to the service a product delivers.
Process Priorities
Track useful service delivered, not just product age. Record active-use life separately from calendar age, along with operating hours, cycles, or miles. Separate original-user retention from continued use by later owners: ownership alone doesn’t show that a product is still active. Measure utilization as used capacity ÷ available capacity.[9][14]
Compare failure rates and repair frequency by model and use intensity, using 1,000 operating hours or cycles, or product-year as the denominator. Calculate maintenance compliance as on-time preventive-maintenance actions ÷ scheduled actions × 100, and review it alongside uptime and repeat failures.[10][12]
Value and Resource Outcomes
Measure operating and maintenance costs per functional unit, along with energy, water, consumables, and replacement-part mass. After maintenance, test efficiency, output quality, and safety against the pre-failure baseline and design specifications. Use those results to decide whether the product stays in service or moves to return.
Base repair-or-replacement decisions on expected remaining life, cost, performance, and resource use - not repair frequency alone. Longer life matters only while the product keeps delivering useful service.[6][10]
Data Visibility
Link each product ID to its activation date, ownership changes, usage, faults, service dates, replaced components, and post-service test results. This history guides condition-based maintenance and decisions about repair, replacement, and return. Collect only customer data needed for those decisions, restrict access, and set retention limits.[11][13]
Customer use often goes unobserved. Sales and warranty records miss storage, second ownership, and abandonment. Report the share of the installed base with usable histories, and distinguish measured usage from survey or model estimates. Without that distinction, failure-rate comparisons and routing choices can be distorted.[5][7][8]
Use these records to inform return timing, remaining-life estimates, and routing decisions.
3. Return
Process Priorities
When a product’s use ends or it fails, return is the first gate for recovering value. If too few eligible units come back, every stage that follows suffers. Return metrics track capture, receipt timing, and condition at handoff to guide routing.
Calculate capture as received eligible units ÷ eligible units expected for return × 100, with a clear rule for eligibility. Keep authorized, collected, and received counts separate. At receipt, record standardized return reasons and condition grades, then report condition-data completeness alongside the mix of return reasons.[15]
Measure time from authorization to receipt using the median and key percentiles. Separate authorization-to-pickup delays from pickup-to-receipt delays, and track first-attempt pickup and on-time pickup rates.[16]
Value and Resource Outcomes
Once units come back, compare which collection channel keeps the most value at the lowest cost. Track collection cost per collected unit and transport emissions per received unit. Account for distance, transport mode, shipment weight, consolidation, and empty-return movements. State whether the calculation includes warehouse and processing emissions.
Link these results to test whether local drop-off or consolidated pickup cuts cost and emissions without reducing capture or increasing damage.
Return metrics help determine whether an item goes to sorting, repair, remanufacturing, resale, or recycling. Report routing shares across all received units, including those with pending or unknown destinations, and check planned routes against actual recovery outcomes.
Measure net return value after transportation, inspection, labor, parts, fees, markdowns, and disposal costs. Compare results by product family and condition grade, rather than rewarding the channel that brings back the most units.[17][18]
Data Visibility
These metrics depend on tracing each return from authorization to its final destination. Link the return authorization ID to collection events, carrier scans, package identifiers, receipt, inspection, routing, and financial outcomes.[19]
Calculate identity completeness as received units with a verified product ID ÷ all received units × 100. Gaps in identity data limit downstream routing and measurement. Third-party channels often omit serial numbers, scans, condition grades, or final destinations.
Require event records and reconcile authorized, collected, and received units each reporting period. This flags missing shipments and shows which collection options preserve value.
4. Sort
Process Priorities
Once a unit returns, sorting determines which recovery path it can safely take. This inspection and disposition gate turns return data into routing decisions. The aim is to choose the highest-value feasible route based on consistent evidence of condition, function, safety, and demand.
Track triage time and grading completeness: units with all required fields completed ÷ received units × 100. Measure sorting accuracy as correctly classified units ÷ audited units × 100. Separate classification errors by their consequences. A cosmetic-grade mistake is not the same as releasing an unsafe product for resale.
Use a fixed inspection protocol that specifies required tests, pass/fail thresholds, photos, and escalation rules. Replace subjective labels such as “good” or “fair” with observable condition and function criteria. Measure contamination by output stream as unacceptable material ÷ total stream material × 100, using a consistent weight or unit basis. Faster sorting offers no gain if downstream teams reject or re-sort the output.
Value and Resource Outcomes
Compare inspection cost per unit with routing yield and downstream acceptance. Report downstream acceptance rate by route, checking whether repair, remanufacturing, resale, or recycling teams accept the units assigned to them. Lower inspection costs can mask higher rework and disposal costs.
Track avoidable disposal, document the reasons, and review missed routing options. Before discarding an item with uncertain status, weigh the expected recovery value of further testing against its added cost and risk.
Data Visibility
Track the information-hold rate, hold duration, resolution rate, and final disposition. These records help inspectors route units to repair, remanufacturing, resale, or recycling without delay.
Inspectors need configuration-level data - not just a product name - to determine safe, feasible routes. That includes model revision, battery chemistry, compatible parts, recall status, and data-erasure requirements. Missing information should trigger a hold, not disposal.
Compare original grades with downstream findings. Use repeated disagreements to revise inspection thresholds and product records. Keep data specific and available at the inspection station; broad lifecycle data slows sorting and lowers accuracy.[20]
5. Repair
Process Priorities
Once sorting sends a unit to repair, track how fast function returns, how fully it returns, and how long it lasts. Measure turnaround time from intake to verified return to service, reporting both the median and the target-attainment rate. First-time fix rate measures jobs resolved in the first intervention without a return for the same fault during the follow-up window. Calculate repair success as restored units ÷ accepted repair jobs, and repair yield as serviceable units ÷ incoming units.[21]
Calculate parts availability as jobs with required parts available within the promised window ÷ jobs requiring parts × 100. Track diagnosis-to-approval time separately from parts delays so approval bottlenecks and stockouts aren't mistaken for technician failure. For every delayed job, record the missing part and its expected arrival date.[23]
Value and Resource Outcomes
Compare total cost per completed repair - diagnosis, labor, parts, shipping, and warranty rework - with replacement costs, including installation, disposal, and downtime. Track labor hours together with the original mass or major components retained. Repair restores function without rebuilding to as-new specification; remanufacturing rebuilds to that standard. A lower price alone doesn't make a repair successful if it replaces most of the original product or leaves the unit likely to fail again.[22][25]
Data Visibility
Link every repair job to the product serial number, diagnostic evidence, confirmed fault, technician, labor time, replaced parts, safety checks, and final functional test results. For each part, record its supplier, part number, batch, condition, and inspection status. At a minimum, decisions about whether a unit stays in repair or moves on need its serial number, fault, parts, and final functional test results. These records also help separate poor diagnosis from unsuitable parts and recurring design faults.[21][23]
Check operation 30 and 90 days after repair, and link those follow-ups to warranty claims and later returns. Measure repeat-failure rate and post-repair operating time until failure or retirement. Use hours, cycles, or miles when usage varies. Report follow-up coverage alongside the results: passing a final test doesn't guarantee that a repair will last. Without follow-up, treat estimates of added service life as provisional.[24]
Units that need major rebuilds or keep failing move to remanufacture, resale, or recycling.
6. Remanufacture
When repair can’t restore reliable service, remanufacture rebuilds the core - a returned product or part - to a defined specification. Repair, by contrast, restores function without a full rebuild.
Process Priorities
Remanufacturing follows repeatable steps: inspection, disassembly, cleaning, repair or replacement, reassembly, and testing. Track three rates separately so core-quality problems don’t get buried in a single measure:[27][28]
Core recovery rate: received cores ÷ expected eligible cores.
Acceptance rate: accepted cores ÷ received cores.
Process yield: saleable units ÷ incoming production cores.
Measure end-to-end cycle time from core receipt to product release, separating active work from time spent in queues or waiting for parts. Tests should use documented performance, safety, and acceptance limits. Report first-pass test rate and final functional-test pass rate separately: rework can deliver compliant units while hiding process inefficiency.[27][28]
After measuring process stability, compare what the route recovers in parts, material, and cost.
Value and Resource Outcomes
Keep component measures separate. Component reuse rate is reused components installed ÷ components removed from cores. Parts reclamation rate is parts recovered for other products or service stock ÷ potentially recoverable parts assessed. Track new-material input in pounds per saleable unit against an equivalent new-product baseline. For unit cost, include labor, parts, energy, testing, logistics, overhead, and warranty provisions.[27]
Assess cost alongside warranty claims per 1,000 units, failure modes, and demand served = fulfilled remanufactured demand ÷ eligible demand. Compare warranty results using equal coverage and use conditions. High output alone doesn’t mean success: units may fail in service or sit unsold because their model or configuration doesn’t match customer needs.[27]
Tracking these outcomes depends on keeping a one-to-one link from each core to its finished unit.
Data Visibility
Link core IDs to component IDs, part revisions, reuse or replacement decisions, specification versions, dated test results, and final serial numbers. Those links often break during cleaning, pooling, subcontracting, part replacement, and final assembly. Gaps in lineage weaken warranty analysis, reuse tracking, and unit-level traceability, leaving less evidence to support routing decisions.
Report critical-component lineage completeness and test-record completeness separately. When only batch-level history survives, label it batch-level traceability and preserve batch, supplier, date, and test records.[26][28]
7. Resale
Resale turns recovered, sale-ready units into cash quickly while aiming for the highest net price. Units enter resale only after sorting or repair confirms they’re ready to sell.
Process Priorities
Measure sell-through at 30, 60, and 90 days: units sold ÷ units listed in the cohort. Track intake-to-sale and listing-to-sale time separately so preparation delays don’t get buried in the total. Group unsold inventory into age bands - 0–30, 31–60, 61–90, and 90+ days - and weigh markdowns against margin, not just sales speed.[29][32][35]
Use grading accuracy to explain price recovery and the customer-return rate: returned resale units ÷ units sold. Calculate this rate using cohorts whose return windows have closed. Break it down by grade, product category, and channel to pinpoint listing and fit issues. Returns marked “Not as described” should prompt changes to grading criteria, photographs, and listing details. Fit or compatibility returns need different fixes.[29][33][34]
Together, these measures show whether listing quality and timing protect resale value.
Value and Resource Outcomes
Track unit recovery: units sold ÷ eligible recovered units, and economic recovery: resale revenue ÷ original cost or reference value. Also measure resale price as a share of the current new-product price. Calculate contribution margin per unit after inbound shipping, inspection, cleaning, repair, listing, storage, fees, outbound shipping, returns, and markdowns. Compare results by channel before trading margin for speed.[29][34][35]
Sell-through measures commercial recovery; it doesn’t prove use. Report verified productive use when that evidence is available. Otherwise, label retention after a defined period as a proxy. A sale confirms a transfer - not continued use or a benefit to the environment. These metrics help organizations transition toward climate resilience by ensuring resources remain in productive use. Keep listings, sales, retained units, and verified use separate.[30][31]
Data Visibility
Connect each item’s identifier to its grade, photographs, custody history, listing, price changes, sale, and return status. These links help determine which grades warrant premium channels, earlier markdowns, or more repair. Independent marketplaces, liquidation buyers, and informal resale can leave gaps in final prices, returns, and continued-use data.
Use common item IDs, standardized grade and disposition codes, and required sale and return fields. Link grade codes to price, sell-through, markdowns, and resale returns to see which grades generate value in each channel. Reconcile internal records with channel settlements, and label downstream outcomes you can’t observe as unknown or estimated - not verified.[31][33][36]
Units that don’t sell should carry complete grade and disposition records into the next recovery route.
8. Recycling
When units cannot be repaired, remanufactured, or resold, recycling shifts the focus from product value to material yield and verified end-market acceptance.
Process Priorities
Recycling starts after collection. Collection tonnage alone does not prove recovery: material may be contaminated, rejected, stored, exported, downcycled, or disposed of.[40] Track collected, delivered, accepted, recovered, sold, and rejected mass separately to support the mass balance.
Define material yield as saleable output ÷ processing input. Specify whether input covers all incoming material or only accepted material. Measure inbound contamination and rejects by weight and category.
Measure purity as target material mass ÷ output mass, and confirm that output meets buyer specifications. Record polymer or alloy grade, color, moisture, and hazardous components before selecting a processing route. Clean, single-material streams generally favor mechanical recycling. Mixed streams require closer review of sorting, treatment costs, and achievable quality.[41] Reject streams that cannot meet buyer specifications.
With material quality established, compare each route’s costs and resource use.
Value and Resource Outcomes
Compare processing cost, transport cost, revenue, and margin per saleable short ton across routes and outlets. Calculate energy intensity in kilowatt-hours per saleable short ton - not just per incoming ton - to keep processing losses visible. Track water use when washing is required, and use energy and emissions boundaries that match cost and yield boundaries. ISO 59020 connects circularity measurement with resource flows, energy, water, and economic performance.[1][38]
Measure buyer acceptance as buyer-accepted mass ÷ shipped mass. Track acceptance without rework, customer rejects, and inventory age separately. Revenue confirms a transaction; documented use in a downstream product offers stronger evidence of circular use. Separate closed-loop applications from other productive uses and disposal.
These measures require a closed mass balance and verified downstream identity.
Data Visibility
Reconcile a monthly mass balance:
Opening inventory + inbound mass = recovered output + rejects sent out + documented losses + closing inventory.
Do not count recovered output again when it ships. Use pounds or U.S. short tons consistently, and document moisture adjustments and scale calibration. Link batch composition to certificates of analysis, receiving weights, batch identifiers that distinguish each batch, processor name, location, and final application.
Verify the actual processor and final application - not just the paperwork. If records stop at a broker, label the shipment destination unverified and exclude it from verified final-use totals.[37][39]
Value, Cost, and Resource Outcomes by Stage
Compare retained value, financial results, and resource impacts - not a single circularity percentage. Sourcing and use protect future value. Return and sort determine what can still be recovered. Repair, remanufacture, and resale preserve product value, while recycling recovers material value when higher-value options are no longer viable.[4][44][46]
Each stage calls for different measures, depending on the decision at hand.
| Stage | Primary value driver | Financial measure | Resource and emissions measure | Main trade-off |
|---|---|---|---|---|
| Sourcing | Less virgin material; greater supply resilience | Cost per usable pound; price variance; supplier risk cost | Recovered-input share; virgin material avoided; supplier GHG emissions | Qualification, processing, and quality-control costs |
| Use | Longer service life; higher utilization; customer retention | Margin per year of use; warranty cost; total ownership cost | Service-life extension; energy and water per use; use-phase GHG emissions | Higher design costs; fewer replacement sales |
| Return | Recoverable units collected | Cost per returned unit; value per return | Transport emissions; share reaching verified processing | Low-value or contaminated returns |
| Sort | Value retained through accurate routing | Cost per sorted unit; sorting yield; revenue by disposition | Classification accuracy; contamination; mass by route | Added inspection and handling costs |
| Repair | Original product and manufacturing value retained | Repair cost and margin; warranty avoidance; cost per added year of use | Added years of use; avoided replacement; repair energy and materials | Labor, parts, and testing costs |
| Remanufacture | Restored performance; retained component value | Unit cost; gross margin; yield; cost versus new | Virgin material and manufacturing emissions avoided per unit | Disassembly, testing, and replacement-part requirements |
| Resale | Net value from secondary sales | Net revenue; contribution margin; sell-through | Added use cycles; avoided production; logistics emissions | Price pressure; uncertain demand; new-sales cannibalization |
| Recycling | Usable secondary material | Cost per recovered pound; net recycling cost; material revenue | Yield; material quality; processing energy; emissions per recovered pound | Loss of product and component value |
Return brings value back into the system; sort determines where it goes. Keep their budgets and KPIs separate so better collection does not hide poor grading or contamination.
| Dimension | Return | Sort |
|---|---|---|
| Core KPIs | Return rate; units returned per 1,000 sold; time to return; return completeness; cost per returned unit | Sorting accuracy; first-pass classification rate; contamination rate; routing shares |
| Cost exposure | Incentives, take-back infrastructure, packaging, reverse transportation, and handling | Labor, inspection equipment, testing, data systems, rehandling, storage, and error correction |
Report resale separately for as-is, repaired, and remanufactured products. Each path has different costs, quality requirements, and value outcomes.[4][46]
| Pathway | Intervention | Main value driver | Useful KPIs | Main cost | Quality requirement | Downstream dependency |
|---|---|---|---|---|---|---|
| As-is resale | Cleaning, identification, grading, and listing; no functional intervention | Fast monetization; another use cycle | Sell-through; days to sale; net margin; return or defect rate | Inspection, cleaning, storage, listing, and fees | Disclosed condition; safety compliance | Accurate grading, demand, and reverse logistics |
| Repaired resale | Diagnosis, parts repair or replacement, testing, and grading | Added service life; original value retained | Repair success; unit cost; added life; post-repair returns; net margin | Labor, parts, testing, warranty, and handling | Defined functional and safety criteria | Parts, instructions, technicians, and warranty capability |
| Remanufactured resale | Controlled rebuild and verification against a specified standard | Restored performance; potential resource savings versus new | Yield; cost versus new; warranty claims; performance equivalence; virgin-material avoidance | Disassembly, testing, parts, equipment, inventory, and quality assurance | Documented specifications; repeatable quality controls | Recoverable cores, design access, component supply, and demand |
Use the same product, functional unit, period, and boundary for MFA, LCA, and financial analysis. MFA tracks flows, LCA estimates impacts, and financial analysis tests viability.[42][43]
Compare equivalent service, not just the number of items processed. Include transport, parts, testing, rejects, warranty, and inventory costs consistently. Report dollars and kilograms of CO₂-equivalent per functional unit, and retain conversions when records use pounds or short tons.
Count each product once at the system level. Allocate costs and impacts only when the product splits into components or materials. Collection totals, landfill diversion, and recycling input volumes do not prove recovery or displacement.[44][45]
Keep verified usable output separate from modeled avoided production, and test assumptions about remaining life, yield, and substitution. A sale proves revenue - not that it displaced a new product or a virgin material purchase.
Data Gaps and Measurement Rules
Audit the evidence before comparing performance. The matrix below is an illustrative diagnostic, not a set of reported results. Once stage metrics are defined, check whether the supporting data is complete enough for comparison.
Label records C: complete, E: estimated, M: manually collected, or U: unavailable. Keep collection method and evidence quality in separate fields. M means a person collected the data; it does not mean the data is accurate.
| Stage | Identity | Condition | Quantity | Time | Cost | Impact | Downstream outcome |
|---|---|---|---|---|---|---|---|
| Sourcing | C: supplier, material, lot, or product ID | M: grade or recycled-content claim | C: pounds, units, or components received | C: purchase and receipt dates | C: purchase price or freight | E: kg CO2e, water, or virgin-material share | C: accepted, rejected, or allocated to production |
| Use | C: customer and product ID | M: in-use status or failure signals | E: active units or utilization | U: end-of-use date | C: warranty and service cost | E: use-phase energy or emissions | U: continued use, replacement, or return eligibility |
| Return | C: unit ID and return authorization | M: return condition | C: returned units and pounds | C: request, receipt, and processing timestamps | C: shipping and handling | E: return transport emissions | U: reuse, repair, remanufacture, recycling, or disposal |
| Sort | C: unit, lot, or material ID | M: grade, contamination, or damage | C: units or pounds by sort category | C: sort start and completion | E: labor, equipment, and handling | E: sort loss and processing emissions | M: routing decision and downstream acceptance |
| Repair | C: unit ID and work order | M: failure mode and pre-repair grade | C: attempted and completed repairs | C: intake, diagnosis, completion, and resale dates | C: repair cost | E: avoided replacement or added-life impact | M: returned to service, downgraded, cannibalized, or rejected |
| Remanufacture | C: core ID, component IDs, and bill of materials | M: core and post-process grade | C: cores, finished units, and material input | C: receipt, production, and release dates | E: labor, parts, energy, and capital allocation | E: reused-material share and process emissions | C: certified remanufactured unit or material loss |
| Resale | C: original and resale unit IDs | M: final grade and disclosure status | C: eligible, listed, sold, and unsold inventory | C: cohort, listing, sale, and sell-through dates | C: refurbishment, marketplace, logistics, and markdown costs | E: incremental life and avoided new production | U: sale, donation, liquidation, return, or disposal |
| Recycling | C: material, lot, and processor ID | M: contamination and grade | M: input, recovered output, and rejects | U: shipment, processing, and output dates | C: collection, sorting, processing, and revenue | E: kg CO2e, energy, and material substitution basis | U: secondary material, residue, energy recovery, or disposal |
Make each field traceable. Connect each product ID to its source, process, and outcome records. For every field, define the owner, source, update frequency, validation rule, and evidence quality: verified, corroborated, self-reported, modeled, or unverified. Keep source documents and calculation versions so others can reproduce stage comparisons.
Standardize grades and reconcile transfers. Set inspection tests and specify who can change a grade. Reconcile inputs against usable output, residue, inventory changes, and unexplained variance, then investigate any differences.
Keep event timestamps separate. Measure lifetime from first deployment to verified final end of service. Measure added life from the return to service after an intervention. State which costs are included and where impact measurement begins and ends. Report costs in U.S. dollars, mass in pounds or short tons, and emissions in kg CO2e.
Publish the denominator beside every rate. Apply consistent rules when defining KPI denominators. State the reporting period, disclose exclusions and pending outcomes, and mark modeled end-of-use eligibility as estimated - not complete.
| Rate | Numerator | Denominator and basis |
|---|---|---|
| Return capture | Eligible end-of-use units received | Eligible units reaching end of use in the reporting period; unit basis, with late returns identified |
| Sort yield | Quantity accepted by downstream streams | Quantity received for sorting; same unit or mass basis |
| Repair yield | Attempted units restored to service | Units with repair attempts; unit basis |
| Remanufacturing yield | Saleable remanufactured units | Cores accepted into the process; unit basis |
| Recycling yield | Verified usable recovered output | Processing input; same material and weight basis |
| Resale recovery | Eligible cohort units sold | All eligible units entering that resale cohort; unit basis |
| Resale value recovery | Net resale proceeds from the cohort | Eligible cohort value; state original cost, replacement cost, or book-value basis |
| Sell-through | Cohort units sold | Cohort units listed or available for sale; unit basis |
| Added service-life rate | Processed units meeting a verified service threshold | Units processed for reuse, repair, or remanufacture; specify the threshold |
| Verified final recovery | Quantity reaching a verified recovery outcome | Quantity entering an end-of-use route; consistent unit or mass basis |
Before comparing performance, name the gap, the owner, and the verification rule. Apply these rules to determine which stage metrics can support routing, investment, and reporting decisions.
Use stage KPIs to track operational performance, cross-stage KPIs to track traceability and timing, and outcome KPIs to measure value, material recovery, and emissions.
Conclusion: Match Metrics to Decisions
Match metric priorities to the decision at each stage. Start with circular inputs and in-use performance, then focus on return capture and sorting accuracy. During recycling, measure usable output - not just collected material. Count virgin-material displacement only when downstream evidence supports it.
Keep the core scorecard to eight KPIs: circular input share, productive life, return capture rate, sort accuracy, recovery yield, post-route quality or continued-use rate, net recovery cost, and resource impact.
Pair process results with durability checks. After a fixed follow-up interval, confirm that restored products still function. Fast processing means little if those products fail again.
At the system level, pilot one product family through a complete loop before expanding the dashboard. Use the pilot to verify that stage metrics link flows to outcomes. Fix missing identities and unverified handoffs first, then audit a sample from intake to final use. Assess results across the full loop; a single circularity score should not hide the trade-offs.
FAQs
How do I set targets for each stage?
Map material flows to see where resources go to waste and which improvements to tackle first. Use Circular Transition Indicators (CTI) or the Global Circularity Protocol to set SMART targets that support business objectives.
Begin with an assessment to define KPIs, test pilot initiatives, and scale programs that work. Build from those results toward ecosystem-wide transformation. Include targets in ESG reporting to track progress and hold teams accountable. Council Fire connects day-to-day activities with business goals, turning sustainability plans into measurable action.
Which data gaps should I fix first?
Start with a material flow analysis that maps all inputs, outputs, waste streams, and products in use. This helps spot hidden losses, measurement errors, and flows that haven’t been accounted for - places where you can use resources more efficiently and recover financial value.
Next, address data gaps linked to your largest waste streams and the circular interventions with the highest value. Set this baseline first, before expanding circular strategies or putting complex traceability systems in place.
How do I weigh cost against circularity?
Treat circularity as a source of long-term value, not just a cost. Track business returns alongside environmental impact through metrics such as savings from waste reduction, revenue from circular models, and the value of recovered materials.
When cost pressures clash with circular goals, put reuse, repair, and remanufacturing before recycling. Share costs and risks with partners, use technology to improve operations, and tie leadership incentives to circular goals.



FAQ