Jul 18, 2026
Real Estate vs. Infrastructure: Risk Profiles
ESG Strategy
In This Article
Real estate risks are local—vacancy, zoning and climate—while infrastructure risks stem from contracts, regulation and system resilience.
Real Estate vs. Infrastructure: Risk Profiles
If I had to boil it down to one line, it’s this: real estate risk is mostly local, while infrastructure risk is mostly contract- and policy-driven. For an impact portfolio, that means I would judge these assets less by headline yield and more by how they fail under stress.
Right away, here’s what matters most to me:
Real estate is more exposed to vacancy, local demand, zoning, insurance costs, and property-level climate threats
Infrastructure is more exposed to contracts, public policy, counterparty strength, construction delays, and service outages
Both can offer long-term income and some inflation linkage, but their weak points are different
In impact investing, I also have to look at impact-delivery risk: will the housing stay affordable, or will the asset keep delivering power, water, or transit as planned?
A few facts from the article make that split clear:
About $1.2 trillion of $5.9 trillion in U.S. CRE loans was set to mature in 2024–2025
U.S. office vacancy was about 19% to 21% in late 2024 and early 2025
In one cited sample from Latin America and the Caribbean, renegotiation hit 10% of electricity, 55% of transport, and 75% of water concessions
So when I compare the two, I focus on six things:
Income stability
Liquidity
Regulation
Counterparty exposure
Climate risk
Impact delivery risk
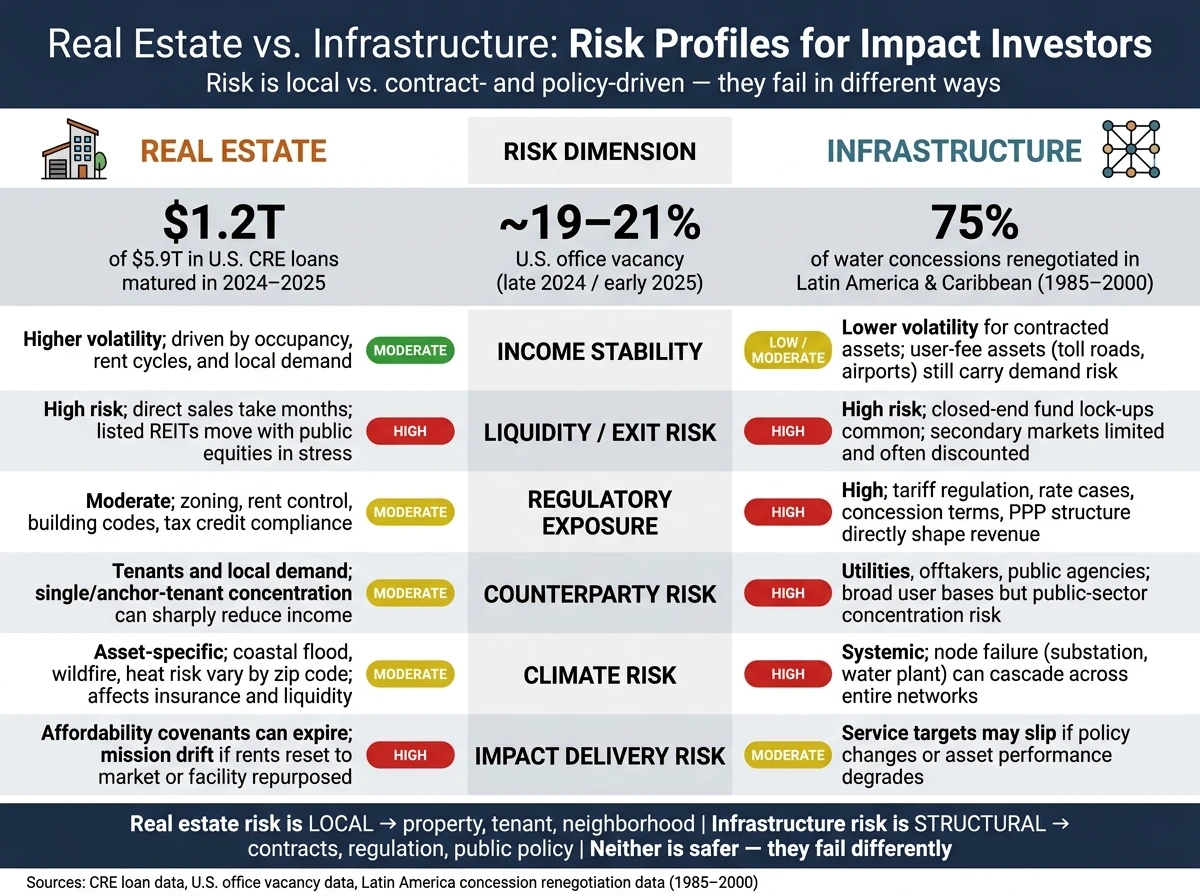
Real Estate vs. Infrastructure: Risk Profile Comparison for Impact Investors
If You Don't Understand Infrastructure Investing, Watch This
Quick Comparison
Criteria | Real Estate | Infrastructure |
|---|---|---|
Main revenue risk | Occupancy and rent levels | Contract terms, tariffs, or usage levels |
Liquidity | Often low; sales can take time | Often low; secondaries can be thin |
Regulatory exposure | Zoning, codes, rent rules, tax credits | Rate cases, permits, concessions, PPP terms |
Counterparty risk | Tenants and local demand | Utilities, offtakers, public agencies |
Climate risk | Property-specific flood, heat, wildfire, insurance stress | Network disruption, node failure, service interruption |
Impact risk | Affordability can fade; mission drift can occur | Service targets may slip if policy or asset performance changes |
My takeaway: if I want place-based social outcomes, real estate may fit better. If I want more contract-backed cash flow, infrastructure may fit better. But neither is “lower risk” across the board. They just carry different types of risk, and that should shape how I allocate capital.
Real estate risk profile: market exposure, location risk, and impact execution
Real estate is tied to place. Demand is local. Zoning is local. Climate risk is local. In impact portfolios, that means the job isn't just to ask whether a building performs on paper. You also have to ask whether it keeps delivering affordable housing or community services over time. That puts underwriting at the property level, with a sharp focus on income stability, policy exposure, and climate resilience.
Income volatility, vacancy, and liquidity constraints
Rental income in impact real estate depends on tenant turnover, vacancy, operating costs, and financing structure. Affordable housing backed by Low-Income Housing Tax Credit (LIHTC) programs or Housing Choice Vouchers often sees lower turnover than market-rate multifamily, and those subsidies can steady rent payments. But the property is still exposed to local market strain. If utilities, insurance, property taxes, and capital expenses climb faster than allowed rents, net operating income (NOI) gets squeezed.
Refinancing risk is another pressure point. Loans made during the low-rate period of 2020–2021 may face much higher borrowing costs when they mature, which can weaken debt service coverage ratios (DSCR). Across U.S. commercial real estate, about $1.2 trillion of the $5.9 trillion in outstanding CRE loans was scheduled to mature in 2024–2025, with more than half held by banks.[4] In regulated affordable housing, where owners can't freely lift rents to offset higher financing costs, that rollover risk can open a very real cash flow gap.
Liquidity can make a bad situation worse. Specialized impact properties such as supportive housing or community health centers often attract a smaller pool of buyers. In plain terms, if you need to sell fast, you may have to take a discount to stabilized value. In these deals, cash flow risk and affordability compliance tend to be tightly linked.
Zoning, housing policy, and decarbonization upgrade risk
Programs like LIHTC, New Markets Tax Credits (NMTC), and local property tax abatements can make affordable and community-serving projects pencil out. They also bring compliance risk, recapture risk, and sunset risk. Zoning and land-use rules add another layer through delays, added conditions, or outright denial. If covenants expire or compliance slips, the impact case weakens even when the asset still works financially.
Decarbonization upgrade risk is also becoming more material. Municipal building performance standards, emissions caps, and energy-use benchmarks are increasing across U.S. cities. Older multifamily and community buildings may need major capital spending for HVAC electrification, insulation, and on-site renewables. Skip those upgrades, and the costs can show up in a few ways:
Fines
Higher operating costs
Harder financing
Weaker occupancy
Tools like Property Assessed Clean Energy (PACE) loans can help fund these projects, but they also add complexity to the capital stack. And those policy pressures don't sit in isolation. They stack on top of location-based climate exposure.
Physical climate risk and social outcome risk
Flood and heat risk can directly reduce NOI and property value.[2][3] In higher-risk areas, lenders may ask for larger down payments or charge higher interest rates to offset possible value declines.[2] If a property can't be insured or used as collateral, it can become stranded.[3] Extreme heat hits older housing stock and low-income communities especially hard, pushing up utility costs and creating habitability issues that can weaken occupancy and community stability.
Social outcome risk sits right beside financial risk in impact real estate, and the two don't always move in sync. A project can hit its financial targets and still fall short on durable community benefit. That can happen if affordability covenants expire and rents reset to market levels, or if a community facility gets repurposed away from its original mission.
Managing that risk calls for a few plain but important guardrails:
Long-duration deed restrictions
Outcome tracking tied to metrics such as the share of units affordable at or below 60% of Area Median Income (AMI)
Governance structures that keep mission-aligned partners - CDFIs, nonprofits, and local governments - actively involved
Parcel-level climate risk analytics, FEMA flood maps, and insurance premium projections should be standard underwriting inputs for any impact real estate portfolio built around a long-term community commitment.
Infrastructure has a different profile: steadier cash flows, but more dependence on contracts and public counterparts. The risk mix shifts. Cash flows are often more contract-backed, while political and operating risk move up.
Infrastructure risk profile: contract-backed cash flow, political exposure, and resilience demands
Where real estate risk is local, infrastructure risk sits more in contracts and politics. The exposure shifts away from occupancy at a single site and toward regulation, counterparty terms, and day-to-day asset performance.[6][8]
Revenue predictability, construction risk, and operating performance
The revenue model is the big separator. Availability payments, regulated tariffs, and power purchase agreements (PPAs) tie returns to core services like power, water, and mobility, not to tenant demand. In many cases, that leads to steadier cash flow than real estate. User-fee assets are the exception, since they still carry demand risk.
That steadier income comes with its own trade-offs. Infrastructure projects can face heavy construction and delivery risk. Greenfield assets and major expansions often require long build-out periods, tough engineering work, and coordination across many contractors. Megaprojects often miss budget and schedule targets because costs and timelines are underestimated.[9]
To keep that risk in check, investors usually lean on a few standard protections:
Fixed-price, date-certain EPC (Engineering, Procurement, and Construction) contracts with liquidated damages
Independent engineer reports
Conservative resource assessments, such as P90 production scenarios for wind and solar
Once the asset is up and running, operating performance becomes the next pressure point. Technology performance matters, especially in renewables, where capacity factors, equipment degradation rates, and grid integration needs feed straight into realized cash flow.
Political, regulatory, and public-private contract risk
Infrastructure returns also rest heavily on government action. A rate case before a state public utility commission can squeeze returns if regulators deny cost recovery or cap increases because of affordability concerns. Permitting delays for transmission lines, wind farms, or large water projects can add years to a timeline and push costs much higher. Even long-term concession contracts, built to spell out risk allocation, can still be reopened when public priorities change or tariffs spark political backlash.
Renegotiation risk is not a side issue. In Latin America and the Caribbean between 1985 and 2000, 10% of electricity concessions, 55% of transport concessions, and 75% of water concessions were renegotiated.[5] Those figures make the point plainly.
For impact investors, regulatory and political due diligence cannot be skipped. That means looking at how the relevant commissions have acted in the past, mapping stakeholder positions, and checking that contracts include change-in-law clauses, strong dispute-resolution mechanisms, and step-in rights for lenders.
Climate resilience and service disruption risk
Infrastructure faces physical climate risk in a different way than real estate. A problem in one building is often contained. A failure at a substation, water treatment plant, or another critical node can spread through an entire network. When those nodes fail, service losses can cascade across hospitals, businesses, and households. Those outages can turn into public and political crises fast, adding financial and reputational pressure.[7]
Resilience planning needs to go past old design standards. Core underwriting should use forward-looking climate scenarios, asset-level hazard maps, and backup systems. In plain terms, that includes mapping flood zones, wildfire risk scores, and sea-level-rise projections at the asset level; checking redundancy and backup options such as microgrids; and working with local authorities early on adaptation plans.
These differences become clearer in the side-by-side comparison below.
Real estate vs. infrastructure: side-by-side risk comparison
Real estate and infrastructure can both sit inside an impact portfolio, but they break in different ways. Real estate usually lives or dies on local demand. Infrastructure usually lives or dies on contracts and regulation. That split matters for returns, day-to-day cash flow, and how long a social or environmental result can hold up.
The table below is the fast read: property risk starts with demand; infrastructure risk starts with contracts and public oversight.
Risk comparison table: liquidity, revenue, regulation, climate, and impact risk
Risk Dimension | Real Estate | Infrastructure |
|---|---|---|
Liquidity / exit risk | High; direct sales can take months, and listed REITs improve liquidity but can move with public equities in stressed markets | High; closed-end fund lock-ups are common, and secondary markets are limited and often discounted |
Income volatility | Higher; rents and occupancy depend on local demand cycles, and U.S. office vacancy reached roughly 19% to 21% in late 2024 and early 2025[10][11][12][13] | Lower for contracted assets; user-fee assets like toll roads and airports still carry demand risk |
Tenant/user concentration | High; single-tenant or anchor-tenant concentration can sharply reduce income if occupancy falls | Moderate; utilities often have broad user bases, but public-sector counterparties can still create concentration risk |
Political and regulatory exposure | Moderate; zoning, rent control, and building codes matter, but pricing is still largely market-driven | High; tariff regulation, concession terms, and PPP structure can directly shape revenue |
Asset-level climate risk | Asset-specific; coastal flood, wildfire, and heat risk vary by zip code and can affect insurance costs and liquidity[3] | Systemic; a failure at one node, such as a substation or water plant, can cascade across an entire network[7] |
Decarbonization / retrofit risk | High; energy codes, emissions rules, and building standards can force costly retrofits[1][16] | Moderate to high; energy systems, mobility patterns, and utility regulation are changing as decarbonization advances |
Impact verification risk | Moderate; affordability and displacement data are often fragmented or self-reported | Moderate; service access metrics are clearer, but attribution across investors and policy programs is still difficult |
Where real estate usually carries higher risk
On the real estate side, the pressure point is local demand. When demand drops and there is no contract-based floor under income, cash flow can weaken fast. The U.S. office market is a clear example. Vacancy reached roughly 19% to 21% in late 2024 and early 2025[10][11][12][13]. That kind of shift can leave buildings half-used, rents under strain, and exit options thin.
Affordable housing adds another layer. Portfolios concentrated in high-risk zip codes can face older building stock, heavier capital spending, and neighborhood climate threats such as coastal flooding or extreme heat. In plain terms, the property may need more money at the same moment the surrounding area becomes harder to insure, finance, or sell[3]. On top of that, place-based investment can cut both ways. A plan meant to help underserved communities can also fuel affordability pressure or gentrification if community input and rent protections are missing at the start[14][15].
Where infrastructure usually carries higher risk
On the infrastructure side, the weak point is public decision-making. Risk climbs when tariffs, permits, and concessions depend on government bodies or regulated processes. Rate cases, permit delays, and contract renegotiations are not side issues here; they are part of the job.
Infrastructure also carries a bigger system effect. If one apartment building struggles, the damage usually stays at the asset level. If a grid node fails or a water system goes down, the fallout can hit hospitals, schools, and thousands of households at once[7]. That can bring regulator attention, service pressure, and reputational damage that stretch well past the immediate dollar loss. In impact investing, that same system reach is what gives infrastructure so much upside on service delivery - and so much downside when something goes wrong.
Portfolio implications and conclusion
How to align asset selection with impact goals and risk tolerance
These differences show up most clearly when you put money to work. The first step is simple: match the asset class to the job you want it to do in the portfolio. If the goal is steadier income, contracted infrastructure often fits better. If the goal is place-based community effect, real estate can be the better match.
Risk tolerance shapes the next move. Investors with a lower appetite for risk may lean toward core, contracted assets with more stable cash flow. Investors who can take on more uncertainty may look at value-add strategies or development-stage deals. That split matters, because the return path can look very different depending on whether income is already in place or still being built.
A blended approach can make a lot of sense. Pairing affordable housing with community solar or battery storage, for example, can balance local impact with contracted cash flow. It’s a practical way to avoid putting the whole portfolio on one side of the risk spectrum.
Climate underwriting also needs to match the asset class. With real estate, the focus is often on insurance costs, retrofit needs, and physical hazard exposure. With infrastructure, the pressure points tend to be contract duration, regulation, and service resilience. When those choices are tied back to the six lenses used throughout this article - income stability, liquidity, regulation, counterparty exposure, climate risk, and impact delivery risk - allocation decisions stay anchored in the actual risk profile of each asset class.
Conclusion: Key differences that should shape allocation decisions
Through those six lenses, allocation looks less like a hunt for the “safer” asset class and more like a risk-matching exercise. That’s the main takeaway.
The distinction is straightforward. Real estate risk is local. It tends to move with property conditions, tenant demand, and neighborhood-level forces. Infrastructure risk is structural. It tends to move with contracts, regulation, and public policy. Neither one is automatically safer. They just fail in different ways and on different timelines.
That’s why climate risk and impact risk belong in the financial case from the start, not as an afterthought.
FAQs
Which asset class is more resilient in a recession?
There’s no fixed rule here. How well an asset holds up in a recession depends less on whether it sits under real estate or infrastructure and more on its exact risk exposure - and how well that risk is handled.
Real estate tends to be more exposed to local physical climate hazards and economic swings. Infrastructure, by contrast, often carries longer-term risks, such as interest rate changes or shifts in government subsidies.
How should I balance real estate and infrastructure in an impact portfolio?
Use a blended approach: make ESG integration the baseline for risk management across all holdings, then set aside dedicated impact allocations - often 5% to 20% of total assets - for specific private-market outcomes.
Real estate is tied to place, so it faces more direct physical climate risk. Infrastructure, by contrast, can back resilience and energy themes. The smart move is to balance both with climate risk assessments, stress tests, hazard mapping, and scenario analysis.
What due diligence matters most before investing in each one?
For real estate, put the spotlight on physical climate risk. That means sea-level rise, stronger storms, heat, flooding, and other extreme weather events that can hit asset value and operating costs hard. It also means tracking energy, water, and waste performance with care. On top of that, teams need to confirm compliance with building performance standards and deal with tenant utility data gaps early. If that data is missing or messy, future capital needs can sneak up on you.
For infrastructure, the time horizon is much longer, so the lens has to widen. The main concern is long-term risk, with close attention to transition risks such as policy changes and carbon pricing. Scenario-based stress testing can help owners and operators see how assets may hold up over decades of climate swings, while also pointing to weak spots before they turn into costly problems.
Related Blog Posts
Latest Articles
©2026

Narrative Change and Power Building: The Missing Half of Advocacy
Narrative change is the process of disrupting dominant narratives that normalize inequity and advancing new narratives from historically marginalized communities.

Funding Resilience Without Federal Grants
BRIC is unreliable and FEMA is shrinking. Here's how cities fund climate resilience with dedicated revenue, blended finance, and a coordinating authority.

The ESG Blind Spot: How AI Is Finding Risks in Companies Nobody Else Is Watching
Norway's sovereign wealth fund uses AI to screen 7,200 portfolio companies for forced labor and corruption within 24 hours. The real story is the emerging-market coverage gap that traditional ESG data vendors miss — and what it means for any company with a global supply chain.
Narrative Change and Power Building: The Missing Half of Advocacy
Narrative change is the process of disrupting dominant narratives that normalize inequity and advancing new narratives from historically marginalized communities.
Funding Resilience Without Federal Grants
BRIC is unreliable and FEMA is shrinking. Here's how cities fund climate resilience with dedicated revenue, blended finance, and a coordinating authority.
The ESG Blind Spot: How AI Is Finding Risks in Companies Nobody Else Is Watching
Norway's sovereign wealth fund uses AI to screen 7,200 portfolio companies for forced labor and corruption within 24 hours. The real story is the emerging-market coverage gap that traditional ESG data vendors miss — and what it means for any company with a global supply chain.
FAQ
01
What does it really mean to “redefine profit”?
02
What makes Council Fire different?
03
Who does Council Fire work with?
04
What does working with Council Fire actually look like?
05
How does Council Fire help organizations turn big goals into action?
06
How does Council Fire define and measure success?
07
How does technology fit into Council Fire’s work?
Jul 18, 2026
Real Estate vs. Infrastructure: Risk Profiles
ESG Strategy
In This Article
Real estate risks are local—vacancy, zoning and climate—while infrastructure risks stem from contracts, regulation and system resilience.
Real Estate vs. Infrastructure: Risk Profiles
If I had to boil it down to one line, it’s this: real estate risk is mostly local, while infrastructure risk is mostly contract- and policy-driven. For an impact portfolio, that means I would judge these assets less by headline yield and more by how they fail under stress.
Right away, here’s what matters most to me:
Real estate is more exposed to vacancy, local demand, zoning, insurance costs, and property-level climate threats
Infrastructure is more exposed to contracts, public policy, counterparty strength, construction delays, and service outages
Both can offer long-term income and some inflation linkage, but their weak points are different
In impact investing, I also have to look at impact-delivery risk: will the housing stay affordable, or will the asset keep delivering power, water, or transit as planned?
A few facts from the article make that split clear:
About $1.2 trillion of $5.9 trillion in U.S. CRE loans was set to mature in 2024–2025
U.S. office vacancy was about 19% to 21% in late 2024 and early 2025
In one cited sample from Latin America and the Caribbean, renegotiation hit 10% of electricity, 55% of transport, and 75% of water concessions
So when I compare the two, I focus on six things:
Income stability
Liquidity
Regulation
Counterparty exposure
Climate risk
Impact delivery risk
Real Estate vs. Infrastructure: Risk Profile Comparison for Impact Investors
If You Don't Understand Infrastructure Investing, Watch This
Quick Comparison
Criteria | Real Estate | Infrastructure |
|---|---|---|
Main revenue risk | Occupancy and rent levels | Contract terms, tariffs, or usage levels |
Liquidity | Often low; sales can take time | Often low; secondaries can be thin |
Regulatory exposure | Zoning, codes, rent rules, tax credits | Rate cases, permits, concessions, PPP terms |
Counterparty risk | Tenants and local demand | Utilities, offtakers, public agencies |
Climate risk | Property-specific flood, heat, wildfire, insurance stress | Network disruption, node failure, service interruption |
Impact risk | Affordability can fade; mission drift can occur | Service targets may slip if policy or asset performance changes |
My takeaway: if I want place-based social outcomes, real estate may fit better. If I want more contract-backed cash flow, infrastructure may fit better. But neither is “lower risk” across the board. They just carry different types of risk, and that should shape how I allocate capital.
Real estate risk profile: market exposure, location risk, and impact execution
Real estate is tied to place. Demand is local. Zoning is local. Climate risk is local. In impact portfolios, that means the job isn't just to ask whether a building performs on paper. You also have to ask whether it keeps delivering affordable housing or community services over time. That puts underwriting at the property level, with a sharp focus on income stability, policy exposure, and climate resilience.
Income volatility, vacancy, and liquidity constraints
Rental income in impact real estate depends on tenant turnover, vacancy, operating costs, and financing structure. Affordable housing backed by Low-Income Housing Tax Credit (LIHTC) programs or Housing Choice Vouchers often sees lower turnover than market-rate multifamily, and those subsidies can steady rent payments. But the property is still exposed to local market strain. If utilities, insurance, property taxes, and capital expenses climb faster than allowed rents, net operating income (NOI) gets squeezed.
Refinancing risk is another pressure point. Loans made during the low-rate period of 2020–2021 may face much higher borrowing costs when they mature, which can weaken debt service coverage ratios (DSCR). Across U.S. commercial real estate, about $1.2 trillion of the $5.9 trillion in outstanding CRE loans was scheduled to mature in 2024–2025, with more than half held by banks.[4] In regulated affordable housing, where owners can't freely lift rents to offset higher financing costs, that rollover risk can open a very real cash flow gap.
Liquidity can make a bad situation worse. Specialized impact properties such as supportive housing or community health centers often attract a smaller pool of buyers. In plain terms, if you need to sell fast, you may have to take a discount to stabilized value. In these deals, cash flow risk and affordability compliance tend to be tightly linked.
Zoning, housing policy, and decarbonization upgrade risk
Programs like LIHTC, New Markets Tax Credits (NMTC), and local property tax abatements can make affordable and community-serving projects pencil out. They also bring compliance risk, recapture risk, and sunset risk. Zoning and land-use rules add another layer through delays, added conditions, or outright denial. If covenants expire or compliance slips, the impact case weakens even when the asset still works financially.
Decarbonization upgrade risk is also becoming more material. Municipal building performance standards, emissions caps, and energy-use benchmarks are increasing across U.S. cities. Older multifamily and community buildings may need major capital spending for HVAC electrification, insulation, and on-site renewables. Skip those upgrades, and the costs can show up in a few ways:
Fines
Higher operating costs
Harder financing
Weaker occupancy
Tools like Property Assessed Clean Energy (PACE) loans can help fund these projects, but they also add complexity to the capital stack. And those policy pressures don't sit in isolation. They stack on top of location-based climate exposure.
Physical climate risk and social outcome risk
Flood and heat risk can directly reduce NOI and property value.[2][3] In higher-risk areas, lenders may ask for larger down payments or charge higher interest rates to offset possible value declines.[2] If a property can't be insured or used as collateral, it can become stranded.[3] Extreme heat hits older housing stock and low-income communities especially hard, pushing up utility costs and creating habitability issues that can weaken occupancy and community stability.
Social outcome risk sits right beside financial risk in impact real estate, and the two don't always move in sync. A project can hit its financial targets and still fall short on durable community benefit. That can happen if affordability covenants expire and rents reset to market levels, or if a community facility gets repurposed away from its original mission.
Managing that risk calls for a few plain but important guardrails:
Long-duration deed restrictions
Outcome tracking tied to metrics such as the share of units affordable at or below 60% of Area Median Income (AMI)
Governance structures that keep mission-aligned partners - CDFIs, nonprofits, and local governments - actively involved
Parcel-level climate risk analytics, FEMA flood maps, and insurance premium projections should be standard underwriting inputs for any impact real estate portfolio built around a long-term community commitment.
Infrastructure has a different profile: steadier cash flows, but more dependence on contracts and public counterparts. The risk mix shifts. Cash flows are often more contract-backed, while political and operating risk move up.
Infrastructure risk profile: contract-backed cash flow, political exposure, and resilience demands
Where real estate risk is local, infrastructure risk sits more in contracts and politics. The exposure shifts away from occupancy at a single site and toward regulation, counterparty terms, and day-to-day asset performance.[6][8]
Revenue predictability, construction risk, and operating performance
The revenue model is the big separator. Availability payments, regulated tariffs, and power purchase agreements (PPAs) tie returns to core services like power, water, and mobility, not to tenant demand. In many cases, that leads to steadier cash flow than real estate. User-fee assets are the exception, since they still carry demand risk.
That steadier income comes with its own trade-offs. Infrastructure projects can face heavy construction and delivery risk. Greenfield assets and major expansions often require long build-out periods, tough engineering work, and coordination across many contractors. Megaprojects often miss budget and schedule targets because costs and timelines are underestimated.[9]
To keep that risk in check, investors usually lean on a few standard protections:
Fixed-price, date-certain EPC (Engineering, Procurement, and Construction) contracts with liquidated damages
Independent engineer reports
Conservative resource assessments, such as P90 production scenarios for wind and solar
Once the asset is up and running, operating performance becomes the next pressure point. Technology performance matters, especially in renewables, where capacity factors, equipment degradation rates, and grid integration needs feed straight into realized cash flow.
Political, regulatory, and public-private contract risk
Infrastructure returns also rest heavily on government action. A rate case before a state public utility commission can squeeze returns if regulators deny cost recovery or cap increases because of affordability concerns. Permitting delays for transmission lines, wind farms, or large water projects can add years to a timeline and push costs much higher. Even long-term concession contracts, built to spell out risk allocation, can still be reopened when public priorities change or tariffs spark political backlash.
Renegotiation risk is not a side issue. In Latin America and the Caribbean between 1985 and 2000, 10% of electricity concessions, 55% of transport concessions, and 75% of water concessions were renegotiated.[5] Those figures make the point plainly.
For impact investors, regulatory and political due diligence cannot be skipped. That means looking at how the relevant commissions have acted in the past, mapping stakeholder positions, and checking that contracts include change-in-law clauses, strong dispute-resolution mechanisms, and step-in rights for lenders.
Climate resilience and service disruption risk
Infrastructure faces physical climate risk in a different way than real estate. A problem in one building is often contained. A failure at a substation, water treatment plant, or another critical node can spread through an entire network. When those nodes fail, service losses can cascade across hospitals, businesses, and households. Those outages can turn into public and political crises fast, adding financial and reputational pressure.[7]
Resilience planning needs to go past old design standards. Core underwriting should use forward-looking climate scenarios, asset-level hazard maps, and backup systems. In plain terms, that includes mapping flood zones, wildfire risk scores, and sea-level-rise projections at the asset level; checking redundancy and backup options such as microgrids; and working with local authorities early on adaptation plans.
These differences become clearer in the side-by-side comparison below.
Real estate vs. infrastructure: side-by-side risk comparison
Real estate and infrastructure can both sit inside an impact portfolio, but they break in different ways. Real estate usually lives or dies on local demand. Infrastructure usually lives or dies on contracts and regulation. That split matters for returns, day-to-day cash flow, and how long a social or environmental result can hold up.
The table below is the fast read: property risk starts with demand; infrastructure risk starts with contracts and public oversight.
Risk comparison table: liquidity, revenue, regulation, climate, and impact risk
Risk Dimension | Real Estate | Infrastructure |
|---|---|---|
Liquidity / exit risk | High; direct sales can take months, and listed REITs improve liquidity but can move with public equities in stressed markets | High; closed-end fund lock-ups are common, and secondary markets are limited and often discounted |
Income volatility | Higher; rents and occupancy depend on local demand cycles, and U.S. office vacancy reached roughly 19% to 21% in late 2024 and early 2025[10][11][12][13] | Lower for contracted assets; user-fee assets like toll roads and airports still carry demand risk |
Tenant/user concentration | High; single-tenant or anchor-tenant concentration can sharply reduce income if occupancy falls | Moderate; utilities often have broad user bases, but public-sector counterparties can still create concentration risk |
Political and regulatory exposure | Moderate; zoning, rent control, and building codes matter, but pricing is still largely market-driven | High; tariff regulation, concession terms, and PPP structure can directly shape revenue |
Asset-level climate risk | Asset-specific; coastal flood, wildfire, and heat risk vary by zip code and can affect insurance costs and liquidity[3] | Systemic; a failure at one node, such as a substation or water plant, can cascade across an entire network[7] |
Decarbonization / retrofit risk | High; energy codes, emissions rules, and building standards can force costly retrofits[1][16] | Moderate to high; energy systems, mobility patterns, and utility regulation are changing as decarbonization advances |
Impact verification risk | Moderate; affordability and displacement data are often fragmented or self-reported | Moderate; service access metrics are clearer, but attribution across investors and policy programs is still difficult |
Where real estate usually carries higher risk
On the real estate side, the pressure point is local demand. When demand drops and there is no contract-based floor under income, cash flow can weaken fast. The U.S. office market is a clear example. Vacancy reached roughly 19% to 21% in late 2024 and early 2025[10][11][12][13]. That kind of shift can leave buildings half-used, rents under strain, and exit options thin.
Affordable housing adds another layer. Portfolios concentrated in high-risk zip codes can face older building stock, heavier capital spending, and neighborhood climate threats such as coastal flooding or extreme heat. In plain terms, the property may need more money at the same moment the surrounding area becomes harder to insure, finance, or sell[3]. On top of that, place-based investment can cut both ways. A plan meant to help underserved communities can also fuel affordability pressure or gentrification if community input and rent protections are missing at the start[14][15].
Where infrastructure usually carries higher risk
On the infrastructure side, the weak point is public decision-making. Risk climbs when tariffs, permits, and concessions depend on government bodies or regulated processes. Rate cases, permit delays, and contract renegotiations are not side issues here; they are part of the job.
Infrastructure also carries a bigger system effect. If one apartment building struggles, the damage usually stays at the asset level. If a grid node fails or a water system goes down, the fallout can hit hospitals, schools, and thousands of households at once[7]. That can bring regulator attention, service pressure, and reputational damage that stretch well past the immediate dollar loss. In impact investing, that same system reach is what gives infrastructure so much upside on service delivery - and so much downside when something goes wrong.
Portfolio implications and conclusion
How to align asset selection with impact goals and risk tolerance
These differences show up most clearly when you put money to work. The first step is simple: match the asset class to the job you want it to do in the portfolio. If the goal is steadier income, contracted infrastructure often fits better. If the goal is place-based community effect, real estate can be the better match.
Risk tolerance shapes the next move. Investors with a lower appetite for risk may lean toward core, contracted assets with more stable cash flow. Investors who can take on more uncertainty may look at value-add strategies or development-stage deals. That split matters, because the return path can look very different depending on whether income is already in place or still being built.
A blended approach can make a lot of sense. Pairing affordable housing with community solar or battery storage, for example, can balance local impact with contracted cash flow. It’s a practical way to avoid putting the whole portfolio on one side of the risk spectrum.
Climate underwriting also needs to match the asset class. With real estate, the focus is often on insurance costs, retrofit needs, and physical hazard exposure. With infrastructure, the pressure points tend to be contract duration, regulation, and service resilience. When those choices are tied back to the six lenses used throughout this article - income stability, liquidity, regulation, counterparty exposure, climate risk, and impact delivery risk - allocation decisions stay anchored in the actual risk profile of each asset class.
Conclusion: Key differences that should shape allocation decisions
Through those six lenses, allocation looks less like a hunt for the “safer” asset class and more like a risk-matching exercise. That’s the main takeaway.
The distinction is straightforward. Real estate risk is local. It tends to move with property conditions, tenant demand, and neighborhood-level forces. Infrastructure risk is structural. It tends to move with contracts, regulation, and public policy. Neither one is automatically safer. They just fail in different ways and on different timelines.
That’s why climate risk and impact risk belong in the financial case from the start, not as an afterthought.
FAQs
Which asset class is more resilient in a recession?
There’s no fixed rule here. How well an asset holds up in a recession depends less on whether it sits under real estate or infrastructure and more on its exact risk exposure - and how well that risk is handled.
Real estate tends to be more exposed to local physical climate hazards and economic swings. Infrastructure, by contrast, often carries longer-term risks, such as interest rate changes or shifts in government subsidies.
How should I balance real estate and infrastructure in an impact portfolio?
Use a blended approach: make ESG integration the baseline for risk management across all holdings, then set aside dedicated impact allocations - often 5% to 20% of total assets - for specific private-market outcomes.
Real estate is tied to place, so it faces more direct physical climate risk. Infrastructure, by contrast, can back resilience and energy themes. The smart move is to balance both with climate risk assessments, stress tests, hazard mapping, and scenario analysis.
What due diligence matters most before investing in each one?
For real estate, put the spotlight on physical climate risk. That means sea-level rise, stronger storms, heat, flooding, and other extreme weather events that can hit asset value and operating costs hard. It also means tracking energy, water, and waste performance with care. On top of that, teams need to confirm compliance with building performance standards and deal with tenant utility data gaps early. If that data is missing or messy, future capital needs can sneak up on you.
For infrastructure, the time horizon is much longer, so the lens has to widen. The main concern is long-term risk, with close attention to transition risks such as policy changes and carbon pricing. Scenario-based stress testing can help owners and operators see how assets may hold up over decades of climate swings, while also pointing to weak spots before they turn into costly problems.
Related Blog Posts
Latest Articles
©2026
Narrative Change and Power Building: The Missing Half of Advocacy
Narrative change is the process of disrupting dominant narratives that normalize inequity and advancing new narratives from historically marginalized communities.
Funding Resilience Without Federal Grants
BRIC is unreliable and FEMA is shrinking. Here's how cities fund climate resilience with dedicated revenue, blended finance, and a coordinating authority.
The ESG Blind Spot: How AI Is Finding Risks in Companies Nobody Else Is Watching
Norway's sovereign wealth fund uses AI to screen 7,200 portfolio companies for forced labor and corruption within 24 hours. The real story is the emerging-market coverage gap that traditional ESG data vendors miss — and what it means for any company with a global supply chain.
FAQ
01
What does it really mean to “redefine profit”?
02
What makes Council Fire different?
03
Who does Council Fire work with?
04
What does working with Council Fire actually look like?
05
How does Council Fire help organizations turn big goals into action?
06
How does Council Fire define and measure success?
07
How does technology fit into Council Fire’s work?
Jul 18, 2026
Real Estate vs. Infrastructure: Risk Profiles
ESG Strategy
In This Article
Real estate risks are local—vacancy, zoning and climate—while infrastructure risks stem from contracts, regulation and system resilience.
Real Estate vs. Infrastructure: Risk Profiles
If I had to boil it down to one line, it’s this: real estate risk is mostly local, while infrastructure risk is mostly contract- and policy-driven. For an impact portfolio, that means I would judge these assets less by headline yield and more by how they fail under stress.
Right away, here’s what matters most to me:
Real estate is more exposed to vacancy, local demand, zoning, insurance costs, and property-level climate threats
Infrastructure is more exposed to contracts, public policy, counterparty strength, construction delays, and service outages
Both can offer long-term income and some inflation linkage, but their weak points are different
In impact investing, I also have to look at impact-delivery risk: will the housing stay affordable, or will the asset keep delivering power, water, or transit as planned?
A few facts from the article make that split clear:
About $1.2 trillion of $5.9 trillion in U.S. CRE loans was set to mature in 2024–2025
U.S. office vacancy was about 19% to 21% in late 2024 and early 2025
In one cited sample from Latin America and the Caribbean, renegotiation hit 10% of electricity, 55% of transport, and 75% of water concessions
So when I compare the two, I focus on six things:
Income stability
Liquidity
Regulation
Counterparty exposure
Climate risk
Impact delivery risk
Real Estate vs. Infrastructure: Risk Profile Comparison for Impact Investors
If You Don't Understand Infrastructure Investing, Watch This
Quick Comparison
Criteria | Real Estate | Infrastructure |
|---|---|---|
Main revenue risk | Occupancy and rent levels | Contract terms, tariffs, or usage levels |
Liquidity | Often low; sales can take time | Often low; secondaries can be thin |
Regulatory exposure | Zoning, codes, rent rules, tax credits | Rate cases, permits, concessions, PPP terms |
Counterparty risk | Tenants and local demand | Utilities, offtakers, public agencies |
Climate risk | Property-specific flood, heat, wildfire, insurance stress | Network disruption, node failure, service interruption |
Impact risk | Affordability can fade; mission drift can occur | Service targets may slip if policy or asset performance changes |
My takeaway: if I want place-based social outcomes, real estate may fit better. If I want more contract-backed cash flow, infrastructure may fit better. But neither is “lower risk” across the board. They just carry different types of risk, and that should shape how I allocate capital.
Real estate risk profile: market exposure, location risk, and impact execution
Real estate is tied to place. Demand is local. Zoning is local. Climate risk is local. In impact portfolios, that means the job isn't just to ask whether a building performs on paper. You also have to ask whether it keeps delivering affordable housing or community services over time. That puts underwriting at the property level, with a sharp focus on income stability, policy exposure, and climate resilience.
Income volatility, vacancy, and liquidity constraints
Rental income in impact real estate depends on tenant turnover, vacancy, operating costs, and financing structure. Affordable housing backed by Low-Income Housing Tax Credit (LIHTC) programs or Housing Choice Vouchers often sees lower turnover than market-rate multifamily, and those subsidies can steady rent payments. But the property is still exposed to local market strain. If utilities, insurance, property taxes, and capital expenses climb faster than allowed rents, net operating income (NOI) gets squeezed.
Refinancing risk is another pressure point. Loans made during the low-rate period of 2020–2021 may face much higher borrowing costs when they mature, which can weaken debt service coverage ratios (DSCR). Across U.S. commercial real estate, about $1.2 trillion of the $5.9 trillion in outstanding CRE loans was scheduled to mature in 2024–2025, with more than half held by banks.[4] In regulated affordable housing, where owners can't freely lift rents to offset higher financing costs, that rollover risk can open a very real cash flow gap.
Liquidity can make a bad situation worse. Specialized impact properties such as supportive housing or community health centers often attract a smaller pool of buyers. In plain terms, if you need to sell fast, you may have to take a discount to stabilized value. In these deals, cash flow risk and affordability compliance tend to be tightly linked.
Zoning, housing policy, and decarbonization upgrade risk
Programs like LIHTC, New Markets Tax Credits (NMTC), and local property tax abatements can make affordable and community-serving projects pencil out. They also bring compliance risk, recapture risk, and sunset risk. Zoning and land-use rules add another layer through delays, added conditions, or outright denial. If covenants expire or compliance slips, the impact case weakens even when the asset still works financially.
Decarbonization upgrade risk is also becoming more material. Municipal building performance standards, emissions caps, and energy-use benchmarks are increasing across U.S. cities. Older multifamily and community buildings may need major capital spending for HVAC electrification, insulation, and on-site renewables. Skip those upgrades, and the costs can show up in a few ways:
Fines
Higher operating costs
Harder financing
Weaker occupancy
Tools like Property Assessed Clean Energy (PACE) loans can help fund these projects, but they also add complexity to the capital stack. And those policy pressures don't sit in isolation. They stack on top of location-based climate exposure.
Physical climate risk and social outcome risk
Flood and heat risk can directly reduce NOI and property value.[2][3] In higher-risk areas, lenders may ask for larger down payments or charge higher interest rates to offset possible value declines.[2] If a property can't be insured or used as collateral, it can become stranded.[3] Extreme heat hits older housing stock and low-income communities especially hard, pushing up utility costs and creating habitability issues that can weaken occupancy and community stability.
Social outcome risk sits right beside financial risk in impact real estate, and the two don't always move in sync. A project can hit its financial targets and still fall short on durable community benefit. That can happen if affordability covenants expire and rents reset to market levels, or if a community facility gets repurposed away from its original mission.
Managing that risk calls for a few plain but important guardrails:
Long-duration deed restrictions
Outcome tracking tied to metrics such as the share of units affordable at or below 60% of Area Median Income (AMI)
Governance structures that keep mission-aligned partners - CDFIs, nonprofits, and local governments - actively involved
Parcel-level climate risk analytics, FEMA flood maps, and insurance premium projections should be standard underwriting inputs for any impact real estate portfolio built around a long-term community commitment.
Infrastructure has a different profile: steadier cash flows, but more dependence on contracts and public counterparts. The risk mix shifts. Cash flows are often more contract-backed, while political and operating risk move up.
Infrastructure risk profile: contract-backed cash flow, political exposure, and resilience demands
Where real estate risk is local, infrastructure risk sits more in contracts and politics. The exposure shifts away from occupancy at a single site and toward regulation, counterparty terms, and day-to-day asset performance.[6][8]
Revenue predictability, construction risk, and operating performance
The revenue model is the big separator. Availability payments, regulated tariffs, and power purchase agreements (PPAs) tie returns to core services like power, water, and mobility, not to tenant demand. In many cases, that leads to steadier cash flow than real estate. User-fee assets are the exception, since they still carry demand risk.
That steadier income comes with its own trade-offs. Infrastructure projects can face heavy construction and delivery risk. Greenfield assets and major expansions often require long build-out periods, tough engineering work, and coordination across many contractors. Megaprojects often miss budget and schedule targets because costs and timelines are underestimated.[9]
To keep that risk in check, investors usually lean on a few standard protections:
Fixed-price, date-certain EPC (Engineering, Procurement, and Construction) contracts with liquidated damages
Independent engineer reports
Conservative resource assessments, such as P90 production scenarios for wind and solar
Once the asset is up and running, operating performance becomes the next pressure point. Technology performance matters, especially in renewables, where capacity factors, equipment degradation rates, and grid integration needs feed straight into realized cash flow.
Political, regulatory, and public-private contract risk
Infrastructure returns also rest heavily on government action. A rate case before a state public utility commission can squeeze returns if regulators deny cost recovery or cap increases because of affordability concerns. Permitting delays for transmission lines, wind farms, or large water projects can add years to a timeline and push costs much higher. Even long-term concession contracts, built to spell out risk allocation, can still be reopened when public priorities change or tariffs spark political backlash.
Renegotiation risk is not a side issue. In Latin America and the Caribbean between 1985 and 2000, 10% of electricity concessions, 55% of transport concessions, and 75% of water concessions were renegotiated.[5] Those figures make the point plainly.
For impact investors, regulatory and political due diligence cannot be skipped. That means looking at how the relevant commissions have acted in the past, mapping stakeholder positions, and checking that contracts include change-in-law clauses, strong dispute-resolution mechanisms, and step-in rights for lenders.
Climate resilience and service disruption risk
Infrastructure faces physical climate risk in a different way than real estate. A problem in one building is often contained. A failure at a substation, water treatment plant, or another critical node can spread through an entire network. When those nodes fail, service losses can cascade across hospitals, businesses, and households. Those outages can turn into public and political crises fast, adding financial and reputational pressure.[7]
Resilience planning needs to go past old design standards. Core underwriting should use forward-looking climate scenarios, asset-level hazard maps, and backup systems. In plain terms, that includes mapping flood zones, wildfire risk scores, and sea-level-rise projections at the asset level; checking redundancy and backup options such as microgrids; and working with local authorities early on adaptation plans.
These differences become clearer in the side-by-side comparison below.
Real estate vs. infrastructure: side-by-side risk comparison
Real estate and infrastructure can both sit inside an impact portfolio, but they break in different ways. Real estate usually lives or dies on local demand. Infrastructure usually lives or dies on contracts and regulation. That split matters for returns, day-to-day cash flow, and how long a social or environmental result can hold up.
The table below is the fast read: property risk starts with demand; infrastructure risk starts with contracts and public oversight.
Risk comparison table: liquidity, revenue, regulation, climate, and impact risk
Risk Dimension | Real Estate | Infrastructure |
|---|---|---|
Liquidity / exit risk | High; direct sales can take months, and listed REITs improve liquidity but can move with public equities in stressed markets | High; closed-end fund lock-ups are common, and secondary markets are limited and often discounted |
Income volatility | Higher; rents and occupancy depend on local demand cycles, and U.S. office vacancy reached roughly 19% to 21% in late 2024 and early 2025[10][11][12][13] | Lower for contracted assets; user-fee assets like toll roads and airports still carry demand risk |
Tenant/user concentration | High; single-tenant or anchor-tenant concentration can sharply reduce income if occupancy falls | Moderate; utilities often have broad user bases, but public-sector counterparties can still create concentration risk |
Political and regulatory exposure | Moderate; zoning, rent control, and building codes matter, but pricing is still largely market-driven | High; tariff regulation, concession terms, and PPP structure can directly shape revenue |
Asset-level climate risk | Asset-specific; coastal flood, wildfire, and heat risk vary by zip code and can affect insurance costs and liquidity[3] | Systemic; a failure at one node, such as a substation or water plant, can cascade across an entire network[7] |
Decarbonization / retrofit risk | High; energy codes, emissions rules, and building standards can force costly retrofits[1][16] | Moderate to high; energy systems, mobility patterns, and utility regulation are changing as decarbonization advances |
Impact verification risk | Moderate; affordability and displacement data are often fragmented or self-reported | Moderate; service access metrics are clearer, but attribution across investors and policy programs is still difficult |
Where real estate usually carries higher risk
On the real estate side, the pressure point is local demand. When demand drops and there is no contract-based floor under income, cash flow can weaken fast. The U.S. office market is a clear example. Vacancy reached roughly 19% to 21% in late 2024 and early 2025[10][11][12][13]. That kind of shift can leave buildings half-used, rents under strain, and exit options thin.
Affordable housing adds another layer. Portfolios concentrated in high-risk zip codes can face older building stock, heavier capital spending, and neighborhood climate threats such as coastal flooding or extreme heat. In plain terms, the property may need more money at the same moment the surrounding area becomes harder to insure, finance, or sell[3]. On top of that, place-based investment can cut both ways. A plan meant to help underserved communities can also fuel affordability pressure or gentrification if community input and rent protections are missing at the start[14][15].
Where infrastructure usually carries higher risk
On the infrastructure side, the weak point is public decision-making. Risk climbs when tariffs, permits, and concessions depend on government bodies or regulated processes. Rate cases, permit delays, and contract renegotiations are not side issues here; they are part of the job.
Infrastructure also carries a bigger system effect. If one apartment building struggles, the damage usually stays at the asset level. If a grid node fails or a water system goes down, the fallout can hit hospitals, schools, and thousands of households at once[7]. That can bring regulator attention, service pressure, and reputational damage that stretch well past the immediate dollar loss. In impact investing, that same system reach is what gives infrastructure so much upside on service delivery - and so much downside when something goes wrong.
Portfolio implications and conclusion
How to align asset selection with impact goals and risk tolerance
These differences show up most clearly when you put money to work. The first step is simple: match the asset class to the job you want it to do in the portfolio. If the goal is steadier income, contracted infrastructure often fits better. If the goal is place-based community effect, real estate can be the better match.
Risk tolerance shapes the next move. Investors with a lower appetite for risk may lean toward core, contracted assets with more stable cash flow. Investors who can take on more uncertainty may look at value-add strategies or development-stage deals. That split matters, because the return path can look very different depending on whether income is already in place or still being built.
A blended approach can make a lot of sense. Pairing affordable housing with community solar or battery storage, for example, can balance local impact with contracted cash flow. It’s a practical way to avoid putting the whole portfolio on one side of the risk spectrum.
Climate underwriting also needs to match the asset class. With real estate, the focus is often on insurance costs, retrofit needs, and physical hazard exposure. With infrastructure, the pressure points tend to be contract duration, regulation, and service resilience. When those choices are tied back to the six lenses used throughout this article - income stability, liquidity, regulation, counterparty exposure, climate risk, and impact delivery risk - allocation decisions stay anchored in the actual risk profile of each asset class.
Conclusion: Key differences that should shape allocation decisions
Through those six lenses, allocation looks less like a hunt for the “safer” asset class and more like a risk-matching exercise. That’s the main takeaway.
The distinction is straightforward. Real estate risk is local. It tends to move with property conditions, tenant demand, and neighborhood-level forces. Infrastructure risk is structural. It tends to move with contracts, regulation, and public policy. Neither one is automatically safer. They just fail in different ways and on different timelines.
That’s why climate risk and impact risk belong in the financial case from the start, not as an afterthought.
FAQs
Which asset class is more resilient in a recession?
There’s no fixed rule here. How well an asset holds up in a recession depends less on whether it sits under real estate or infrastructure and more on its exact risk exposure - and how well that risk is handled.
Real estate tends to be more exposed to local physical climate hazards and economic swings. Infrastructure, by contrast, often carries longer-term risks, such as interest rate changes or shifts in government subsidies.
How should I balance real estate and infrastructure in an impact portfolio?
Use a blended approach: make ESG integration the baseline for risk management across all holdings, then set aside dedicated impact allocations - often 5% to 20% of total assets - for specific private-market outcomes.
Real estate is tied to place, so it faces more direct physical climate risk. Infrastructure, by contrast, can back resilience and energy themes. The smart move is to balance both with climate risk assessments, stress tests, hazard mapping, and scenario analysis.
What due diligence matters most before investing in each one?
For real estate, put the spotlight on physical climate risk. That means sea-level rise, stronger storms, heat, flooding, and other extreme weather events that can hit asset value and operating costs hard. It also means tracking energy, water, and waste performance with care. On top of that, teams need to confirm compliance with building performance standards and deal with tenant utility data gaps early. If that data is missing or messy, future capital needs can sneak up on you.
For infrastructure, the time horizon is much longer, so the lens has to widen. The main concern is long-term risk, with close attention to transition risks such as policy changes and carbon pricing. Scenario-based stress testing can help owners and operators see how assets may hold up over decades of climate swings, while also pointing to weak spots before they turn into costly problems.
Related Blog Posts
Latest Articles
©2026
Narrative Change and Power Building: The Missing Half of Advocacy
Narrative change is the process of disrupting dominant narratives that normalize inequity and advancing new narratives from historically marginalized communities.
Funding Resilience Without Federal Grants
BRIC is unreliable and FEMA is shrinking. Here's how cities fund climate resilience with dedicated revenue, blended finance, and a coordinating authority.
The ESG Blind Spot: How AI Is Finding Risks in Companies Nobody Else Is Watching
Norway's sovereign wealth fund uses AI to screen 7,200 portfolio companies for forced labor and corruption within 24 hours. The real story is the emerging-market coverage gap that traditional ESG data vendors miss — and what it means for any company with a global supply chain.
FAQ
What does it really mean to “redefine profit”?
What makes Council Fire different?
Who does Council Fire work with?
What does working with Council Fire actually look like?
How does Council Fire help organizations turn big goals into action?
How does Council Fire define and measure success?
How does technology fit into Council Fire’s work?