
Apr 25, 2025
10 Metrics for Tracking Food Waste Reduction
Sustainability Strategy
10-metrics-for-tracking-food-waste-reduction
10-metrics-for-tracking-food-waste-reduction
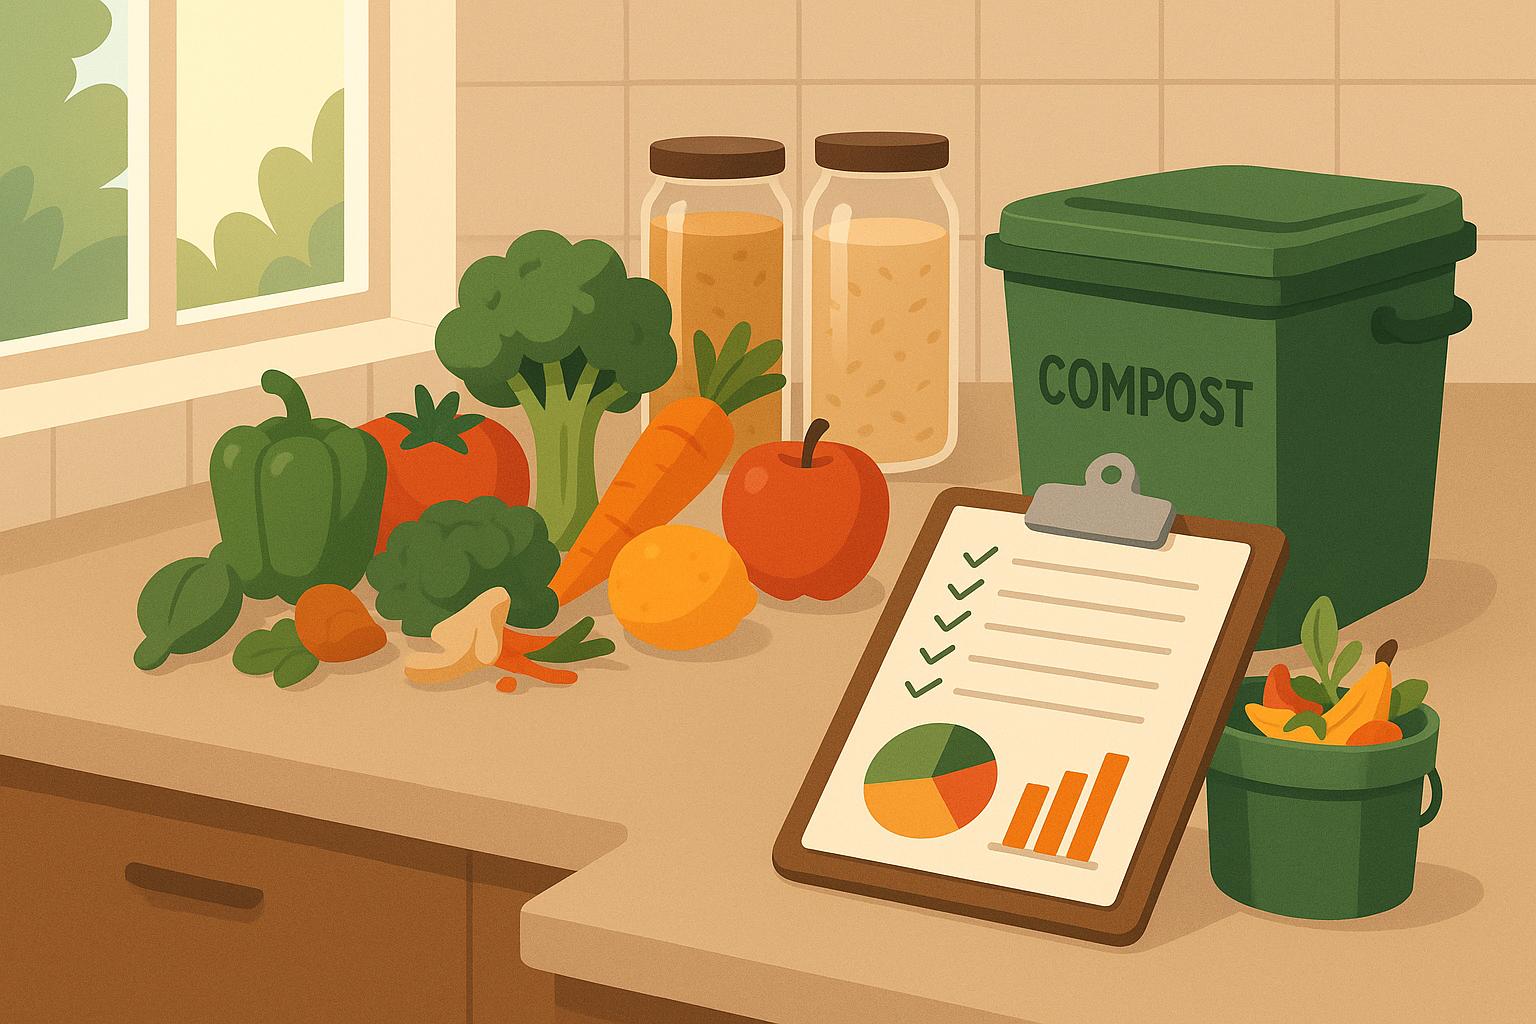
Here’s how you can measure and reduce food waste effectively:
Total Waste Volume: Measure how much waste you produce to find problem areas.
Waste per Unit: Track waste per meal, production batch, or revenue to identify inefficiencies.
Landfill Diversion Rate: Calculate the percentage of waste kept out of landfills through composting or donations.
Recycling Success Rate: Measure how much collected waste is successfully turned into compost, animal feed, or biogas.
Cost Savings: Keep track of money saved by reducing waste, like lower disposal fees and smarter inventory management.
Food Loss Before Sale: Monitor spoilage, damage, and expired products to improve storage and handling.
Uneaten Food Returns: Analyze leftovers to adjust portion sizes and menu options.
Food Bank Contributions: Track donations to measure waste reduction and community impact.
Carbon Impact Reduction: Measure how cutting waste lowers emissions from landfills and transportation.
Resource Conservation: Monitor savings in water, energy, and land use from waste reduction efforts.
Quick Tip: Start by setting up a tracking system with digital tools, physical measurements, and clear documentation. Train your staff and review data regularly to refine your strategy.
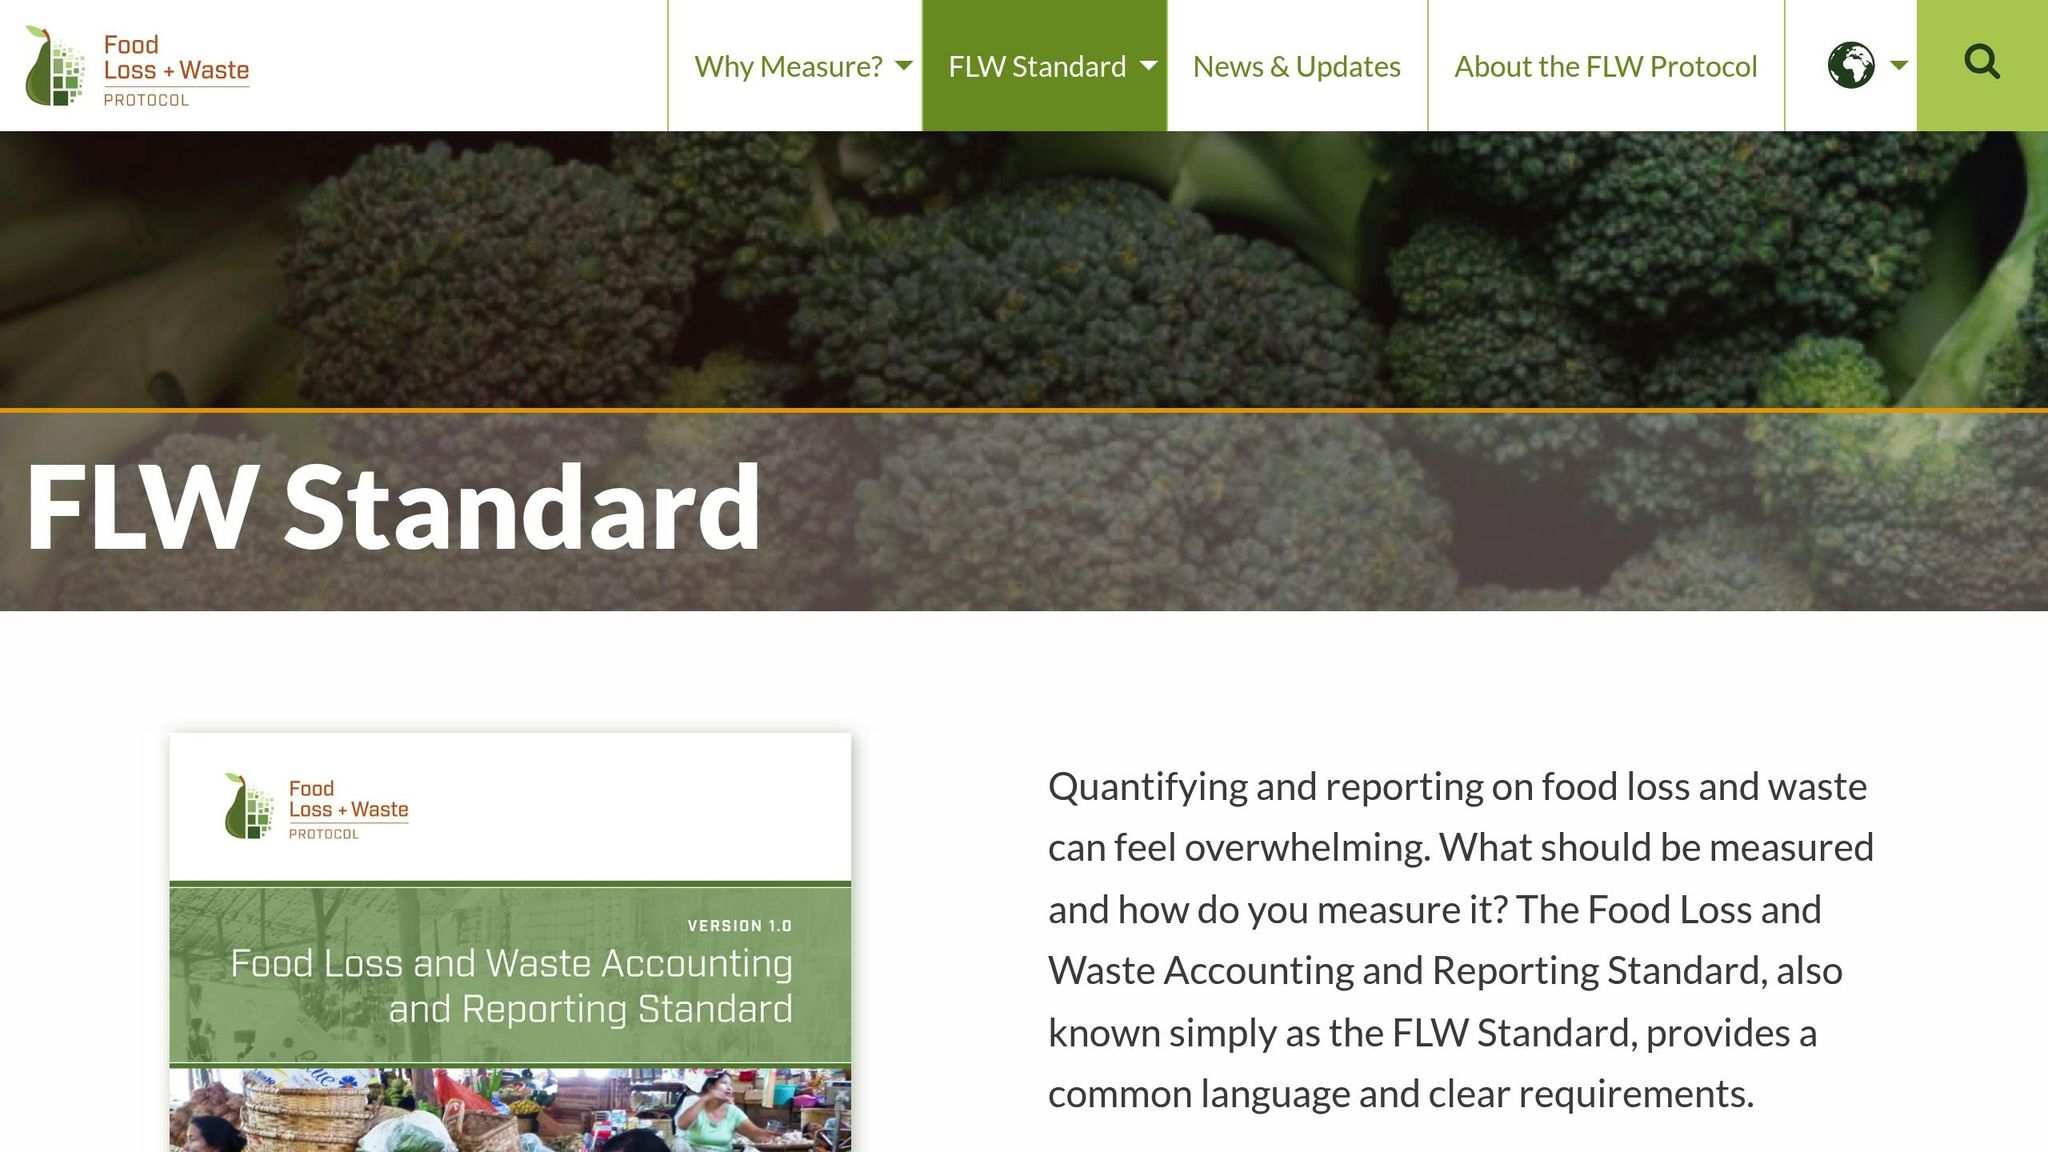
Measuring Food Waste: The Global FLW Standard
Setting Up Food Waste Measurement
Establishing a clear system for measuring food waste is essential for effective tracking. This system forms the backbone for analyzing the key metrics discussed in later sections.
A reliable setup generally includes three main components:
Digital Tracking Systems
Use waste management software to log daily waste volumes, sort waste into categories, and create automated reports. These systems can also sync with inventory management tools to provide real-time updates.
Physical Measurement Tools
Essential tools include:
Digital scales for accurate weight tracking
Transparent waste bins for easy visual checks
Color-coded containers to separate waste types
Devices to monitor storage temperatures
Documentation Protocols
Staff should consistently record:
The weight or volume of waste
Where the waste originated
The reason for disposal
Time and date of disposal
Who handled the waste
Combining automated tools (like smart bins) with manual documentation ensures a more complete picture of waste patterns.
Staff Training
Proper training is key to the system's success. Focus on:
Practicing with measurement tools
Understanding how to categorize waste
Following proper documentation steps
Holding regular refresher sessions to maintain skills
Quality Control
To maintain accuracy, implement weekly spot checks, calibrate scales monthly, and review waste categorization quarterly.
Data Integration
Link your tracking system with inventory, purchasing, sales, and accounting tools. This integration helps turn raw data into actionable insights.
As your waste reduction program evolves, adjust and refine your system to meet changing needs.
1. Total Waste Volume
Start by measuring the total amount of waste your operation generates. Use pounds for smaller businesses or tons for larger facilities. This initial measurement provides a clear starting point, helping you identify areas where waste is most concentrated and where to focus reduction efforts.
To get a more detailed picture, compare waste levels to production output. This ratio can highlight inefficiencies and guide more precise strategies.
2. Waste per Unit
Measuring waste per unit connects waste levels to specific operational metrics, helping to identify inefficiencies over time and at different scales.
For restaurants and food service businesses, track waste based on meals served. For instance, if your kitchen prepares 500 meals a day and generates 50 pounds of food waste, your waste-per-meal figure would be 0.1 pounds. This allows you to see which menu items or prep methods are causing the most waste. Similarly, in manufacturing, you can calculate waste as a percentage of total production.
For food manufacturers and processors, break waste into categories like:
Waste from raw materials during processing
Finished product waste due to quality control
Losses during storage and handling
Waste generated during distribution
Ways to measure waste:
Per $1,000 in revenue
Per 100 meals served
Per 1,000 pounds of production
Per operating hour
Track these metrics daily, then review weekly to spot trends, such as increases during delivery days or employee transitions. Adjust for seasonal changes to set realistic goals for cutting waste.
3. Landfill Diversion Rate
The landfill diversion rate shows the percentage of food waste that avoids landfills by being composted, processed through anaerobic digestion, or donated.
Formula:
Diversion Rate = ((Total Food Waste – Food Waste Sent to Landfill) / Total Food Waste) x 100
Example:
If a business generates 1,000 lbs. of food waste and sends 300 lbs. to landfills, the calculation would look like this:
(1,000 – 300) / 1,000 x 100 = 70%
This means 70% of the food waste is kept out of landfills. Up next, we’ll explore how recycling efforts can further improve waste reduction strategies.
4. Recycling Success Rate
The recycling success rate shows how efficiently your organization turns food waste into usable resources like compost, animal feed, or biogas. It helps identify areas where improvements are needed in your recycling process.
Formula:
Recycling Success Rate = (Successfully Recycled Food Waste / Total Food Waste Collected for Recycling) x 100
This percentage represents how much of the collected food waste is effectively recycled. For instance, if you gather 2,000 lbs. of food waste for composting but only 1,600 lbs. produces usable compost, your recycling success rate would be:
1,600 / 2,000 x 100 = 80%
To improve this rate, pay close attention to factors like the quality of waste collected (e.g., contamination levels), the efficiency of your recycling process, and the quality of the final recycled product. Keeping detailed records and conducting regular checks can help you quickly spot and address inefficiencies or contamination problems.
Using this metric consistently will guide you in refining your overall food waste reduction efforts.
5. Cost Savings from Reduction
Once you've measured waste quantities, it's time to calculate the financial impact. Tracking cost savings not only highlights the benefits of waste reduction but also helps identify areas for further improvement. Keeping an eye on cost changes can uncover inefficiencies and guide better decision-making.
Here are key cost areas to monitor:
Disposal Fees: Keep tabs on expenses for waste hauling, landfill use, and recycling services. Reducing waste can cut these costs significantly.
Inventory Management: Look at how reduced spoilage and better stock turnover impact your bottom line. Less waste often means smarter inventory practices.
Purchase Costs: Analyze savings from more accurate ordering. Ordering just what you need can prevent overstock and unnecessary spending.
Start by documenting your baseline costs, then update your savings figures regularly. Reviewing these components ensures you're seeing real financial benefits. Use this data alongside other waste metrics to fine-tune your reduction strategy.
This method not only showcases financial benefits but also helps streamline operations.
6. Food Loss Before Sale
Monitoring food loss before sale helps identify areas where waste can be minimized, particularly in spoilage, handling damage, and expired products.
Focus on these key areas:
Spoilage rates by product type
Damage during transit and storage
Products expiring before they’re sold
To track this effectively, set up a detailed inventory system that includes:
Daily waste logs: Record the types and amounts of discarded items.
Receiving inspections: Document any items rejected due to damage or quality issues.
Organize your tracking with a simple system:
Loss Category | What to Measure | How Often |
|---|---|---|
Spoilage | Weight or units lost | Daily |
Damage | Number of items and cause | Per incident |
Expiration | Product type and remaining shelf life | Weekly |
This data is crucial for shaping larger waste reduction plans.
Tips to cut down on pre-sale losses:
Use FIFO (First In, First Out) to manage inventory effectively.
Set up automated alerts for storage condition monitoring.
Train employees on proper handling techniques.
Adjust order sizes based on past loss trends.
7. Uneaten Food Returns
Monitoring uneaten food returns can help fine-tune portion sizes, improve menu offerings, and reduce costs. By analyzing the amount and types of leftover food, businesses can better understand portion sizing, menu effectiveness, and waste patterns.
Here’s what to focus on:
Weighing uneaten food to measure the extent of waste.
Spotting frequently uneaten items to identify underperforming menu options.
Assessing portion sizes based on recurring trends.
This data works alongside other metrics like waste per unit and pre-sale food loss to give a more complete view of waste management. Using these insights, businesses can adjust portions and menus to minimize waste. For example, Council Fire incorporates this metric into its waste reduction strategy to improve efficiency and cut costs.
8. Food Bank Contributions
Tracking food bank donations helps measure both waste reduction efforts and their positive effects on the community. While internal waste metrics focus on your operations, food bank contributions highlight how waste reduction can support those in need.
Here’s what to monitor:
Donation Volume: Total weight in pounds
Donation Frequency: How often donations are made
Food Categories: Types of food donated
Monetary Value: Retail equivalent of the donations
Meals Equivalent: Convert weight to meals (1.2 pounds equals 1 meal)
Key Steps to Record Contributions
1. Pre-donation Assessment
Check the quality of the food, confirm remaining shelf life, and review temperature logs for any perishable items.
2. Documentation
Keep detailed records, including:
Weight or unit counts
Food categories
Recipient organization information
3. Impact Metrics
Track how donations benefit the community by recording:
Number of people served
Community demographics
Environmental benefits, such as reduced waste
Why It Matters
Using a digital tracking system can simplify reporting and provide accurate data. Council Fire suggests collaborating with local food banks to ensure donations are impactful and well-documented.
Donation Metric | Measure | Purpose |
|---|---|---|
Volume | Pounds/units donated | Tracks total contribution |
Frequency | Donations per week/month | Helps streamline logistics |
Categories | Types of food donated | Ensures a balanced variety |
Value | Retail equivalent | Highlights financial importance |
Impact | Meals provided | Reflects community support |
These insights not only showcase the immediate benefits of your contributions but also help identify areas for operational improvement.
9. Carbon Impact Reduction
Tracking carbon impact goes beyond operational metrics - it highlights the environmental advantages of reducing waste. By measuring how food waste reduction affects carbon emissions, you can demonstrate environmental benefits and align with sustainability goals.
Key Carbon Metrics to Monitor
Focus on two primary sources of emission reductions:
Landfill emissions: Cutting down food decomposition in landfills reduces methane release.
Transportation emissions: Optimized logistics and less waste hauling lower emissions from transport.
These insights help shape actionable steps for improvement.
How to Implement
Establish a Baseline
Start by documenting current emissions, especially those from landfill disposal and transportation.
Set Up a Data Collection System
Use digital tools to monitor daily waste volumes and track transportation-related data.
Analyze Regularly
Calculate emission reductions periodically (e.g., monthly or quarterly) to:
Measure progress toward goals.
Pinpoint areas needing improvement.
Refine reduction strategies.
Share updates with stakeholders.
These steps ensure you stay on track and achieve measurable results.
Tips for Effective Tracking
Keep Detailed Records
Log the amount of waste diverted from landfills.
Document transportation logistics for waste management.
Note disposal methods and practices.
Verify Your Data
Perform regular audits to maintain accuracy.
When possible, involve third-party verification.
Use standardized tracking methods for consistency.
Maintain organized records of all assessments and findings.
10. Resource Conservation Results
Tracking resource conservation goes hand-in-hand with reducing carbon impact, offering a broader view of how cutting food waste benefits the environment. By monitoring conservation efforts, organizations can better understand the environmental impact of their food waste reduction strategies.
Key Resource Metrics
Focus on these areas to measure conservation efforts effectively:
Water Usage
Keep an eye on water consumption during food processing and crop production. Improvements in irrigation efficiency should also be tracked.
Energy Use
Measure reductions in energy used for food storage and transportation. Efficiency in cooling systems and fuel use are key areas to monitor.
Land Utilization
Evaluate how much agricultural land is required and monitor the efficiency of composting and storage areas.
Implementation Strategy
Establish a Baseline
Before making changes, measure current resource usage to create a benchmark.
Track Resource Categories
Use the table below to guide your tracking efforts:
Resource Type | Focus Area | Tracking Tools |
|---|---|---|
Water | Processing & Cleaning | Flow meters, usage logs |
Energy | Storage & Transportation | Utility tracking tools |
Land | Production & Storage | Space utilization data |
These steps ensure you're not just reducing waste but also making measurable gains in resource conservation.
Best Practices
Resource conservation is a key metric that highlights the broader benefits of waste reduction. For the best results:
Conduct regular efficiency reviews to identify areas for improvement.
Analyze trends over time to spot patterns and opportunities.
Adjust your strategies as new data becomes available.
Tips for Data Collection
Automate monitoring wherever possible to save time and improve accuracy.
Update your metrics monthly to reflect direct and indirect savings.
Share your findings with stakeholders every quarter to maintain transparency and engagement.
Using Metrics for Improvement
Turn raw food waste data into practical steps for improvement by analyzing metrics and setting clear goals. By building on existing measurement systems, you can transform numbers into impactful changes.
Establishing Performance Baselines
Begin by recording your current performance across all ten metrics. This baseline serves as a starting point to:
Pinpoint problem areas that need immediate action
Set realistic, achievable improvement goals
Track how well new initiatives are working
Creating SMART Goals
Set specific, measurable targets based on your metrics to drive meaningful changes. For example:
Metric Category | Sample SMART Goal | Measurement Method |
|---|---|---|
Total Waste Volume | Reduce kitchen waste by 25% within 6 months | Daily weight tracking |
Cost Savings | Save $10,000 monthly through waste reduction by Q4 2025 | Financial reports |
Carbon Impact | Lower waste-related emissions by 30% by December 2025 | Carbon calculator tools |
Once goals are in place, use the data to fine-tune processes and allocate resources where they’re needed most.
Data-Driven Decision Making
Metrics can guide decisions in areas like:
Process Improvements: Spot inefficient workflows contributing to waste.
Staff Training: Direct training efforts toward teams or departments with lower performance.
Industry Benchmarking
Compare your baseline data with industry standards to refine your approach. Consider factors such as:
Sector-Specific Metrics: Different industries have varying acceptable waste levels.
Regional Factors: Adjust for local infrastructure and seasonal changes.
Business Size: Benchmark against companies of a similar scale.
Implementation Support
Get expert help to stay on track by:
Developing custom tracking systems tailored to your operations
Setting realistic reduction targets with strategic guidance
Conducting regular performance reviews to ensure steady progress
Continuous Improvement Cycle
Adopt a structured cycle to keep improving:
1. Monthly Analysis
Review metrics every month to spot trends and changes in waste levels.
2. Quarterly Assessments
Dive deeper into performance data every three months. Compare results to goals and tweak strategies as needed.
3. Annual Strategy Review
Evaluate your waste reduction program yearly to assess:
Progress toward long-term objectives
ROI from reduction efforts
Opportunities for scaling or expanding the program
Use digital tools to make these reviews easier and more efficient.
Technology Integration
Incorporate digital tools to simplify metric tracking and analysis:
Automated Data Collection: Use systems that gather waste data in real-time.
Analysis Software: Leverage programs that highlight patterns and trends.
Reporting Dashboards: Create visual summaries of key metrics for clear communication with stakeholders.
Consistent monitoring and a willingness to adapt based on data are essential for success. Regularly reviewing and refining your approach ensures steady progress toward reducing waste.
Data Comparison Methods
Effective data comparison methods build on the metrics discussed earlier to identify trends in food waste over time and across locations. These comparisons work hand-in-hand with measurement techniques to provide clear insights.
Time-Based Comparison Framework
Track progress quarterly with standardized tables:
Metric | Q1 2025 | Q2 2025 | Change | Target |
|---|---|---|---|---|
Total Waste (lbs) | 12,500 | 11,000 | -12% | -15% |
Cost per Unit | $2.75 | $2.45 | -11% | -20% |
Diversion Rate | 65% | 72% | +7% | 80% |
Location Performance Matrix
Compare performance across facilities to identify areas for improvement:
Location | Daily Waste (lbs) | Monthly Cost ($) | Diversion % |
|---|---|---|---|
Main Kitchen | 250 | 3,500 | 75% |
Prep Area | 175 | 2,400 | 68% |
Storage | 125 | 1,800 | 82% |
Cross-Department Analysis
Standardize Measurements
To ensure consistency across departments:
Use the same scales for all measurements.
Record data at fixed intervals.
Categorize data uniformly.
Adjust raw data for factors like production volume, operating hours, staff numbers, and seasonal variations for accurate comparisons.
Trend Analysis Tools
Visual dashboards can help track:
Weekly changes in waste volume.
Monthly cost fluctuations.
Quarterly diversion rate progress.
Year-over-year performance improvements.
These tools help maintain quality control and establish best practices.
Standardized Reporting Template
A reporting template simplifies data tracking and communication:
Volume Metrics
Weight in pounds.
Number of containers.
Batch quantities.
Financial Impact
Cost per pound.
Monthly disposal expenses.
Savings from waste reduction.
Environmental Measures
Avoided carbon emissions.
Water saved.
Reduced landfill usage.
This template integrates with existing tracking systems for seamless reporting.
Data Quality Controls
Maintain accuracy with these checks:
Daily calibration of equipment.
Weekly data validation processes.
Monthly accuracy reviews.
Quarterly system audits.
Comparison Best Practices
For reliable comparisons, follow these guidelines:
Use consistent data collection methods.
Document any changes in methodology or operations.
Factor in seasonal differences when analyzing trends.
This structured approach supports accurate and actionable insights for reducing food waste across your organization.
Conclusion
Effective tracking combines accurate measurement with actionable insights. The ten metrics discussed offer a solid framework for organizations to monitor and reduce waste while achieving both environmental and financial gains.
By focusing on key indicators like total waste volume, diversion rates, and cost savings, teams can pinpoint areas that need improvement. A consistent measurement approach paired with thorough data analysis supports smarter decisions that lead to real progress. This data helps guide immediate, impactful changes.
"Truly successful organizations make money and produce positive environmental and social benefits." - George Chmael II, founder of Council Fire
Sticking to reliable measurement protocols, adjusting strategies based on findings, and sharing results with stakeholders can boost engagement and drive better outcomes.
Reducing food waste requires ongoing measurement and continuous refinement. Organizations that track these metrics put themselves in a strong position to cut waste significantly and meet their sustainability goals.
Council Fire’s team offers expert guidance on implementing robust measurement systems and crafting data-driven strategies that benefit both the planet and the bottom line.
FAQs
What steps can businesses take to successfully implement a digital system for tracking food waste reduction?
To successfully implement a digital system for tracking food waste, businesses should start by identifying their specific goals, such as reducing waste by a certain percentage or identifying inefficiencies in their operations. Next, choose a user-friendly platform that aligns with your organization's needs and integrates seamlessly with your existing processes.
Train your team to use the system effectively and ensure consistent data entry for accurate tracking. Regularly analyze the collected data to spot trends, measure progress, and make informed decisions to reduce waste further. By taking these steps, businesses can create a streamlined and effective approach to minimizing food waste while boosting sustainability efforts.
What are some effective ways to boost recycling rates in a food service operation?
Improving recycling rates in a food service operation requires a combination of thoughtful planning, staff engagement, and clear communication. Here are some practical steps:
Set up clear and accessible recycling stations: Place well-labeled bins in convenient locations and ensure they are easy to use.
Train staff regularly: Educate employees on proper recycling practices and the importance of reducing waste.
Monitor and adjust: Track recycling performance and make adjustments as needed to improve efficiency.
Additionally, creating a culture of sustainability by celebrating milestones and sharing progress can motivate teams to stay committed to reducing waste and improving recycling efforts.
How does reducing food waste help save money and protect the environment?
Reducing food waste not only saves money but also helps protect the environment. By minimizing waste, organizations can cut costs associated with purchasing, storage, and disposal of unused food. At the same time, it reduces greenhouse gas emissions from landfills and conserves resources like water and energy used in food production.
Council Fire works with organizations to align financial success with sustainable practices, helping them achieve measurable impacts in reducing food waste and promoting environmental stewardship.
Related posts


FAQ
01
What does a project look like?
02
How is the pricing structure?
03
Are all projects fixed scope?
04
What is the ROI?
05
How do we measure success?
06
What do I need to get started?
07
How easy is it to edit for beginners?
08
Do I need to know how to code?
Apr 25, 2025
10 Metrics for Tracking Food Waste Reduction
Sustainability Strategy
10-metrics-for-tracking-food-waste-reduction
10-metrics-for-tracking-food-waste-reduction
Here’s how you can measure and reduce food waste effectively:
Total Waste Volume: Measure how much waste you produce to find problem areas.
Waste per Unit: Track waste per meal, production batch, or revenue to identify inefficiencies.
Landfill Diversion Rate: Calculate the percentage of waste kept out of landfills through composting or donations.
Recycling Success Rate: Measure how much collected waste is successfully turned into compost, animal feed, or biogas.
Cost Savings: Keep track of money saved by reducing waste, like lower disposal fees and smarter inventory management.
Food Loss Before Sale: Monitor spoilage, damage, and expired products to improve storage and handling.
Uneaten Food Returns: Analyze leftovers to adjust portion sizes and menu options.
Food Bank Contributions: Track donations to measure waste reduction and community impact.
Carbon Impact Reduction: Measure how cutting waste lowers emissions from landfills and transportation.
Resource Conservation: Monitor savings in water, energy, and land use from waste reduction efforts.
Quick Tip: Start by setting up a tracking system with digital tools, physical measurements, and clear documentation. Train your staff and review data regularly to refine your strategy.
Measuring Food Waste: The Global FLW Standard
Setting Up Food Waste Measurement
Establishing a clear system for measuring food waste is essential for effective tracking. This system forms the backbone for analyzing the key metrics discussed in later sections.
A reliable setup generally includes three main components:
Digital Tracking Systems
Use waste management software to log daily waste volumes, sort waste into categories, and create automated reports. These systems can also sync with inventory management tools to provide real-time updates.
Physical Measurement Tools
Essential tools include:
Digital scales for accurate weight tracking
Transparent waste bins for easy visual checks
Color-coded containers to separate waste types
Devices to monitor storage temperatures
Documentation Protocols
Staff should consistently record:
The weight or volume of waste
Where the waste originated
The reason for disposal
Time and date of disposal
Who handled the waste
Combining automated tools (like smart bins) with manual documentation ensures a more complete picture of waste patterns.
Staff Training
Proper training is key to the system's success. Focus on:
Practicing with measurement tools
Understanding how to categorize waste
Following proper documentation steps
Holding regular refresher sessions to maintain skills
Quality Control
To maintain accuracy, implement weekly spot checks, calibrate scales monthly, and review waste categorization quarterly.
Data Integration
Link your tracking system with inventory, purchasing, sales, and accounting tools. This integration helps turn raw data into actionable insights.
As your waste reduction program evolves, adjust and refine your system to meet changing needs.
1. Total Waste Volume
Start by measuring the total amount of waste your operation generates. Use pounds for smaller businesses or tons for larger facilities. This initial measurement provides a clear starting point, helping you identify areas where waste is most concentrated and where to focus reduction efforts.
To get a more detailed picture, compare waste levels to production output. This ratio can highlight inefficiencies and guide more precise strategies.
2. Waste per Unit
Measuring waste per unit connects waste levels to specific operational metrics, helping to identify inefficiencies over time and at different scales.
For restaurants and food service businesses, track waste based on meals served. For instance, if your kitchen prepares 500 meals a day and generates 50 pounds of food waste, your waste-per-meal figure would be 0.1 pounds. This allows you to see which menu items or prep methods are causing the most waste. Similarly, in manufacturing, you can calculate waste as a percentage of total production.
For food manufacturers and processors, break waste into categories like:
Waste from raw materials during processing
Finished product waste due to quality control
Losses during storage and handling
Waste generated during distribution
Ways to measure waste:
Per $1,000 in revenue
Per 100 meals served
Per 1,000 pounds of production
Per operating hour
Track these metrics daily, then review weekly to spot trends, such as increases during delivery days or employee transitions. Adjust for seasonal changes to set realistic goals for cutting waste.
3. Landfill Diversion Rate
The landfill diversion rate shows the percentage of food waste that avoids landfills by being composted, processed through anaerobic digestion, or donated.
Formula:
Diversion Rate = ((Total Food Waste – Food Waste Sent to Landfill) / Total Food Waste) x 100
Example:
If a business generates 1,000 lbs. of food waste and sends 300 lbs. to landfills, the calculation would look like this:
(1,000 – 300) / 1,000 x 100 = 70%
This means 70% of the food waste is kept out of landfills. Up next, we’ll explore how recycling efforts can further improve waste reduction strategies.
4. Recycling Success Rate
The recycling success rate shows how efficiently your organization turns food waste into usable resources like compost, animal feed, or biogas. It helps identify areas where improvements are needed in your recycling process.
Formula:
Recycling Success Rate = (Successfully Recycled Food Waste / Total Food Waste Collected for Recycling) x 100
This percentage represents how much of the collected food waste is effectively recycled. For instance, if you gather 2,000 lbs. of food waste for composting but only 1,600 lbs. produces usable compost, your recycling success rate would be:
1,600 / 2,000 x 100 = 80%
To improve this rate, pay close attention to factors like the quality of waste collected (e.g., contamination levels), the efficiency of your recycling process, and the quality of the final recycled product. Keeping detailed records and conducting regular checks can help you quickly spot and address inefficiencies or contamination problems.
Using this metric consistently will guide you in refining your overall food waste reduction efforts.
5. Cost Savings from Reduction
Once you've measured waste quantities, it's time to calculate the financial impact. Tracking cost savings not only highlights the benefits of waste reduction but also helps identify areas for further improvement. Keeping an eye on cost changes can uncover inefficiencies and guide better decision-making.
Here are key cost areas to monitor:
Disposal Fees: Keep tabs on expenses for waste hauling, landfill use, and recycling services. Reducing waste can cut these costs significantly.
Inventory Management: Look at how reduced spoilage and better stock turnover impact your bottom line. Less waste often means smarter inventory practices.
Purchase Costs: Analyze savings from more accurate ordering. Ordering just what you need can prevent overstock and unnecessary spending.
Start by documenting your baseline costs, then update your savings figures regularly. Reviewing these components ensures you're seeing real financial benefits. Use this data alongside other waste metrics to fine-tune your reduction strategy.
This method not only showcases financial benefits but also helps streamline operations.
6. Food Loss Before Sale
Monitoring food loss before sale helps identify areas where waste can be minimized, particularly in spoilage, handling damage, and expired products.
Focus on these key areas:
Spoilage rates by product type
Damage during transit and storage
Products expiring before they’re sold
To track this effectively, set up a detailed inventory system that includes:
Daily waste logs: Record the types and amounts of discarded items.
Receiving inspections: Document any items rejected due to damage or quality issues.
Organize your tracking with a simple system:
Loss Category | What to Measure | How Often |
|---|---|---|
Spoilage | Weight or units lost | Daily |
Damage | Number of items and cause | Per incident |
Expiration | Product type and remaining shelf life | Weekly |
This data is crucial for shaping larger waste reduction plans.
Tips to cut down on pre-sale losses:
Use FIFO (First In, First Out) to manage inventory effectively.
Set up automated alerts for storage condition monitoring.
Train employees on proper handling techniques.
Adjust order sizes based on past loss trends.
7. Uneaten Food Returns
Monitoring uneaten food returns can help fine-tune portion sizes, improve menu offerings, and reduce costs. By analyzing the amount and types of leftover food, businesses can better understand portion sizing, menu effectiveness, and waste patterns.
Here’s what to focus on:
Weighing uneaten food to measure the extent of waste.
Spotting frequently uneaten items to identify underperforming menu options.
Assessing portion sizes based on recurring trends.
This data works alongside other metrics like waste per unit and pre-sale food loss to give a more complete view of waste management. Using these insights, businesses can adjust portions and menus to minimize waste. For example, Council Fire incorporates this metric into its waste reduction strategy to improve efficiency and cut costs.
8. Food Bank Contributions
Tracking food bank donations helps measure both waste reduction efforts and their positive effects on the community. While internal waste metrics focus on your operations, food bank contributions highlight how waste reduction can support those in need.
Here’s what to monitor:
Donation Volume: Total weight in pounds
Donation Frequency: How often donations are made
Food Categories: Types of food donated
Monetary Value: Retail equivalent of the donations
Meals Equivalent: Convert weight to meals (1.2 pounds equals 1 meal)
Key Steps to Record Contributions
1. Pre-donation Assessment
Check the quality of the food, confirm remaining shelf life, and review temperature logs for any perishable items.
2. Documentation
Keep detailed records, including:
Weight or unit counts
Food categories
Recipient organization information
3. Impact Metrics
Track how donations benefit the community by recording:
Number of people served
Community demographics
Environmental benefits, such as reduced waste
Why It Matters
Using a digital tracking system can simplify reporting and provide accurate data. Council Fire suggests collaborating with local food banks to ensure donations are impactful and well-documented.
Donation Metric | Measure | Purpose |
|---|---|---|
Volume | Pounds/units donated | Tracks total contribution |
Frequency | Donations per week/month | Helps streamline logistics |
Categories | Types of food donated | Ensures a balanced variety |
Value | Retail equivalent | Highlights financial importance |
Impact | Meals provided | Reflects community support |
These insights not only showcase the immediate benefits of your contributions but also help identify areas for operational improvement.
9. Carbon Impact Reduction
Tracking carbon impact goes beyond operational metrics - it highlights the environmental advantages of reducing waste. By measuring how food waste reduction affects carbon emissions, you can demonstrate environmental benefits and align with sustainability goals.
Key Carbon Metrics to Monitor
Focus on two primary sources of emission reductions:
Landfill emissions: Cutting down food decomposition in landfills reduces methane release.
Transportation emissions: Optimized logistics and less waste hauling lower emissions from transport.
These insights help shape actionable steps for improvement.
How to Implement
Establish a Baseline
Start by documenting current emissions, especially those from landfill disposal and transportation.
Set Up a Data Collection System
Use digital tools to monitor daily waste volumes and track transportation-related data.
Analyze Regularly
Calculate emission reductions periodically (e.g., monthly or quarterly) to:
Measure progress toward goals.
Pinpoint areas needing improvement.
Refine reduction strategies.
Share updates with stakeholders.
These steps ensure you stay on track and achieve measurable results.
Tips for Effective Tracking
Keep Detailed Records
Log the amount of waste diverted from landfills.
Document transportation logistics for waste management.
Note disposal methods and practices.
Verify Your Data
Perform regular audits to maintain accuracy.
When possible, involve third-party verification.
Use standardized tracking methods for consistency.
Maintain organized records of all assessments and findings.
10. Resource Conservation Results
Tracking resource conservation goes hand-in-hand with reducing carbon impact, offering a broader view of how cutting food waste benefits the environment. By monitoring conservation efforts, organizations can better understand the environmental impact of their food waste reduction strategies.
Key Resource Metrics
Focus on these areas to measure conservation efforts effectively:
Water Usage
Keep an eye on water consumption during food processing and crop production. Improvements in irrigation efficiency should also be tracked.
Energy Use
Measure reductions in energy used for food storage and transportation. Efficiency in cooling systems and fuel use are key areas to monitor.
Land Utilization
Evaluate how much agricultural land is required and monitor the efficiency of composting and storage areas.
Implementation Strategy
Establish a Baseline
Before making changes, measure current resource usage to create a benchmark.
Track Resource Categories
Use the table below to guide your tracking efforts:
Resource Type | Focus Area | Tracking Tools |
|---|---|---|
Water | Processing & Cleaning | Flow meters, usage logs |
Energy | Storage & Transportation | Utility tracking tools |
Land | Production & Storage | Space utilization data |
These steps ensure you're not just reducing waste but also making measurable gains in resource conservation.
Best Practices
Resource conservation is a key metric that highlights the broader benefits of waste reduction. For the best results:
Conduct regular efficiency reviews to identify areas for improvement.
Analyze trends over time to spot patterns and opportunities.
Adjust your strategies as new data becomes available.
Tips for Data Collection
Automate monitoring wherever possible to save time and improve accuracy.
Update your metrics monthly to reflect direct and indirect savings.
Share your findings with stakeholders every quarter to maintain transparency and engagement.
Using Metrics for Improvement
Turn raw food waste data into practical steps for improvement by analyzing metrics and setting clear goals. By building on existing measurement systems, you can transform numbers into impactful changes.
Establishing Performance Baselines
Begin by recording your current performance across all ten metrics. This baseline serves as a starting point to:
Pinpoint problem areas that need immediate action
Set realistic, achievable improvement goals
Track how well new initiatives are working
Creating SMART Goals
Set specific, measurable targets based on your metrics to drive meaningful changes. For example:
Metric Category | Sample SMART Goal | Measurement Method |
|---|---|---|
Total Waste Volume | Reduce kitchen waste by 25% within 6 months | Daily weight tracking |
Cost Savings | Save $10,000 monthly through waste reduction by Q4 2025 | Financial reports |
Carbon Impact | Lower waste-related emissions by 30% by December 2025 | Carbon calculator tools |
Once goals are in place, use the data to fine-tune processes and allocate resources where they’re needed most.
Data-Driven Decision Making
Metrics can guide decisions in areas like:
Process Improvements: Spot inefficient workflows contributing to waste.
Staff Training: Direct training efforts toward teams or departments with lower performance.
Industry Benchmarking
Compare your baseline data with industry standards to refine your approach. Consider factors such as:
Sector-Specific Metrics: Different industries have varying acceptable waste levels.
Regional Factors: Adjust for local infrastructure and seasonal changes.
Business Size: Benchmark against companies of a similar scale.
Implementation Support
Get expert help to stay on track by:
Developing custom tracking systems tailored to your operations
Setting realistic reduction targets with strategic guidance
Conducting regular performance reviews to ensure steady progress
Continuous Improvement Cycle
Adopt a structured cycle to keep improving:
1. Monthly Analysis
Review metrics every month to spot trends and changes in waste levels.
2. Quarterly Assessments
Dive deeper into performance data every three months. Compare results to goals and tweak strategies as needed.
3. Annual Strategy Review
Evaluate your waste reduction program yearly to assess:
Progress toward long-term objectives
ROI from reduction efforts
Opportunities for scaling or expanding the program
Use digital tools to make these reviews easier and more efficient.
Technology Integration
Incorporate digital tools to simplify metric tracking and analysis:
Automated Data Collection: Use systems that gather waste data in real-time.
Analysis Software: Leverage programs that highlight patterns and trends.
Reporting Dashboards: Create visual summaries of key metrics for clear communication with stakeholders.
Consistent monitoring and a willingness to adapt based on data are essential for success. Regularly reviewing and refining your approach ensures steady progress toward reducing waste.
Data Comparison Methods
Effective data comparison methods build on the metrics discussed earlier to identify trends in food waste over time and across locations. These comparisons work hand-in-hand with measurement techniques to provide clear insights.
Time-Based Comparison Framework
Track progress quarterly with standardized tables:
Metric | Q1 2025 | Q2 2025 | Change | Target |
|---|---|---|---|---|
Total Waste (lbs) | 12,500 | 11,000 | -12% | -15% |
Cost per Unit | $2.75 | $2.45 | -11% | -20% |
Diversion Rate | 65% | 72% | +7% | 80% |
Location Performance Matrix
Compare performance across facilities to identify areas for improvement:
Location | Daily Waste (lbs) | Monthly Cost ($) | Diversion % |
|---|---|---|---|
Main Kitchen | 250 | 3,500 | 75% |
Prep Area | 175 | 2,400 | 68% |
Storage | 125 | 1,800 | 82% |
Cross-Department Analysis
Standardize Measurements
To ensure consistency across departments:
Use the same scales for all measurements.
Record data at fixed intervals.
Categorize data uniformly.
Adjust raw data for factors like production volume, operating hours, staff numbers, and seasonal variations for accurate comparisons.
Trend Analysis Tools
Visual dashboards can help track:
Weekly changes in waste volume.
Monthly cost fluctuations.
Quarterly diversion rate progress.
Year-over-year performance improvements.
These tools help maintain quality control and establish best practices.
Standardized Reporting Template
A reporting template simplifies data tracking and communication:
Volume Metrics
Weight in pounds.
Number of containers.
Batch quantities.
Financial Impact
Cost per pound.
Monthly disposal expenses.
Savings from waste reduction.
Environmental Measures
Avoided carbon emissions.
Water saved.
Reduced landfill usage.
This template integrates with existing tracking systems for seamless reporting.
Data Quality Controls
Maintain accuracy with these checks:
Daily calibration of equipment.
Weekly data validation processes.
Monthly accuracy reviews.
Quarterly system audits.
Comparison Best Practices
For reliable comparisons, follow these guidelines:
Use consistent data collection methods.
Document any changes in methodology or operations.
Factor in seasonal differences when analyzing trends.
This structured approach supports accurate and actionable insights for reducing food waste across your organization.
Conclusion
Effective tracking combines accurate measurement with actionable insights. The ten metrics discussed offer a solid framework for organizations to monitor and reduce waste while achieving both environmental and financial gains.
By focusing on key indicators like total waste volume, diversion rates, and cost savings, teams can pinpoint areas that need improvement. A consistent measurement approach paired with thorough data analysis supports smarter decisions that lead to real progress. This data helps guide immediate, impactful changes.
"Truly successful organizations make money and produce positive environmental and social benefits." - George Chmael II, founder of Council Fire
Sticking to reliable measurement protocols, adjusting strategies based on findings, and sharing results with stakeholders can boost engagement and drive better outcomes.
Reducing food waste requires ongoing measurement and continuous refinement. Organizations that track these metrics put themselves in a strong position to cut waste significantly and meet their sustainability goals.
Council Fire’s team offers expert guidance on implementing robust measurement systems and crafting data-driven strategies that benefit both the planet and the bottom line.
FAQs
What steps can businesses take to successfully implement a digital system for tracking food waste reduction?
To successfully implement a digital system for tracking food waste, businesses should start by identifying their specific goals, such as reducing waste by a certain percentage or identifying inefficiencies in their operations. Next, choose a user-friendly platform that aligns with your organization's needs and integrates seamlessly with your existing processes.
Train your team to use the system effectively and ensure consistent data entry for accurate tracking. Regularly analyze the collected data to spot trends, measure progress, and make informed decisions to reduce waste further. By taking these steps, businesses can create a streamlined and effective approach to minimizing food waste while boosting sustainability efforts.
What are some effective ways to boost recycling rates in a food service operation?
Improving recycling rates in a food service operation requires a combination of thoughtful planning, staff engagement, and clear communication. Here are some practical steps:
Set up clear and accessible recycling stations: Place well-labeled bins in convenient locations and ensure they are easy to use.
Train staff regularly: Educate employees on proper recycling practices and the importance of reducing waste.
Monitor and adjust: Track recycling performance and make adjustments as needed to improve efficiency.
Additionally, creating a culture of sustainability by celebrating milestones and sharing progress can motivate teams to stay committed to reducing waste and improving recycling efforts.
How does reducing food waste help save money and protect the environment?
Reducing food waste not only saves money but also helps protect the environment. By minimizing waste, organizations can cut costs associated with purchasing, storage, and disposal of unused food. At the same time, it reduces greenhouse gas emissions from landfills and conserves resources like water and energy used in food production.
Council Fire works with organizations to align financial success with sustainable practices, helping them achieve measurable impacts in reducing food waste and promoting environmental stewardship.
Related posts
FAQ
What does a project look like?
How is the pricing structure?
Are all projects fixed scope?
What is the ROI?
How do we measure success?
What do I need to get started?
How easy is it to edit for beginners?
Do I need to know how to code?